
As confidentially submitted to the Securities and Exchange Commission on February 1, 2021
This draft registration statement has not been publicly filed with the Securities and Exchange Commission and all information herein remains strictly confidential.
Registration No. 333-
UNITED STATES
SECURITIES AND EXCHANGE COMMISSION
WASHINGTON, D.C. 20549
FORM S-1
REGISTRATION STATEMENT
UNDER
THE SECURITIES ACT OF 1933
LESLIE’S, INC.
(Exact name of Registrant as specified in its charter)
| Delaware | 5091 | 20-8397425 | ||
| (State or other jurisdiction of incorporation or organization) |
(Primary Standard Industrial Classification Code Number) |
(I.R.S. Employer Identification Number) |
2005 East Indian School Road
Phoenix, Arizona 85016
(602) 366-3999
(Address, including zip code, and telephone number, including area code, of registrant’s principal executive offices)
Brad A. Gazaway
Senior Vice President, General Counsel
Leslie’s, Inc.
2005 East Indian School Road
Phoenix, Arizona 85016
(602) 366-3999
(Name, address, including zip code, and telephone number, including area code, of agent for service)
Copies to:
| Jennifer Bellah Maguire Gibson, Dunn & Crutcher LLP 333 South Grand Avenue Los Angeles, CA 90071 (213) 229-7242 |
Marc D. Jaffe Latham & Watkins LLP |
Approximate date of commencement of proposed sale to the public:
As soon as practicable after this registration statement is declared effective.
If any of the securities being registered on this Form are to be offered on a delayed or continuous basis pursuant to Rule 415 under the Securities Act of 1933, check the following box. ☐
If this Form is filed to register additional securities for an offering pursuant to Rule 462(b) under the Securities Act, please check the following box and list the Securities Act registration statement number of the earlier effective registration statement for the same offering. ☐
If this Form is a post-effective amendment filed pursuant to Rule 462(c) under the Securities Act, check the following box and list the Securities Act registration statement number of the earlier effective registration statement for the same offering. ☐
If this Form is a post-effective amendment filed pursuant to Rule 462(d) under the Securities Act, check the following box and list the Securities Act registration statement number of the earlier effective registration statement for the same offering. ☐
Indicate by check mark whether the registrant is a large accelerated filer, an accelerated filer, a non-accelerated filer, a smaller reporting company or an emerging growth company. See the definitions of “large accelerated filer,” “accelerated filer,” “smaller reporting company” and “emerging growth company” in Rule 12b-2 of the Exchange Act.
| Large accelerated filer ☐ | Accelerated filer ☐ | Non-accelerated filer ☒ | Smaller reporting company ☐ | Emerging growth company ☐ |
If an emerging growth company, indicate by check mark if the registrant has elected not to use the extended transition period for complying with new or revised financial accounting standards provided pursuant to Section 7(a)(2)(B) of the Securities Act. ☐
CALCULATION OF REGISTRATION FEE
|
| ||||||||
| Title of Each Class of Securities to be Registered |
Amount to be Registered(1) |
Proposed Per Unit(2) |
Proposed Maximum Aggregate Offering Price(1)(2) |
Amount of Registration Fee | ||||
| Common Stock, $0.001 par value per share | $ | $ | $ | |||||
|
| ||||||||
|
| ||||||||
| (1) | Includes shares of common stock that the underwriters have the option to purchase. See “Underwriting.” |
| (2) | Estimated solely for the purpose of calculating the registration fee under Rule 457(c) of the Securities Act of 1933, as amended, based on the average of the high and low prices of a share of common stock on The Nasdaq Global Select Market on , 2021, which was $ . |
The Registrant hereby amends this Registration Statement on such date or dates as may be necessary to delay its effective date until the Registrant shall file a further amendment which specifically states that this Registration Statement shall thereafter become effective in accordance with Section 8(a) of the Securities Act of 1933 or until the Registration Statement shall become effective on such date as the Commission, acting pursuant to said Section 8(a), may determine.


The information in this prospectus is not complete and may be changed. The securities may not be sold until the registration statement filed with the Securities and Exchange Commission is effective. This prospectus is not an offer to sell these securities and it is not soliciting an offer to buy these securities in any state where the offer or sale is not permitted.
Subject to completion,
Preliminary Prospectus dated , 2021
PROSPECTUS
Shares

Common Stock
$ per share
The selling stockholders identified in this prospectus are offering shares of our common stock. We will not receive any proceeds from the sale of shares of our common stock by the selling stockholders.
Our common stock is listed on The Nasdaq Global Select Market (“Nasdaq”) under the symbol “LESL.” On January 29, 2021, the last reported sales price of a share of our common stock on Nasdaq was $28.60.
Investing in our common stock involves risks. See the section titled “Risk Factors,” beginning on page 17 for a discussion of information that should be considered in connection with an investment in our common stock.
Neither the Securities and Exchange Commission nor any state securities commission has approved or disapproved of these securities or determined if this prospectus is truthful or complete. Any representation to the contrary is a criminal offense.
| Per Share | Total | |||||||
| Public offering price |
$ | $ | ||||||
| Underwriting discounts and commissions(1) |
$ | $ | ||||||
| Proceeds to the selling stockholders, before expenses |
$ | $ | ||||||
| (1) | See the section titled “Underwriting” for a description of compensation payable to the underwriters and estimated offering expenses. |
The underwriters may also exercise their option to purchase up to an additional shares from the selling stockholders at the public offering price less the underwriting discount for 30 days after the date of this prospectus.
The shares will be ready for delivery on or about , 2021.
| Goldman Sachs & Co. LLC | Morgan Stanley | BofA Securities |
The date of this prospectus is , 2021.
| Page | ||||
| 1 | ||||
| 14 | ||||
| SUMMARY HISTORICAL CONSOLIDATED FINANCIAL AND OTHER INFORMATION |
15 | |||
| 17 | ||||
| 38 | ||||
| 40 | ||||
| 41 | ||||
| 42 | ||||
| SELECTED HISTORICAL CONSOLIDATED FINANCIAL AND OTHER INFORMATION |
43 | |||
| MANAGEMENT’S DISCUSSION AND ANALYSIS OF FINANCIAL CONDITION AND RESULTS OF OPERATIONS |
45 | |||
| 62 | ||||
| 80 | ||||
| 90 | ||||
| 100 | ||||
| 102 | ||||
| 107 | ||||
| 109 | ||||
| CERTAIN MATERIAL UNITED STATES FEDERAL INCOME TAX CONSIDERATIONS |
112 | |||
| 117 | ||||
| 125 | ||||
| 126 | ||||
| 127 | ||||
| F-1 | ||||
You should rely only on the information contained in this prospectus or in any related free-writing prospectus prepared by or on behalf of us. We, the selling stockholders and the underwriters have not authorized anyone to provide you with information different from, or in addition to, the information contained in this prospectus or in any related free-writing prospectus. The information contained in this prospectus is current only as of the date of this prospectus, regardless of the time of delivery of this prospectus or of any sale of the shares of common stock.
We, the selling stockholders and the underwriters have not taken any action that would permit a public offering of the shares of common stock outside the United States or permit the possession or distribution of this prospectus or any related free-writing prospectus outside the United States. Persons outside the United States who come into possession of this prospectus or any related free-writing prospectus must inform themselves about and observe any restrictions relating to the offering of the shares of common stock and the distribution of the prospectus outside the United States.
i
Trademarks
Leslie’s®, AccuBlue®, MyLife®, and other trademarks, trade names or service marks of Leslie’s, Inc. appearing in this prospectus are the property of Leslie’s, Inc. All other trademarks, trade names, and service marks appearing in this prospectus are the property of their respective owners. Solely for convenience, the trademarks and trade names in this prospectus may be referred to without the ® and ™ symbols, but those references are not intended to indicate, in any way, that we will not assert, to the fullest extent under applicable law, our rights, or the rights of the applicable licensor to these trademarks and tradenames.
Market, Ranking, and Other Industry Data
In this prospectus, we refer to information regarding industry, market, and competitive position data that we obtained from our own internal estimates and research, as well as from independent market research, industry and general publications and surveys, governmental agencies, and publicly available information in addition to research, surveys, and studies conducted by third parties. In some cases, we do not expressly refer to the sources from which this data is derived. In that regard, when we refer to one or more sources of this type of data in any paragraph, you should assume that other data of this type appearing in the same paragraph is derived from the same sources, unless otherwise expressly stated or the context otherwise requires. All of the market and industry data used in this prospectus involve a number of assumptions and limitations, and you are cautioned not to give undue weight to such assumptions and limitations.
In addition, while we believe the industry, market, and competitive position data included in this prospectus is reliable and based on reasonable assumptions, such data involve risks and uncertainties and are subject to change based on various factors, including those described in the section titled “Risk Factors.” These and other factors could cause results to differ materially from those expressed in the estimates made by the independent parties or by us.
Non-GAAP Financial Measures
Comparable sales, comparable sales growth, adjusted EBITDA, adjusted net income and adjusted net income per share are our key non-GAAP financial measures. For more information about how we use these non-GAAP financial measures in our business, the limitations of these measures, and a reconciliation of these measures to the most directly comparable GAAP measures, please see the section titled “Management’s Discussion and Analysis of Financial Condition and Results of Operations––Key Factors and Measures We Use to Evaluate Our Business.”
ii
This summary highlights selected information contained elsewhere in this prospectus. This summary does not contain all of the information that you should consider before deciding to purchase our common stock in this offering. You should read the entire prospectus carefully, including the sections titled “Risk Factors,” and “Management’s Discussion and Analysis of Financial Condition and Results of Operations,” and our consolidated financial statements and the related notes included elsewhere in this prospectus, before making an investment decision. If you invest in our common stock, you are assuming a high degree of risk.
Unless otherwise indicated or the context otherwise requires, all references in this prospectus to “we,” “our,” “us,” “Leslie’s,” “the Company,” and “our Company” refer to Leslie’s, Inc. and its consolidated subsidiaries.
Our Business
Our Mission
We are committed to continuing our legacy as the most trusted authority in pool and spa care. Through our consumer-centric approach, we provide an unparalleled experience for all consumers across all channels, supported by leading product innovation, expert knowledge, and exceptional service.
Our Company
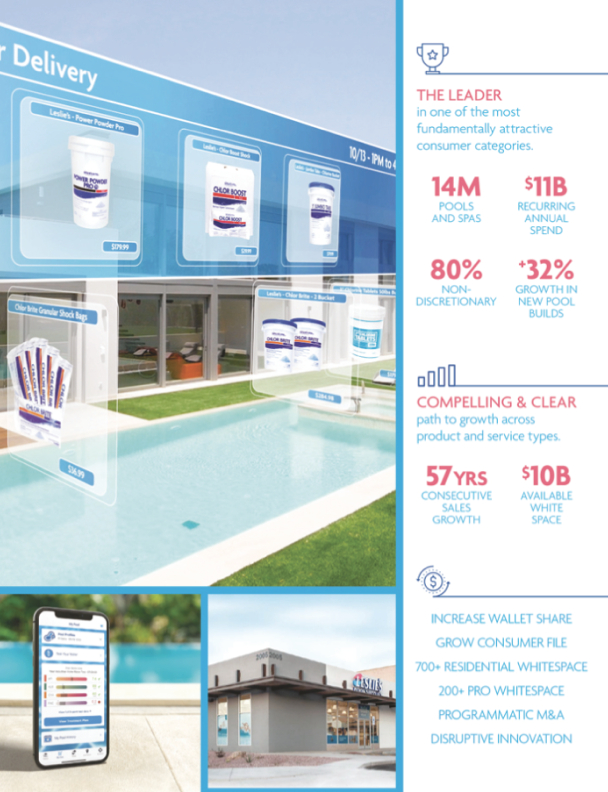
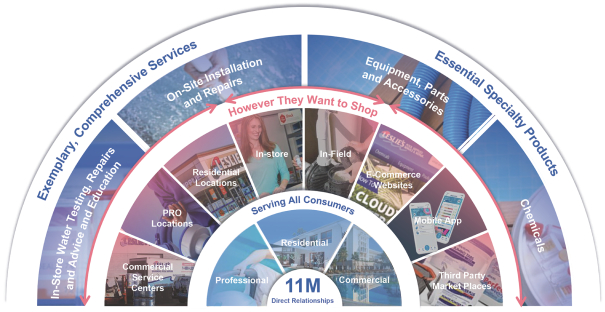
We are the largest and most trusted direct-to-consumer brand in the nearly $11 billion United States pool and spa care industry, serving residential, professional, and commercial consumers. Founded in 1963, we are the only direct-to-consumer pool and spa care brand with national scale, operating an integrated marketing and distribution ecosystem powered by a physical network of 936 branded locations and a robust digital platform. We command a market-leading share of nearly 15% of residential aftermarket product spend as of 2019, which represents an increase of approximately 500 basis points since 2010, our physical network is larger than the sum of our twenty largest competitors, and our digital sales are estimated to be greater than five times as large as that of our largest digital competitor. We offer an extensive assortment of professional-grade products, the majority of which are exclusive to Leslie’s, as well as certified installation and repair services, all of which are essential to the ongoing maintenance of pools and spas. Our dedicated team of associates, pool and spa care experts, and experienced service technicians are passionate about empowering our consumers with the knowledge, products, and solutions necessary to confidently maintain and enjoy their pools and spas. Over the last five years, we have spent more than $70 million in foundational investments across new technologies and capabilities focused on transforming our consumer experience and advancing our industry leadership. The unprecedented scale of our integrated marketing and distribution ecosystem, which is powered by our direct-to-consumer network, uniquely enables us to efficiently reach and service every pool and spa in the continental United States—capabilities no competitor can match.
1

The aftermarket pool and spa care industry is one of the most fundamentally attractive consumer categories given its scale, predictability, and growth outlook. Since 1970, when industry market data was first collected, the market has demonstrated consistent growth due to the non-discretionary nature of ongoing water treatment to maintain safe, sanitized water. Without proper ongoing maintenance, water quality quickly degrades, yielding unsafe conditions and risking equipment failure. As a result, each pool and spa represents an annuity-like stream of chemical, equipment, and service revenue for their average life span of over 25 years. We estimate the average in-ground pool owner spends $24,000 or more on maintenance products and services over the life of a pool. According to P.K. Data, the United States market is comprised of a growing installed base of more than 14 million pools and spas, and the installed base of residential in ground pools has grown every year for at least 50 years. The industry generated revenue of nearly $11 billion in 2019 and grew at a 3.8% CAGR from 2015 to 2019.
The industry is currently experiencing a significant increase in demand, as the COVID-19 pandemic has accelerated secular trends in consumer behavior. Consumers are increasingly focused on outdoor living, healthy lifestyles, sanitization and safety, migrating to lower density communities, and spending more time at home, all of which are fundamentally changing their spending patterns. In particular, the stay-at-home reality of the pandemic has led to significant growth in new pool installations and pool usage. Based on research performed by P.K. Data, new pool permit activity through July 2020 has grown by 32% over the comparable period in 2019 and is forecasted to achieve unprecedented year-over-year growth in new pool installations in 2020. This significant increase in new pool construction activity represents a permanent increase in demand for aftermarket products and services. Nearly 200,000 new in ground pools are expected to be constructed in 2020 and 2021, representing nearly $5 billion in estimated lifetime maintenance spend. While our business is not dependent on new pool construction, we believe we are uniquely positioned to capture a meaningful portion of the related aftermarket spend.
2
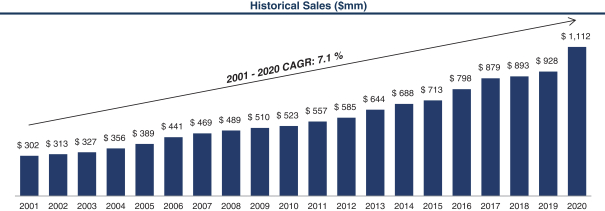
Given we play primarily in the aftermarket business, we have a highly predictable, recurring revenue model, as evidenced by our 57 consecutive years of sales growth. More than 80% of our assortment is comprised of non-discretionary products essential to the care of residential and commercial pools and spas. Our assortment includes chemicals, equipment and parts, cleaning and maintenance equipment, and safety, recreational, and fitness-related products. We also offer important, essential services, such as equipment installation and repair for residential and commercial consumers. Consumers receive the benefit of extended vendor warranties when purchasing product through our locations or when our certified in-field technicians install or repair equipment on-site. We also offer complimentary, commercial-grade, in-store water testing and analysis via our proprietary AccuBlue® system, which increases consumer engagement, conversion, basket size, and loyalty, resulting in higher lifetime value. Our water treatment expertise is powered by data and intelligence accumulated from the millions of water tests we have performed over our history, positioning us as the most trusted water treatment solutions provider in the industry. Due to the non-discretionary nature of our products and services, our business has historically delivered strong, uninterrupted growth and profitability in all market environments, including the Great Recession and the COVID-19 pandemic. Our growth has recently accelerated, and for fiscal year 2020, our sales increased 19.8%.
57 Years of Leadership and Disruptive Innovation in Pool & Spa Care
Since our founding in 1963, we have been the leading innovator in our category and have provided our consumers with the most advanced pool and spa care available. As we have scaled, we have leveraged our competitive advantages to strategically reinvest in our business and intellectual property to develop new, value-added capabilities that allow us to meet the needs of any pool and spa owner, whether they care for their pool or spa themselves or rely on a professional, whatever the nature of their need may be, and however they wish to engage with us.
Legacy of Innovation
Over our 57-year history, we have introduced innovative ways to serve pool and spa owners and the professionals who care for their pools and spas.
Owned and Exclusive Brands. Since our inception in 1963, we have offered a portfolio of owned and exclusive brands. We continue to expand our selection of exclusive offerings through innovation, most recently with the launch of the Jacuzzi® and our RightFit® brands in 2016. Our exclusive brands and products account for approximately 55% of total sales and 80% of chemical
3
sales. These proprietary brands and custom-formulated products are only available through our integrated platform and offer professional-grade quality to our consumers, while allowing us to achieve higher gross margins relative to sales of third-party products.
Complimentary and Proprietary Water Testing. We pioneered complimentary in-store water testing, and over the course of our history have conducted millions of tests, which has helped us establish relationships, cultivate loyalty, and drive attractive lifetime value with our consumers as they rely on us for their water treatment needs. We have found that consumers who regularly test their water with us spend more with us per year than other consumers, and we believe that these consumers experience significantly fewer days where their pools are out of commission.
Complimentary In-Store Repair. We provide complimentary in-store equipment repair, which we offer to all consumers with the purchase of Leslie’s replacement parts. Over the last fifteen years, we have conducted more than one million in-store repairs.
In-Field Services. We employ the industry’s largest in-field service network, consisting of more than 200 pool and spa care service professionals who have the expertise to provide essential, on-site equipment installation and repair services for residential and commercial consumers throughout the continental United States.
Loyalty Program. In 2014, we launched the industry’s first loyalty program, which helps track loyalty members’ water treatment history and prescriptions and rewards them for shopping with us. As of October 3, 2020, our loyalty program has more than 3.3 million members, up more than 50% from 2.1 million active members as of September 2018. For the year ended October 3, 2020, our loyalty members generated more than 60% of our direct residential sales. Our loyalty members spend twice as much with us on average compared to our other consumers.
Professional Market. In 2015, we made the strategic decision to resource this channel and accelerate sales growth to professional consumers. Through acquisitions, technology investments, and increased utilization of our integrated network we drove a sales CAGR of over 20% through fiscal year 2020. Our differentiated go-to-market model includes 936 convenient locations, including dedicated Leslie’s PRO locations in certain markets, extended operating hours, expansive product offering through our online platforms, multiple fulfillment capabilities, and the ability to provide pool professionals with referrals to residential consumers. Despite our strong growth, our penetration in the professional market remains modest with an estimated market share of less than 10%.
Leslie’s Evolution in the Digital World
Over the last five years, we have spent more than $70 million investing in new service offerings and digital capabilities that have modernized how consumers take care of their pools and spas.
Digital Network. We have built the largest digital presence in the industry. Our complementary platform of branded proprietary e-commerce websites and marketplace storefronts allows us to seamlessly serve the needs of all digital consumers through curated pricing and targeted merchandising strategies. In addition to our owned e-commerce websites, approximately 40% of our digital sales take place through online marketplaces. In all, our digital network is strategically designed to maximize total profitability. Our digital sales have grown at a CAGR of more than 35% between fiscal year 2015 and fiscal year 2020, and represented 26% of our total sales in fiscal year 2020, up from 8% in fiscal year 2015.
4
Mobile App. In 2018, we introduced a custom-designed mobile app that allows consumers to create a personalized pool profile, sync in-store prescriptions, and monitor the performance of at-home water tests. As of January 2021, the mobile app had more than one half million downloads and an average user rating of 4.6/5.0. We plan to continue enhancing this critical element of our network by introducing new features, including transaction capabilities.
Consumer-Centric Integrated Ecosystem. We architected a consumer-centric integrated ecosystem comprised of our physical network of 936 branded locations and a robust, data-driven digital platform. Over the last two years, we have invested in new capabilities, including global inventory visibility, buy online pick-up in store (“BOPIS”), buy online return in store (“BORIS”), and ship from store (“SFS”), each of which will come online in 2021. With our integrated physical and digital network, we will have the unique advantage of being able to reach all consumers in the continental United States in less than 24 hours, whether they are homeowners, pool and spa professionals, or commercial pool operators, whenever, wherever, and however they prefer to shop.
AccuBlue® Water Testing & Prescription Service. In January 2020, we launched our AccuBlue® in-store water testing device and enhanced water testing experience. AccuBlue®, which features exclusive and proprietary software that incorporates our 57 years of accumulated water treatment expertise, automates and gamifies the water testing experience, driving enhanced accuracy, higher throughput, greater consumer engagement, and increased consumer adherence to prescription recommendations. Locations that have been equipped with AccuBlue® are growing sales at a faster rate than our other locations, supported by an increase in number of water tests performed, an improved conversion rate, and an increase in number of products prescribed per test which has resulted in greater units per transaction. In December 2020, we completed the rollout of AccuBlue® across our physical network.
Highly Experienced and Visionary Management Team. Over the last five years, we have built a diverse, multi-disciplinary management team to drive our consumer-first, digitally enabled growth. Since 2018, four of our eight senior leaders have joined our organization, bringing new expertise and capabilities that are highly complementary and synergistic with our core industry expertise that we have accumulated over decades.
Innovating the Future of Pool and Spa Care
As we look forward, we are committed to better serving our digital-first consumer by introducing an expanded portfolio of connected pool and spa products and services. We believe that we are uniquely positioned to leverage our market-leadership to continue to disrupt the pool and spa care category and further distance ourselves from our competition.
AccuBlue HomeTM Subscription. We are actively developing new technologies that seek to fundamentally change the way all consumers, whether a novice or an expert, care for their pools and spas. Through a new AccuBlue HomeTM subscription offering, we will leverage our proprietary water diagnostics software to convert on-demand test results into actionable prescriptions and treatment plans tailored to the specific size and conditions of a consumer’s pool or spa, which we can seamlessly and automatically fulfill through our integrated network.
Certified Pool Maintenance Offering. We are assembling a strategic network of qualified pool professionals to extend the Leslie’s brand into on-site water maintenance, completing our suite of service offerings in the residential pool ecosystem.
5
Ongoing R&D. We continue to leverage our intellectual property and differentiated strategic position to be the innovator and disruptor in our industry. We plan to strategically reinvest in our business and bring to market new products and services that will continue to improve our ability to serve our consumers and win in the marketplace. In addition to our internal efforts, as the most recognized and trusted authority in the industry with the most direct access and deepest relationships with pool and spa owners, we continue to receive unsolicited opportunities from third parties to introduce to the market and commercialize new products and services on an exclusive basis.
Recent Financial Performance
Our compelling financial profile is characterized by consistent growth, strong profitability, and high cash flow generation.
Comparing the year ended October 3, 2020 to the year ended September 28, 2019, we achieved the following results:
| • | Increase in sales from $928.2 million to $1,112.2 million, representing year-over-year growth of 19.8%; |
| • | Comparable sales growth of 18.0% for the year ended October 3, 2020; |
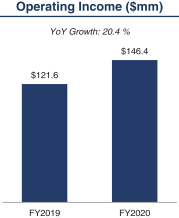
| • | Increase in operating income from $121.6 million to $146.4 million, representing year-over-year growth of 20.4%; and |
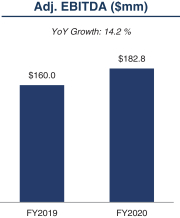
| • | Increase in adjusted EBITDA from $160.0 million to $182.8 million, representing year-over-year growth of 14.2%. |
|
|
|
|
Fiscal year 2020 included a 53rd week. Please see the section titled “Management’s Discussion and Analysis of Financial Condition and Results of Operations” for an explanation of our fiscal calendar.
Our Competitive Strengths
We believe that the following competitive strengths have been key drivers of our success to date, and strategically position us for continued success.
Undisputed direct-to-consumer market leader in the aftermarket pool and spa care industry.
For 57 years, we have been dedicated to addressing our consumers’ pool needs so they can spend less time maintaining and more time enjoying their pools. We are the only direct-to-consumer
6
pool and spa care brand with a nationwide physical presence and an integrated digital platform, consisting of individually merchandised e-commerce websites, a mobile app with transaction capabilities, and online marketplace operations, is designed to address the needs of all pool and spa consumers. The remainder of the industry is highly fragmented across both offline and online providers. We command a market-leading share of nearly 15% of residential aftermarket product spend, which represents an increase of approximately 500 basis points since 2010, our physical network is larger than the sum of the next twenty largest competitors, and our digital sales are estimated to be greater than five times as large as that of our largest digital competitor.
We believe that our history, scale, and consumer-centric approach have contributed to industry-leading consumer affinity metrics. As a result of our consumer-centric approach, we have a Voice of Customer (VoC) score of approximately 75% based on our regular surveys of our consumer file, which demonstrates our consumers’ strong affinity for our brand.
Direct relationships with more than 11 million pool and spa owners and professionals, generating durable, annuity-like economics.
We are the largest national pool and spa care brand that has a direct relationship with pool and spa owners and the professionals who serve them. Across our integrated platform, we have a total file of approximately 11 million consumers. Through our team of highly trained pool and spa experts, we offer sophisticated product recommendations and other expert advice, which cultivates long-standing relationships with our consumers. The comprehensive nature of our product and service offering eliminates the need for consumers to leave the Leslie’s ecosystem, driving exceptional retention with annuity-like economics.
In 2014, we launched our loyalty membership program to further deepen our consumer relationships. The program, which serves more than 3.3 million consumers, allows members to save, earn, and redeem via discounts, points, and rewards. We track consumer preferences, order frequency, and pool profiles in order to curate and enhance our recommendations and promotions, anticipate product demand, and track lifetime value to better incentivize our loyalty members. For the year ended October 3, 2020, our loyalty members generated more than 60% of our direct residential sales. On average, a loyalty member spends twice as much with us per year than a non-loyalty member.
Consumer-centric connected ecosystem for all pool and spa owners and the professionals who serve them using proprietary, leading brands across all channels.
We have built the most extensive and geographically diverse pool and spa care network in the United States, consisting of three formats: Residential, Professional (PRO), and Commercial. Our locations are strategically located in densely populated areas mainly throughout the Sunbelt, including California, Arizona, Texas, and Florida. Across our physical network, we employ a team of associates, including pool and spa care experts and service technicians, who act as solution providers to all of our consumers, including both do-it-yourself (“DIY”) and do-it-for-me (“DIFM”) pool owners as well as pool professionals.
As the world has become more digitally focused, and consumers increasingly demand “smart” home-enabled options, we have focused on architecting the industry-leading integrated digital platform of proprietary e-commerce websites designed to serve our residential, professional, and commercial consumers. Our proprietary e-commerce websites serve digital consumers through curated pricing and targeted merchandising strategies. In addition to our owned e-commerce websites, we offer our products through online marketplaces such as Amazon, eBay, and Walmart. As a result of our strategic
7
investments in digital, we are uniquely positioned to serve our consumers with cross-channel capabilities and capture incremental online demand from new consumers while growing the total profitability of the network.
Comprehensive assortment of proprietary brands with recurring, essential, superior product formulations, and trusted, solution-based services for all consumers.
We offer a comprehensive product assortment, consisting of more than 30,000 products across chemicals, equipment and parts, cleaning and maintenance equipment, and safety, recreational, and fitness-related categories. More than 80% of our product sales are non-discretionary and recurring in nature; these products are critical to the ongoing maintenance of pools and spas. In addition, approximately 55% of our total sales and 80% of our chemical sales are derived from proprietary brands and custom-formulated products, which allows us to create an entrenched consumer relationship, control our supply chain, and capture attractive margins. Consumers choose our exclusive, proprietary brands and custom-formulated products for their efficacy and value, a combination that we believe cannot be found elsewhere.
We pair our comprehensive product assortment with differentiated in-store and on-site service offerings. We pioneered the complimentary in-store water test and resulting pool or spa water prescription, which has driven consumer traffic and loyalty, and has created a “pharmacist-like” relationship with our consumers. Through innovation, we recently introduced significant upgrades to our water testing capabilities with the launch of our AccuBlue® platform. The AccuBlue® testing device screens for nine distinct water quality criteria. Our in-store experts leverage our proprietary AccuBlue® water diagnostics software engine to offer our consumers a customized prescription and treatment plan using our comprehensive range of exclusive products, walking them through product use sequencing step-by-step. These detailed and sophisticated treatment algorithms are supported by our differentiated water treatment expertise built over decades. Historically, we have found that consumers who test their water with us regularly spend more with us per year than those who do not, underscoring the importance of this acquisition and retention vehicle. We also employ the industry’s largest network of in-field technicians who perform on-site evaluations, installation, and repair services for residential and commercial consumers.
Attractive financial profile characterized by consistent, profitable growth, and strong cash flow conversion offering multiple levers to drive shareholder value.
We have delivered 57 consecutive years of sales growth, demonstrating our ability to deliver strong financial results through all economic cycles. Our growth has been broad based across residential pool, residential spa, professional pool, and commercial pool consumers and has been driven by strong retention and profitable acquisition of sticky, long-term consumer relationships. Due to our scale, vertical integration, and operational excellence, we maintain high profitability. Due to our low maintenance capital intensity, we generate strong cash flows. As a result of our attractive financial profile, we have significant flexibility with respect to capital allocation, giving us the ability to drive long-term shareholder value through various operating and financial strategies.
Highly experienced and visionary management team that combines deep industry expertise and advanced, direct-to-consumer capabilities.
Our strategic vision and culture are directed by our executive management team under the leadership of our Chief Executive Officer, Michael R. Egeck and our Executive Vice President and Chief Financial Officer, Steven M. Weddell. Our well-balanced executive management team is
8
comprised of leaders with decades of experience in the pool and spa care industry as well as recently hired executives who bring new expertise and capabilities to Leslie’s from outside industries. Our management team is uniquely capable of executing upon our strategic vision and successfully continuing to create long-term shareholder value.
Our Growth Strategies
Grow our consumer file.
We believe we have significant opportunity to acquire new residential consumers and reactivate lapsed residential consumers, which we plan to do by executing on the following strategies:
| • | Acquire or reactivate consumers via optimized marketing strategy. We believe we have a sizeable opportunity to grow by serving the millions of pool and spa owners in our market who do not actively shop with us today. We plan to accelerate our acquisition of these potential new or reactivated consumers and, at the same time, reduce consumer acquisition cost by shifting our marketing mix toward more efficient digital and social channels. |
| • | Capture outsized share of new pool and spa consumers. We have observed considerable recent acceleration in new pool and hot tub installations, bringing new consumers to our market. We intend to bolster consumer file growth by deploying targeted marketing tactics to win outsized share of this new consumer cohort. |
Increase share of wallet among existing consumers.
We currently serve a file of approximately 5.5 million active consumers, which represents approximately one-third of the estimated total addressable market of pool and spa owners. We define “active consumers” as consumers who transacted with us during the 18-month period ended October 3, 2020 and “lapsed residential consumers” as those who have shopped with us in the past, but have not transacted with us in the last 18 months. We believe we have a significant opportunity to increase spend from existing consumers and drive higher lifetime value. We plan to do this by executing on the following strategies:
| • | Increase loyalty membership penetration and introduce program upgrades. We plan to continue to market our loyalty program in-store and online to convert more of our consumers to loyalty members. In addition, we are in the process of enhancing our loyalty program to offer more value-added features and further drive member engagement. We will explore opportunities to drive interest by selectively offering special incentives and rewards as well as introducing new value-added features. We believe these initiatives will drive higher transaction frequency and basket size, which will result in increased category spend and higher lifetime value with existing consumers. |
| • | Enhance retention marketing. While we have historically been satisfied with our consumer retention metrics, we believe there is opportunity to drive even greater retention. We plan to do this by more actively leveraging our consumer database to personalize the consumer experience with targeted messaging and product recommendations. |
| • | Expand our product and service offering. We plan to expand our offering by introducing new and innovative products and services in our existing categories and by expanding into adjacent categories. Specifically, we believe there is an opportunity with products targeted to spa owners, who have historically been underserved. |
9
Grow additional share in the professional market.
We believe we have a significant opportunity to grow our sales with pool care professionals, who individually spend more than 25x as much as residential consumers on pool supplies and equipment.
Our research suggests that small and mid-size pool professionals value convenience and referrals, both of which we are uniquely positioned to offer given our 900+ locations and industry’s largest consumer file. We plan to expand our physical network of PRO locations, which specifically cater to pool professionals, by opening new locations and selectively remodeling existing residential locations. We believe there is significant whitespace opportunity to operate more than 200 total PRO locations across the United States. We also plan to assemble an affiliated network of qualified pool professionals to extend the Leslie’s name into water maintenance. We believe that this initiative represents a natural adjacency and will resonate with existing residential consumers as well as help attract new residential consumers.
Utilize strategic M&A to consolidate share and further enhance capabilities.
The aftermarket pool and spa industry remains highly fragmented, which offers attractive opportunities to utilize strategic M&A to drive consolidation. We have historically used, and plan to continue to use, strategic acquisitions to obtain consumers and capabilities in both new and existing markets. We believe that we are the consolidator of choice in the industry, and we will continue to focus on acquiring high quality, market-leading businesses with teams, capabilities, and technologies that uniquely position us to create value by applying best practices across our entire physical and digital network to better serve new and existing consumer types.
Addressing underserved residential whitespace.
We have identified more than 700 underserved residential pool and spa care markets in the continental United States. With our omni-channel capabilities, successful track record of new location openings, and targeted digital marketing tactics, we believe we are well positioned to capitalize on this meaningful whitespace opportunity. We plan to assess each market independently and determine the most capital efficient way to serve these trade areas using a mix of digital assets and physical locations.
Continue to introduce disruptive innovation.
Leslie’s has a legacy of disruptive innovation in the pool and spa care industry. We plan to continue that legacy by continuously developing and introducing capabilities that create value for our consumers. Present areas of focus include water testing, maintenance prescriptions, new product offerings, and our product distribution ecosystem.
As the Internet of Things wave continues, we believe consumers will seek the convenience of “smart” home functionality in more facets of their daily lives. We believe this presents an opportunity to introduce a full service, connected home solution that effectively automates pool maintenance, including actively monitoring our customer’s water, diagnosing, developing, and prescribing a treatment plan, and delivering to our customer’s home the assortment of products needed to maintain a clear, safe, beautiful pool.
10
Summary of Risk Factors
Our business is subject to numerous risks described in the section entitled “Risk Factors” and elsewhere in this prospectus. You should carefully consider these risks before making an investment. Some of these risks include:
Risks Related to the Nature of Our Business:
| • | If we are unable to achieve comparable sales growth, our profitability and performance could be materially adversely impacted. |
| • | Past growth may not be indicative of future growth. |
| • | Loss of key members of management could adversely affect our business. |
| • | We are subject to legal or other proceedings that could have a material adverse effect on us. |
| • | Disruptions from disasters and similar events could have a material adverse effect on our business. |
Risks Related to Our Industry and the Broader Economy
| • | We face competition by manufacturers, retailers, distributors, and service providers in the residential, professional, and commercial pool and spa care market. |
| • | The demand for our swimming pool and spa related products and services may be adversely affected by unfavorable economic conditions. |
| • | The outbreak of COVID-19 could adversely impact our business and results of operations. |
| • | The demand for pool chemicals may be affected by consumer attitudes towards products for environmental or safety reasons. |
| • | Our results of operations may fluctuate from quarter to quarter for many reasons, including seasonality. |
| • | We are susceptible to adverse weather conditions. |
Technology and Privacy Related Risks
| • | If our online systems do not function effectively, our operating results could be adversely affected. |
| • | Any limitation or restriction to sell on online platforms could harm our profitability. |
| • | A significant disturbance or breach of our technological infrastructure could adversely affect our financial condition and results of operations. |
| • | Improper activities by third parties and other events or developments may result in future intrusions into or compromise of our networks, payment card terminals or other payment systems. |
Risks Related to Our Business Strategy
| • | We may acquire other companies or technologies, which could fail to result in a commercial product and otherwise disrupt our business. |
| • | Our operating results will be harmed if we are unable to effectively manage and sustain our future growth or scale our operations. |
11
Risks Related to the Manufacturing, Processing, and Supply of Our Products
| • | Our business includes the packaging and storage of chemicals and an accident related to these chemicals could subject us to liability and increased costs. |
| • | Product supply disruptions may have an adverse effect on our profitability and operating results. |
| • | The cost of raw materials could increase our cost of goods sold and cause our results of operations and financial condition to suffer. |
Risks Related to Commercialization of Our Products
| • | The commercial success of our planned or future products is not guaranteed. |
| • | We may implement a product recall or voluntary market withdrawal, which could significantly increase our costs, damage our reputation, and disrupt our business. |
| • | If we do not manage product inventory effectively and efficiently, it could adversely affect profitability. |
| • | If we do not continue to obtain favorable purchase terms with manufacturers, it could adversely affect our operating results. |
Risks Related to Government Regulation
| • | The nature of our business subjects us to compliance with employment, environmental, health, transportation, safety, and other governmental regulations. |
| • | Product quality, warranty claims or safety concerns could impact our sales and expose us to litigation. |
Risks Related to Intellectual Property Matters
| • | If we are unable to adequately protect our intellectual property rights, our competitive position could be harmed or we could be required to incur significant expenses to enforce or defend our rights. |
| • | If we infringe on or misappropriate the proprietary rights of others, we may be liable for damages. |
Risks Related to Our Indebtedness
| • | Our substantial indebtedness could materially adversely affect our financial condition and our ability to operate our business. |
| • | Our ability to generate sufficient cash depends on numerous factors beyond our control, and we may be unable to generate sufficient cash flow to service our debt obligations. |
| • | Restrictive covenants in the agreements governing our Credit Facilities may restrict our ability to pursue our business strategies, and failure to comply with these restrictions could result in acceleration of our debt. |
| • | Incurrence of substantially more debt could further exacerbate the risks associated with our substantial leverage. |
| • | The phaseout of the London Interbank Offered Rate (LIBOR), or the replacement of LIBOR with a different reference rate, may adversely affect interest rate. |
12
Risks Related to Ownership of Our Common Stock
| • | Our stock price may be volatile, resulting in substantial losses for investors. |
| • | Future sales of shares by existing stockholders could cause our stock price to decline. |
| • | Stockholders’ ability to influence corporate matters may be limited because a small number of stockholders beneficially own a substantial amount of our common stock and continue to have substantial control over us. |
| • | Transactions engaged in by our principal stockholders, our officers or directors involving our common stock may have an adverse effect on the price of our stock. |
| • | We do not intend to pay dividends for the foreseeable future. |
| • | Anti-takeover provisions in our charter and under Delaware law could limit certain stockholder actions. |
| • | Certain provisions of our fifth amended and restated certificate of incorporation may have the effect of discouraging lawsuits against our directors and officers. |
| • | We will continue to incur increased costs as a result of being a public company. |
| • | If we are unable to effectively implement or maintain a system of internal control over financial reporting, we may not be able to accurately or timely report our financial results. |
| • | We were previously a “controlled company” within the meaning of the corporate governance standards of Nasdaq, and, as a result, you may not have the same protections afforded to stockholders of other companies during the transition period afforded to us by the rules of Nasdaq. |
Our Corporate Information
We were incorporated as a Delaware corporation on February 6, 2007.
Our principal executive offices are located at 2005 East Indian School Road, Phoenix, Arizona 85016 and our telephone number is (602) 366-3999. We maintain a website at the address www.lesliespool.com. Information contained on, or accessible through, our website is not a part of this prospectus or the registration statement of which this prospectus forms a part, and you should not rely on that information when making a decision to invest in our common stock.
13
| Issuer |
Leslie’s, Inc. | |
| Common stock offered by the selling stockholders |
shares (or shares if the underwriters exercise in full their option to purchase additional shares). | |
| Option to purchase additional shares |
The selling stockholders have granted the underwriters a 30-day option to purchase up to additional shares of our common stock from the selling stockholders at the public offering price. | |
| Common stock to be outstanding immediately after the offering |
186,873,341 shares. | |
| Use of proceeds |
The selling stockholders will receive all net proceeds from the sale of the shares of common stock to be sold in this offering, and we will not receive any of these proceeds. See the sections entitled “Use of Proceeds,” “Principal and Selling Stockholders” and “Underwriting.” | |
| Nasdaq Trading Symbol |
“LESL” | |
Unless otherwise indicated, this prospectus reflects and assumes the following:
| • | no vesting of the restricted stock units described below; and |
| • | no exercise by the underwriters of their option to purchase additional shares of common stock. |
The number of shares of our common stock to be outstanding after this offering is based on 186,873,341 shares of common stock outstanding as of January 31, 2021, and excludes:
| • | 8,146,795 shares of common stock reserved for future issuance under our 2020 Omnibus Incentive Plan; |
| • | 5,690,649 shares of common stock issuable upon the settlement of restricted stock units outstanding as of January 31, 2021; and |
| • | 4,589,412 shares of common stock issuable upon the exercise of stock options outstanding as of January 31, 2021 under our 2020 Omnibus Incentive Plan, at a weighted average exercise price of $17.03 per share. |
14
SUMMARY HISTORICAL CONSOLIDATED FINANCIAL AND OTHER INFORMATION
The following table sets forth our summary consolidated statements of operations data and our consolidated balance sheet data for the years ended October 3, 2020, September 28, 2019 and September 29, 2018. We have derived the following consolidated statements of operations data and the balance sheet data for the years ended October 3, 2020, September 28, 2019 and September 29, 2018 from our audited consolidated financial statements included elsewhere in this prospectus. Our historical results are not necessarily indicative of the results that may be expected for any future period. The following summary consolidated financial data should be read with the sections titled “Selected Historical Consolidated Financial and Other Information” and “Management’s Discussion and Analysis of Financial Condition and Results of Operations” and our consolidated financial statements and the related notes included elsewhere in this prospectus.
| (dollars in thousands) Fiscal Year Ended |
||||||||||||
| October 3, 2020(1) |
September 28, 2019 |
September 29, 2018 |
||||||||||
| Statement of operations data: |
||||||||||||
| Sales |
$ | 1,112,229 | $ | 928,203 | $ | 892,600 | ||||||
| Cost of merchandise and services sold |
651,516 | 548,463 | 535,464 | |||||||||
|
|
|
|
|
|
|
|||||||
| Gross profit |
460,713 | 379,740 | 357,136 | |||||||||
|
|
|
|
|
|
|
|||||||
| Selling, general and administrative expenses |
314,338 | 258,152 | 241,669 | |||||||||
|
|
|
|
|
|
|
|||||||
| Operating income |
146,375 | 121,588 | 115,467 | |||||||||
|
|
|
|
|
|
|
|||||||
| Other expense: |
||||||||||||
| Interest expense |
84,098 | 98,578 | 91,656 | |||||||||
| Other expenses, net |
1,089 | 7,453 | 1,759 | |||||||||
|
|
|
|
|
|
|
|||||||
| Total other expense |
85,187 | 106,031 | 93,415 | |||||||||
| Income before taxes |
61,188 | 15,557 | 22,052 | |||||||||
| Income tax expense |
2,627 | 14,855 | 4,926 | |||||||||
|
|
|
|
|
|
|
|||||||
| Net income |
$ | 58,561 | $ | 702 | $ | 17,126 | ||||||
|
|
|
|
|
|
|
|||||||
| Balance sheet data: |
||||||||||||
| Cash and cash equivalents |
$ | 157,072 | $ | 90,899 | $ | 77,569 | ||||||
| Total current assets |
372,133 | 282,089 | 255,332 | |||||||||
| Total assets |
746,438 | 479,721 | 453,160 | |||||||||
| Total current liabilities |
258,196 | 165,522 | 137,165 | |||||||||
| Total liabilities |
1,573,437 | 1,367,078 | 1,342,109 | |||||||||
| Total stockholders’ deficit |
(826,999 | ) | (887,357 | ) | (888,949 | ) | ||||||
| Cash flow data: |
||||||||||||
| Net cash provided by operating activities |
$ | 103,409 | $ | 57,821 | $ | 43,280 | ||||||
| Net cash used in investing activities |
(26,811 | ) | (36,996 | ) | (40,219 | ) | ||||||
| Net cash used in financing activities |
(10,425 | ) | (7,495 | ) | (24,386 | ) | ||||||
| Other financial and operations data: |
||||||||||||
| Number of new and acquired locations |
10 | 28 | 38 | |||||||||
| Number of locations open at end of period |
936 | 952 | 940 | |||||||||
| Comparable sales growth(2) |
18.0 | % | 0.4 | % | (1.3 | )% | ||||||
| Adjusted EBITDA(3) |
$ | 182,770 | $ | 160,003 | $ | 151,799 | ||||||
| Adjusted EBITDA as a percentage of sales(3) |
16.4 | % | 17.2 | % | 17.0 | % | ||||||
| Adjusted net income(3) |
$ | 64,973 | $ | 12,765 | $ | 22,927 | ||||||
| Adjusted net income per share |
0.42 | 0.08 | 0.15 | |||||||||
15
| (1) | Consisted of 53 weeks. Please see the section titled “Management’s Discussion and Analysis of Financial Condition and Results of Operations” for an explanation of our fiscal calendar. |
| (2) | Please see the section titled “Management’s Discussion and Analysis of Financial Condition and Results of Operations—Key Factors and Measures We Use to Evaluate Our Business.” |
| (3) | Please see the section titled “Management’s Discussion and Analysis of Financial Condition and Results of Operations” for a reconciliation from our net income to adjusted EBITDA and net income to adjusted net income. |
16
Investing in our common stock involves a high degree of risk. You should consider and read carefully all of the risks and uncertainties described below as well as other information included in this prospectus, including our consolidated financial statements and related notes appearing at the end of this prospectus, before making an investment decision. The risks described below are not the only ones facing us. The occurrence of any of the following risks or additional risks and uncertainties not presently known to us or that we currently believe to be immaterial could materially and adversely affect our business, financial condition or results of operations. In such case, the trading price of our common stock could decline, and you may lose all or part of your original investment. This prospectus also contains forward-looking statements and estimates that involve risks and uncertainties. Our actual results could differ materially from those anticipated in the forward-looking statements as a result of specific factors, including the risks and uncertainties described below.
Additionally, the COVID-19 pandemic may amplify many of the risks discussed below to which we are subject and, given the unpredictable, unprecedented and fluid nature of the pandemic, it may materially and adversely affect us in ways that are not anticipated by or known to us or that we do not consider to present significant risk. Therefore, we are unable to estimate the extent to which the pandemic and its related impacts will adversely affect our business, financial condition and results of operations as well as our stock price following completion of this offering.
Risks Related to the Nature of Our Business
Our success depends on our ability to maintain or increase comparable sales, and if we are unable to achieve comparable sales growth, our profitability and performance could be materially adversely impacted.
Our success depends on increasing comparable sales through our merchandising strategy and ability to increase sales and profits. To increase sales and profits, and therefore comparable sales growth, we focus on delivering value and generating consumer excitement by staffing our locations with pool and spa experts, developing compelling products, optimizing inventory management, maintaining strong location conditions, and effectively marketing current products and new product offerings. If these efforts become less successful, we may not be able to maintain or improve the levels of comparable sales that we have experienced in the past, which could adversely impact our profitability and overall business results. In addition, competition and pricing pressures from competitors may also materially adversely impact our operating margins. Our comparable sales growth could be lower than our historical average or our future target for many reasons, including general economic conditions, operational performance, price inflation or deflation, industry competition, new competitive entrants near our locations, price changes in response to competitive factors, the impact of new locations entering the comparable base, cycling against any year or quarter of above-average sales results, unfavorable weather conditions, supply shortages or other operational disruptions, the number and dollar amount of consumer transactions in our locations, our ability to provide product or service offerings that generate new and repeat visits to our locations, and the level of consumer engagement that we provide in our locations. Opening new locations in our established markets may result in inadvertent oversaturation, temporary or permanent diversion of consumers and sales from our existing locations to new locations and reduced comparable sales, thus adversely affecting our overall financial performance. These factors may cause our comparable sales results to be materially lower than in recent periods, which could harm our profitability and business.
Past growth may not be indicative of future growth.
Historically, we have experienced substantial sales growth through organic market share gains, new location openings and acquisitions that have increased our size, scope, and geographic footprint.
17
Our various business strategies and initiatives, including our growth initiatives, are subject to business, economic and competitive uncertainties and contingencies, many of which are beyond our control. While we contemplate continued growth through internal expansion and acquisitions, we may not be able to:
| • | acquire new consumers, retain existing consumers, and grow our share of the market; |
| • | penetrate new markets; |
| • | provide a relevant omni-channel experience to rapidly evolving consumer expectations through our proprietary mobile app and e-commerce websites; |
| • | generate sufficient cash flows or obtain sufficient financing to support expansion plans and general operating activities; |
| • | identify suitable acquisition candidates and successfully integrate acquired businesses; |
| • | maintain favorable supplier arrangements and relationships; and |
| • | identify and divest assets that do not continue to create value consistent with our objectives. |
If we do not manage these potential difficulties successfully, our operating results could be adversely affected.
We may not be able to successfully manage our inventory to match consumer demand, which could have a material adverse effect on our business, financial condition, and results of operations.
We base our inventory purchases, in part, on our sales forecasts. If our sales forecasts overestimate consumer demand, we may experience higher inventory levels, which could result in the need to sell products at lower than anticipated prices, leading to decreased profit margins. Conversely, if our sales forecasts underestimate consumer demand, we may have insufficient inventory to meet demand, leading to lost sales, either of which could materially adversely affect our financial performance.
Loss of key members of management or failure to attract, develop, and retain highly qualified personnel could adversely affect our business.
Our future success depends on the continued efforts of the members of our executive management team. If one or more of our executives or other key personnel are unable or unwilling to continue in their present positions, or if we are unable to attract and retain high-quality executives or key personnel in the future, our business may be adversely affected.
We consider our employees to be the foundation for our growth and success. As such, our future success depends in large part on our ability to attract, train, retain, and motivate qualified personnel. During the height of our seasonal activities, we have additional employees, including seasonal and part-time employees who generally are not employed during the off-season. If we are unable to attract and hire additional personnel during these seasons, our operating results could be adversely affected.
We are subject to, and may in the future be subject to, legal or other proceedings that could have a material adverse effect on us.
From time to time, we are a party to legal proceedings, including matters involving personnel and employment issues, personal injury, antitrust claims, intellectual property claims, and other proceedings arising in or outside of the ordinary course of business. In addition, there are an
18
increasing number of cases being filed against companies generally, including class-action allegations under federal and state wage and hour laws. We could be exposed to legal proceedings arising out of the COVID-19 pandemic, including wrongful death actions brought on behalf of employees who contracted COVID-19 while performing their employment-related duties. We estimate our exposure to these legal proceedings and establish reserves for the probable and reasonably estimated liabilities. Assessing and predicting the outcome of these matters involves substantial uncertainties. Although not currently anticipated by management, unexpected outcomes in these legal proceedings or changes in management’s forecast assumptions or predictions could have a material adverse impact on our results of operations.
Disruptions from natural or man-made disasters or extreme weather, public safety issues, geopolitical events and security issues, labor or trade disputes, and similar events could have a material adverse effect on our business.
Natural or man-made disasters or extreme weather (including as a result of climate change), public safety issues, geopolitical events and security issues (including terrorist attacks and armed hostilities), labor or trade disputes, and similar events can lead to uncertainty and have a negative impact on demand for our products, in addition to causing disruptions to our supply chain. Discretionary spending on chemicals, equipment and parts, cleaning and maintenance equipment, and safety, recreational, and fitness-related products, such as ours, is generally adversely affected during times of economic, social, or political uncertainty. The potential for natural or man-made disasters or extreme weather, geopolitical events and security issues, labor or trade disputes, and similar events could create these types of uncertainties and negatively impact our business for the short- or long-term in ways that cannot presently be predicted.
Risks Related to Our Industry and the Broader Economy
We face competition by manufacturers, retailers, distributors, and service providers in the residential, professional, and commercial pool and spa care market.
Within our industry, competition is highly fragmented. We compete against a wide range of manufacturers, retailers, distributors, and service providers in the residential, professional, and commercial pool and spa care market. This includes original equipment manufacturers, regional and local retailers, home improvement retailers, mass-market retailers, and specialty e-commerce operators.
Most of our competition comes from regional and local independent retailers. National home improvement and retailers, such as Home Depot, Lowe’s, and local and regional hardware stores, compete with us mainly on a seasonal basis during the spring and summer months, but experience significantly higher foot traffic than our retail locations. We also face competition from mass-market retail competitors, such as Amazon, Walmart, and Costco, who devote shelf space to merchandise and products targeted to our consumers. Historically, mass-market retailers have generally expanded by adding new stores and product breadth, but their product offering of pool-related products has remained relatively constant. If pool and spa owners are attracted by the convenience afforded by any of our competitors, they may be less inclined to purchase products and/or services from us.
In addition, new competitors may emerge as there are no proprietary technologies or other significant barriers to prevent other firms from entering the swimming pool and spa supply retail market in the future. Should store and internet-based mass-market retailers increase their focus on the pool and spa industry, or increase the breadth of their pool, spa, and related product offerings, they may become a more significant competitor for our industry, which could have an adverse impact on our business. We may face additional competitive pressures if large pool supply retailers look to expand
19
their consumer base. Given the density and demand for pool and spa products, some geographic markets that we serve also tend to have a higher concentration of competitors than others, particularly Arizona, California, Florida, and Texas. These states encompass our largest markets and entry of significant new competitors into them could have a substantial impact on our total sales.
The demand for our swimming pool and spa related products and services may be adversely affected by unfavorable economic conditions.
Consumer discretionary spending affects our sales and is impacted by factors outside of our control, including general economic conditions, the residential housing market, unemployment rates and wage levels, interest rate fluctuations, inflation, disposable income levels, consumer confidence, and access to credit. In economic downturns, the demand for swimming pool and spa related products and services may decline, often corresponding with declines in discretionary consumer spending, the growth rate of pool-eligible households, and swimming pool construction. A weak economy may also cause consumers to defer discretionary replacement and refurbishment activity. Even in generally favorable economic conditions, severe and/or prolonged downturns in the housing market could have a material adverse impact on our financial performance. Similarly, slow growth in the number of pool-eligible households can have a lasting negative impact by limiting the potential for future growth of the pool and spa maintenance market.
We believe that homeowners’ access to consumer credit is a critical factor enabling the purchase of new pools, spas and related products. Unfavorable economic conditions and downturn in the housing market can result in significant tightening of credit markets, which limit the ability of consumers to access financing for new swimming pools, spas, and related supplies, and consequently, replacement, repair and maintenance of equipment. Tightening consumer credit could prevent consumers from obtaining financing for pool and spa projects, which could negatively impact our sales of products and services.
The outbreak of COVID-19 and associated responses could adversely impact our business and results of operations.
The COVID-19 pandemic has significantly impacted economic activity and markets throughout the world. In response, governmental authorities have imposed, and others in the future may impose, stay-at-home orders, shelter-in-place orders, quarantines, executive orders, and similar government orders and restrictions to control the spread of COVID-19. Such orders or restrictions have resulted in temporary location closures, limitation of location hours, limitations on the number of people in locations or in warehouses, enhanced requirements on sanitation, social distancing practices, and travel restrictions, among other effects. We currently operate as an essential business under the relevant state and local regulations and if this changes, it will adversely impact our financial condition and operating results. Recently, there have been reports of increasing numbers of new COVID-19 cases in certain of our markets, resulting in some governments extending or re-imposing restrictions. Accordingly, COVID-19 may have negative impacts on our business in the future, and any future adverse impacts on our business may be worse than we anticipate. The ultimate impact will depend on the severity and duration of the current COVID-19 pandemic and future resurgences and actions taken by governmental authorities and other third parties in response, each of which is uncertain, rapidly changing, and difficult to predict. Our recent growth rates amid the COVID-19 pandemic may not be sustainable and may not be indicative of future growth.
The demand for pool chemicals may be affected by consumer attitudes towards products for environmental or safety reasons.
We could be adversely affected if consumers lose confidence in the safety and quality of our products. The demand for the pool chemicals sold by us may also be affected by changes in consumer
20
attitudes toward pool chemical products for environmental or safety reasons. To the extent more environmentally-friendly alternative pool and spa water treatment methods emerge, we may not be successful in adopting them in a timely manner.
Our results of operations may fluctuate from quarter to quarter for many reasons, including seasonality.
Our sales are highly seasonal and we experience fluctuations in quarterly results as a result of many factors. We have historically generated a greater percentage of our revenues during the warm weather months of April through September. Timing of consumer purchases will vary each year and sales can be expected to shift from one quarter to another. As a result, management believes that period-to-period comparisons of results of operations are not necessarily meaningful and should not be relied upon as any indication of future performance or results expected for the fiscal year. In addition, because our revenues are concentrated to a limited number of months, our business is more susceptible to adverse events occurring in those months than other businesses that have consistent levels of revenue throughout the year.
We are susceptible to adverse weather conditions.
Given the nature of our business, weather is one of the principal external factors affecting our business. Unseasonably cool weather or significant amounts of rainfall during the peak sales season can reduce chemical consumption in pools and spas and decrease consumer purchases of our products and services. In addition, unseasonably early or late warming trends can increase or decrease the length of the pool season and impact timing around pool openings and closings and, therefore, our total sales and timing of our sales. While warmer weather conditions favorably impact our sales, global warming trends and other significant climate changes can create more variability in the short-term or lead to other unfavorable weather conditions that could adversely impact our sales or operations. Drought conditions or water management initiatives may lead to municipal ordinances related to water use restrictions. Such restrictions could result in decreased pool installations, which could negatively impact our sales.
Certain extreme weather events, such as hurricanes and tropical storms, may impact demand for our products and services, our ability to deliver our products, provide services, continue to keep our facilities open and operational, or cause damage to our facilities. As a consequence of these or other catastrophic or uncharacteristic events, we may experience interruption to our operations, increased costs or loss of property, equipment or inventory, which would adversely affect our revenue and profitability.
Technology and Privacy Related Risks
If the technology-based systems that give our consumers the ability to shop with us online do not function effectively, our operating results, as well as our ability to grow our e-commerce business globally, could be materially adversely affected.
Many of our consumers shop with us through our physical network and digital platform, which includes our proprietary mobile app and e-commerce websites. Increasingly, consumers are using tablets and smart phones to shop online with us and with our competitors and to do comparison shopping. We are increasingly using social media and our proprietary mobile app to interact with our consumers and as a means to enhance their shopping experience. Any failure on our part to provide an attractive, effective, reliable, and user-friendly digital platform that offers a wide assortment of merchandise with rapid delivery options and that continually meets the changing expectations of online shoppers could place us at a competitive disadvantage, result in the loss of e-commerce and other
21
sales, harm our reputation with consumers, have a material adverse impact on the growth of our e-commerce business globally, and could have a material adverse impact on our business and results of operations.
Our e-commerce operation faces distinct risks, such as the failure to make and implement changes to our e-commerce websites and mobile app, the failure to maintain a relevant consumer experience in understanding and interacting with our e-commerce websites and mobile app, telecommunications disruptions, reliance on third-party software technologies, and rapid changes in technology, among others. If not managed, these risks could adversely impact our operating results.
A significant portion of our digital sales take place through online marketplaces and online retailers and any limitation or restriction, temporarily or otherwise, to sell on these online platforms could harm our profitability and results of operation.
To complement our platform of branded proprietary e-commerce websites and marketplace storefronts, approximately 40% of our digital sales take place through online marketplaces and online retailers and are subject to their terms of service and their various other policies. While we endeavor to materially comply with the terms of service and other policies of each online marketplace and online retailer through which we sell our products, these online marketplaces or online retailers may not have the same determination with respect to our compliance. These online marketplaces and online retailers may, in certain circumstances, refuse to continue hosting us or selling our products or temporarily suspend or discontinue our access to their online platform and any limitation or restriction (whether temporary or otherwise) on our ability to sell our products through these online platforms could harm our profitability and results of operations.
We rely on information technology systems to support our business operations. A significant disturbance or breach of our technological infrastructure could adversely affect our financial condition and results of operations. Additionally, failure to maintain the security of confidential information could damage our reputation and expose us to litigation.
Information technology supports several aspects of our business, including, among others, product sourcing, pricing, consumer service, transaction processing, financial reporting, collections, and cost management. Our ability to operate effectively on a day-to-day basis and accurately report our results depends on a solid technological infrastructure, which is inherently susceptible to internal and external threats. We are vulnerable to interruption by fire, natural disaster, power loss, telecommunication failures, internet failures, security breaches, catastrophic events, and other significant disruptions. Exposure to various types of cyberattacks such as malware, computer viruses, worms, or other malicious acts, as well as human error and technological malfunction, could also potentially disrupt our operations or result in a significant interruption in the delivery of our goods and services.
Advances in computer and software capabilities, encryption technology, and other discoveries increase the complexity of our technological environment, including how we and our customers each interact with our various software platforms. Such advances could delay or hinder our ability to process transactions or could compromise the integrity of our data, resulting in a material adverse impact on our financial condition and results of operations. We also may experience occasional system interruptions and delays, as a result of routine maintenance, periodic updates, or other factors, that make our information systems unavailable or slow to respond, including the interaction of our information systems with those of third parties. A lack of sophistication or reliability of our information systems could adversely impact our operations and consumer service and could require major repairs or replacements, resulting in significant costs and foregone revenue.
22
Our numerous procedures and protocols designed to mitigate cybersecurity risks (including processes to timely notify appropriate personnel for assessment and resolution and company-wide training programs), our investments in information technology security and our updates to our business continuity plan may not prevent or effectively mitigate adverse consequences from cybersecurity risks. Any failure by us to maintain or protect our information technology systems and data integrity, including from cyberattacks, intrusions or other breaches, could result in the unauthorized access to consumer data, credit card information, and personally identifiable information, theft of intellectual property or other misappropriation of assets, or otherwise compromise our confidential or proprietary information and disrupt our operations, putting us at a competitive disadvantage. Such a breach could result in damage to our reputation and subject us to potential litigation, liability, fines, and penalties, resulting in a possible material adverse impact on our financial condition and results of operations.
Improper activities by third parties, exploitation of encryption technology, new data-hacking tools and discoveries, and other events or developments may result in future intrusions into or compromise of our networks, payment card terminals or other payment systems.
We may not be able to anticipate the frequently changing techniques used to obtain unauthorized access to sensitive data or implement adequate preventive measures for all of them. Any unauthorized access into our consumers’ sensitive information, or data belonging to us or our suppliers, even if we are compliant with industry security standards, could put us at a competitive disadvantage, result in deterioration of our consumers’ confidence in us, and subject us to potential litigation, liability, fines, penalties, and consent decrees, resulting in a possible material adverse impact on our financial condition and results of operations.
As a merchant that accepts debit and credit cards for payment, we are subject to the Payment Card Industry Data Security Standard (“PCI DSS”) issued by the PCI Council and to the American National Standards Institute (“ANSI”) data encryption standards and payment network security operating guidelines, as well as the Fair and Accurate Credit Transactions Act (“FACTA”). Failure to comply with these guidelines or standard may result in the imposition of financial penalties or the allocation by the card brands of the costs of fraudulent charges to us. Despite our efforts to comply with these or other payment card standards and other information security measures, we cannot be certain that all of our IT systems will be able to prevent, contain, or detect all cyberattacks or intrusions from known malware or malware that may be developed in the future. To the extent that any disruption results in the loss, damage, or misappropriation of information, we may be adversely affected by claims from consumers, financial institutions, regulatory authorities, payment card associations, and others. In addition, privacy and information security laws and standards continue to evolve and could expose us to further regulatory burdens. The cost of complying with stricter laws and standards, including PCI DSS, ANSI, and FACTA data encryption standards and the California Consumer Privacy Act, which took effect in January 2020, could be significant.
Risks Related to Our Business Strategy
We may acquire other companies or technologies, which could fail to result in a commercial product or sales, divert our management’s attention, result in additional dilution to our stockholders, and otherwise disrupt our business.
We may in the future seek to acquire or invest in businesses or technologies that we believe could complement or expand our portfolio, enhance our technical capabilities, or otherwise offer growth opportunities. We may not be able to successfully complete any acquisition we choose to pursue and we may not be able to successfully integrate any acquired business, product or technology in a cost-effective and non-disruptive manner. The pursuit of potential acquisitions may divert the attention of management and cause us to incur various costs and expenses in identifying, investigating, and
23
pursuing suitable acquisitions, whether or not they are consummated. We may not be able to identify desirable acquisition targets or be successful in entering into an agreement with any particular target or obtain the expected benefits of any acquisition or investment. Similarly, we may not be able to successfully identify and acquire new technologies in a timely manner or at all. Acquisitions could also result in dilutive issuances of equity securities, the use of our available cash, or the incurrence of debt, which could harm our operating results. In addition, if an acquired business fails to meet our expectations, our business, financial condition, and results of operations may be negatively affected.
Our operating results will be harmed if we are unable to effectively manage and sustain our future growth or scale our operations.
We may not be able to manage our growth or future growth efficiently or profitably. Our revenue and operating margins, or revenue and margin growth, may be less than expected. If we are unable to scale our operations efficiently or maintain pricing without significant discounting, we may fail to achieve expected operating margins, which would have a material and adverse effect on our operating results. Growth may also stress our ability to adequately manage our operations, quality of products, safety, and regulatory compliance. If growth significantly decreases, it will negatively impact our cash reserves, and it may be necessary to obtain additional financing, which may increase indebtedness or result in dilution to shareholders. Further, we may not be able to obtain additional financing on acceptable terms, if at all.
Risks Related to the Manufacturing, Processing, and Supply of Our Products
Our business includes the packaging and storage of chemicals and an accident related to these chemicals could subject us to liability and increased costs.
We operate chemical repackaging facilities and we store chemicals in our locations and in our distribution facilities. Because some of the chemicals we repackage and store are hazardous materials, we must comply with various fire and safety ordinances. However, a release at a location or a fire at one of our facilities could give rise to liability claims against us and potential environmental liability. In addition, if an incident involves a repackaging or distribution facility, we might be required temporarily to use alternate sources of supply that could increase our cost of sales.
We cannot guarantee that our insurance coverage will be adequate to cover future claims that may arise or that we will be able to maintain adequate insurance in the future at rates we consider reasonable. Successful claims for which we are not fully insured may adversely affect our working capital and profitability. In addition, changes in the insurance industry have generally led to higher insurance costs and decreased availability of coverage.
We cannot guarantee that our internal training curriculum and compliance programs will cause our employees to follow the applicable operating procedures and regulations, or that no accidents or incidents will arise that could expose us to liability and have a negative impact on our operations and results.
Product supply disruptions may have an adverse effect on our profitability and operating results.
We rely on various suppliers and vendors to provide and deliver product inventory on a continuous basis, some of which are located outside of the United States. These suppliers (and those they depend upon for materials and services) are subject to risks, including from natural or man-made disasters or extreme weather (including as a result of climate change), public safety issues, geopolitical events and security issues (including terrorist attacks and armed hostilities), power outages, labor or
24
trade disputes, union organizing activities, financial liquidity problems, and similar events, as well as supply constraints and general economic, social, and political conditions that can limit their ability to provide us (or our suppliers) with quality products and services in a timely manner. The occurrence of these or other unexpected events can cause us to suffer significant product inventory losses and significant lost revenue. For example, due to the COVID-19 pandemic and the resulting dislocation of workplaces and the economy, the ability of certain vendors to supply required products has been impaired as a result of the illness or absenteeism of their workforces, government mandated shutdown orders, impaired financial conditions, or for other reasons. The supply of each product may not return to pre-COVID-19 levels, and if so, products may return to pre-COVID levels at different times, and our efforts to ensure in-stock positions for all of the products that our consumers require may not be successful.
The cost of raw materials could increase our cost of goods sold and cause our results of operations and financial condition to suffer.
Our principal chemical raw materials are granular chlorine compounds, which are commodity materials. The prices of granular chlorine compounds are a function of, among other things, manufacturing capacity and demand. We have generally passed through chlorine price increases to our consumers. The price of granular chlorine compounds may increase in the future and we may not be able to pass on any such increase to our consumers. We purchase granular chlorine compounds primarily from the nation’s largest suppliers. The alternate sources of supply we currently view as reliable may ultimately be unable to supply us with all of our raw materials and finished goods, including chlorine products. Additionally, significant price fluctuations or shortages in raw materials needed for our products may increase our cost of goods sold and cause our results of operations and financial condition to suffer.
Risks Related to Commercialization of Our Products
Even if we are able to attain significant market acceptance of our planned or future products or services, the commercial success of our planned or future products is not guaranteed.
Our future financial success will depend substantially on our ability to effectively and profitably market and sell our planned and future products and services on a sustained basis, which ability is dependent on a number of additional and/or unpredictable factors. Successful growth of our sales and marketing efforts will depend on the strength of our marketing infrastructure and the effectiveness of our sales and marketing strategies. Our ability to satisfy product demand driven by our sales and marketing efforts will be largely dependent on the ability to maintain a commercially viable manufacturing process that is compliant with regulatory standards. If we fail to market and sell our planned or future products or services successfully, we will not be able to achieve profitability, which could have a material adverse effect on our business, financial condition, and results of operations.
We may implement a product recall or voluntary market withdrawal, which could significantly increase our costs, damage our reputation, and disrupt our business.
The manufacturing, packaging, marketing, and processing of our products involves an inherent risk that our processes do not meet applicable quality standards and requirements. In that event, we may voluntarily implement a recall or market withdrawal or may be required to do so by a regulatory authority. A recall or market withdrawal of one of our products would be costly and would divert management resources. A recall or withdrawal of one of our products, or a similar product processed by another entity, also could impair sales of our products because of confusion concerning the scope of the recall or withdrawal, or because of the damage to our reputation for quality and safety.
25
If we do not manage product inventory in an effective and efficient manner, it could adversely affect profitability.
Many factors affect the efficient use and planning of product inventory, such as effectiveness of predicting demand, preparing manufacturing to meet demand, meeting product mix and product demand requirements, and managing product expiration. We may be unable to manage our inventory efficiently, keep inventory within expected budget goals, keep our work-in-process inventory on hand or manage it efficiently, control expired product, or keep sufficient product on hand to meet demand. We may not be able to keep inventory costs within our target levels. Failure to do so may harm our long-term growth prospects.
If we do not continue to obtain favorable purchase terms with manufacturers, it could adversely affect our operating results.
Most raw materials and those products not repackaged by us are purchased directly from manufacturers. It is common in the swimming pool supply industry for certain manufacturers to offer extended payment terms on certain products to quantity purchasers such as us. These payment terms typically include favorable pricing and are available to us for pre-season or early season purchases. If we do not continue to maintain such favorable purchase terms with manufacturers, it could adversely affect our operating results.
Risks Related to Government Regulation
The nature of our business subjects us to compliance with employment, environmental, health, transportation, safety, and other governmental regulations.
We are subject to federal, state, and local laws and regulations relating to matters such as product labeling, weights and measures, zoning, land use, environmental protection, local fire codes, and workplace safety, including regulation by the Environmental Protection Agency, the Consumer Product Safety Commission, the Department of Transportation, the Occupational Safety and Health Administration, and the National Fire Protection Agency and corresponding state and local authorities. Most of these requirements govern the packaging, labeling, handling, transportation, storage, disposal, and sale of chemicals. We store certain types of chemicals at each of our locations and the storage of these items is strictly regulated by local fire codes. In addition, we sell algaecides and related products that are regulated under the Federal Insecticide, Fungicide and Rodenticide Act, and various state pesticide laws. These laws primarily relate to labeling, annual registration, and licensing. Compliance with applicable data privacy and security laws and regulations (including applicable industry standards) may also increase our costs of doing business.
Management has processes in place to facilitate and support our compliance with these requirements. However, failure to comply with these laws and regulations may result in investigations, the assessment of administrative, civil and criminal fines, damages, seizures, disgorgements, penalties, or the imposition of injunctive relief. Moreover, compliance with such laws and regulations in the future could prove to be costly. Although we presently do not expect to incur any capital or other expenditures relating to regulatory matters in amounts that may be material to us, we may be required to make such expenditures in the future. These laws and regulations have changed substantially and rapidly in recent years, and we anticipate that there will be continuing changes.
The clear trend in environmental, health, transportation, and safety regulations is to place more restrictions and limitations on activities that impact the environment, such as the use and handling of chemicals. Increasingly, strict restrictions and limitations have resulted in higher operating costs for us and it is possible that the costs of compliance with such laws and regulations will continue to increase. Our attempts to anticipate future regulatory requirements that might be imposed and our plans to
26
remain in compliance with changing regulations and to minimize the costs of such compliance may not be as effective as we anticipate.
We depend on a network of suppliers to source our products, including our own branded products. Product quality, warranty claims or safety concerns could negatively impact our sales and expose us to litigation.
We rely on manufacturers and other suppliers to provide us with the products we sell. As we increase the number of branded products we sell, our exposure to potential liability claims may increase. Product and service quality issues could negatively impact consumer confidence in our brands and our business. If our product and service offerings do not meet applicable safety standards or our consumers’ expectations regarding safety or quality, we could experience lost sales and increased costs and be exposed to legal, financial, and reputational risks, as well as governmental enforcement actions. Actual, potential or perceived product safety concerns, including health-related concerns, could expose us to litigation, as well as government enforcement actions, and result in costly product recalls and other liabilities.
In addition, if our products are defectively designed, manufactured or labeled, contain defective components or are misused, we may become subject to costly litigation initiated by consumers. Product liability claims could harm our reputation, divert management’s attention from our core business, be expensive to defend, and may result in sizable damage awards against us. Although we maintain product liability insurance, we may not have sufficient insurance coverage for future product liability claims. We may not be able to obtain insurance in amounts or scope sufficient to provide us with adequate coverage against all potential liabilities. Any product liability claims brought against us, with or without merit, could increase our product liability insurance rates or prevent us from securing continuing coverage, harm our reputation, significantly increase our expenses, and reduce product sales. Product liability claims could cause us to incur significant legal fees and deductibles and claims in excess of our insurance coverage would be paid out of cash reserves, harming our financial condition and operating results. In addition, successful product liability claims made against one of our competitors could cause claims to be made against us or expose us to a perception that we are vulnerable to similar claims. Claims against us, regardless of their merit or potential outcome, may also hurt our ability to obtain acceptance of our products or to expand our business.
Risks Related to Intellectual Property Matters
If we are unable to adequately protect our intellectual property rights, our competitive position could be harmed, we may not be able to build name recognition in our markets of interest, or we could be required to incur significant expenses to enforce or defend our rights.
In the course of our business, we employ various trademarks, trade names, and service marks as well as our logo in packaging and advertising of our products. Our commercial success will depend in part on our success in obtaining and maintaining issued trademarks, trade names, and service marks in the United States and protecting our proprietary technology. If we do not adequately protect our intellectual property and proprietary technology, competitors may be able to use our technologies or the goodwill we have acquired in the marketplace and erode or negate any competitive advantage we may have, which could harm our business and ability to achieve profitability.
Our ability to enforce our intellectual property rights depends on our ability to detect infringement. It may be difficult to detect infringers who do not advertise the components that are used in their products. Moreover, it may be difficult or impossible to obtain evidence of infringement in a competitor’s or potential competitor’s product. We may not prevail in any lawsuits that we initiate and the damages or other remedies awarded if we were to prevail may not be commercially meaningful.
27
If our trademarks and trade names are not adequately protected, we may not be able to build name recognition in our target markets and our business may be adversely affected. At times, competitors may adopt trade names or trademarks similar to ours, thereby impeding our ability to build brand identity, possibly leading to market confusion and potentially requiring us to pursue legal action. In addition, there could be potential trade name or trademark infringement claims brought by owners of other registered trademarks or trademarks that incorporate variations of our unregistered trademarks or trade names. If we are unable to successfully register our trademarks and trade names and establish name recognition based on our trademarks and trade names, then we may not be able to compete effectively and our business may be adversely affected. Our efforts to enforce or protect our proprietary rights related to trademarks, domain names, copyrights, or other intellectual property may be ineffective and could result in substantial costs and diversion of resources and could adversely impact our financial condition or results of operations.
Our success depends in part on our ability to operate without infringing on or misappropriating the proprietary rights of others, and if we are unable to do so we may be liable for damages.
We cannot be certain that United States or foreign patents or patent applications of other companies do not exist or will not be issued that would prevent us from commercializing our products. Third parties may sue us for infringing or misappropriating their patent or other intellectual property rights. Intellectual property litigation is costly. If we do not prevail in litigation, in addition to any damages we might have to pay, we could be required to cease the infringing activity or obtain a license requiring us to make royalty payments. It is possible that a required license may not be available to us on commercially acceptable terms, if at all. In addition, a required license may be non-exclusive, and therefore our competitors may have access to the same technology licensed to us. If we fail to obtain a required license or are unable to design around another company’s patent, we may be unable to make use of some of the affected products, which would reduce our revenues.
The defense costs and settlements for patent infringement lawsuits are not covered by insurance. Patent infringement lawsuits can take years to settle. If we are not successful in our defenses or are not successful in obtaining dismissals of any such lawsuit, legal fees or settlement costs could have a material adverse effect on our results of operations and financial position.
Risks Related to Our Indebtedness
Our substantial indebtedness could materially adversely affect our financial condition and our ability to operate our business, react to changes in the economy or industry or pay our debts and meet our obligations under our debt agreements, and could divert our cash flow from operations to debt payments.
We have a substantial amount of indebtedness. As of January 31, 2021, our total borrowings under our Term Loan, and Credit Agreement, dated as of October 16, 2012, as amended from time to time, among Leslie’s Poolmart, Inc., the subsidiary borrowers from time to time party hereto, Leslie’s, Inc., each lender from time to time party hereto, Bank of America, N.A., as Administrative Agent, and U.S. Bank National Association, as Co-Collateral Agent (the “ABL Credit Facility,” and, together with the Term Loan, the “Credit Facilities”) was $809.1 million. Subject to restrictions in the agreements governing our Credit Facilities, we may incur additional debt.
Our substantial debt could have important consequences to our stockholders, including the following:
| • | it may be difficult for us to satisfy our obligations, including debt service requirements under our existing or future debt agreements, resulting in possible defaults on and acceleration of such debt; |
28
| • | our ability to obtain additional financing for working capital, capital expenditures, debt service requirements, or other general corporate purposes may be impaired; |
| • | a substantial portion of cash flow from operations may be dedicated to the payment of principal and interest on our debt, therefore reducing our ability to use our cash flow to fund our operations, capital expenditures, future business opportunities, and acquisitions or for other purposes; |
| • | we are more vulnerable to economic downturns and adverse industry conditions and our flexibility to plan for, or react to, changes in our business or industry is more limited; |
| • | our ability to capitalize on business opportunities and to react to competitive pressures, as compared to our competitors, may be compromised due to our high level of debt and restrictive covenants contained in the agreements governing our existing and any future debt; and |
| • | our ability to borrow additional funds or to refinance debt may be limited. |
Furthermore, all of our debt under our Credit Facilities bears interest at variable rates. If these rates were to increase significantly, our ability to borrow additional funds may be reduced and the risks related to our substantial debt would intensify.
Servicing our debt requires a significant amount of cash. Our ability to generate sufficient cash depends on numerous factors beyond our control, and we may be unable to generate sufficient cash flow to service our debt obligations.
Our business may not generate sufficient cash flow from operating activities to service our debt obligations. Our ability to make payments on and to refinance our debt and to fund planned capital expenditures depends on our ability to generate cash in the future. To some extent, this is subject to general economic, financial, competitive, legislative, regulatory, and other factors that are beyond our control.
If we are unable to generate sufficient cash flow from operations to service our debt and meet our other commitments, we may need to refinance all or a portion of our debt, sell material assets or operations, delay capital expenditures, or raise additional debt or equity capital. We may not be able to effect any of these actions on a timely basis, on commercially reasonable terms or at all, and these actions may not be sufficient to meet our capital requirements. In addition, the terms of our existing or future debt agreements may restrict us from pursuing any of these alternatives.
Restrictive covenants in the agreements governing our Credit Facilities may restrict our ability to pursue our business strategies, and failure to comply with any of these restrictions could result in acceleration of our debt.
The operating and financial restrictions and covenants in the agreements governing our Credit Facilities may materially adversely affect our ability to finance future operations or capital needs or to engage in other business activities. Such agreements limit our ability, among other things, to:
| • | incur additional debt or issue certain preferred shares; |
| • | pay dividends on or make distributions in respect of our common stock or make other restricted payments; |
| • | make certain investments; |
| • | sell certain assets; |
| • | create liens; |
29
| • | consolidate, merge, sell, or otherwise dispose of our assets; |
| • | make certain payments in respect of certain debt obligations; |
| • | enter into certain transactions with our affiliates; and |
| • | designate our subsidiaries as unrestricted subsidiaries. |
A breach of any of these covenants could result in an event of default under our Credit Facilities. Upon the occurrence of an event of default under any of our Credit Facilities, the lenders could elect to declare all amounts outstanding under our Credit Facilities to be immediately due and payable and terminate all commitments to extend further credit. If we were unable to repay those amounts, the lenders under our Credit Facilities could proceed against the collateral granted to them to secure the debt under the Credit Facilities. We have pledged substantially all of our assets as collateral to secure our Credit Facilities. Our future operating results may not be sufficient to enable compliance with our Credit Facilities, and we may not have sufficient assets to repay amounts outstanding under our Credit Facilities. In addition, in the event of an acceleration of our debt upon an event of default, we may not have or be able to obtain sufficient funds to make any accelerated payments.
Furthermore, the terms of any future debt we may incur could have further additional restrictive covenants. We may not be able to maintain compliance with these covenants in the future, and in the event that we are not able to maintain compliance, we cannot assure you that we will be able to obtain waivers from the lenders or amend the covenants.
Despite current debt levels, we and our subsidiaries may still be able to incur substantially more debt. This could further exacerbate the risks associated with our substantial leverage.
We and our subsidiaries may be able to incur substantial additional debt in the future. Although the agreements governing our Credit Facilities contain restrictions on the incurrence of additional debt, these restrictions are subject to a number of qualifications and exceptions, and the debt incurred in compliance with these restrictions could be substantial. Additionally, we may successfully obtain waivers of these restrictions. If we incur additional debt above the levels currently in effect, the risks associated with our leverage, including those described above, would increase.
The phaseout of the London Interbank Offered Rate (LIBOR), or the replacement of LIBOR with a different reference rate, may adversely affect interest rate.
On July 27, 2017, the United Kingdom’s Financial Conduct Authority, which regulates LIBOR, announced that it intends to phase out LIBOR by the end of 2021. It is unclear if LIBOR will cease to exist at that time or if new methods of calculating LIBOR will be established such that it continues to exist after 2021. On November 30, 2020, ICE Benchmark Administration (“IBA”), the administrator of LIBOR, with the support of the United States Federal Reserve and the United Kingdom’s Financial Conduct Authority, announced plans to consult on ceasing publication of USD LIBOR on December 31, 2021 for only the one week and two month USD LIBOR tenors, and on June 30, 2023 for all other USD Libor tenors. While this announcement extends the transition period to June 2023, the United States Federal Reserve concurrently issued a statement advising banks to stop new USD LIBOR issuances by the end of 2021. In light of these recent announcements, the future of LIBOR at this time is uncertain and any changes in the methods by which LIBOR is determined or regulatory activity related to LIBOR’s phaseout could cause LIBOR to perform differently than in the past or cease to exist. Although regulators and IBA have made clear that the recent announcements should not be read to say that LIBOR has ceased or will cease, in the event LIBOR does cease to exist, we may need to renegotiate our credit agreements and related agreements, which may result in interest rates and/or payments that do not correlate over time with the interest rates and/or payments that would have been
30
made on our obligations if LIBOR was available in its current form. Changes in the method of calculating LIBOR, or the replacement of LIBOR with an alternative rate or benchmark, may adversely affect interest rates and result in higher borrowing costs. This could materially and adversely affect our results of operations, cash flow and liquidity.
Risks Related to the Offering and Ownership of Our Common Stock
An active trading market for our common stock may not be sustained.
Although our common stock is traded on Nasdaq under the symbol “LESL,” there is a very limited trading history and an active trading market for our common stock may not be sustained. Accordingly, no assurance can be given as to the following:
| • | the likelihood that an active trading market for our common stock will be sustained; |
| • | the liquidity of any such market; |
| • | the ability of our stockholders to sell their shares of common stock; or |
| • | the price that our stockholders may obtain for their common stock. |
If an active market for our common stock with meaningful trading volume is not maintained, the market price of our common stock may decline materially below the offering price and you may not be able to sell your shares. The public offering price for our shares in this offering will be determined by negotiations between the selling stockholders and representatives of the underwriters and may not be indicative of prices that will prevail in the open market following this offering. Consequently, you may not be able to sell our common stock at prices equal to or greater than the price you paid in this offering.
The market price and trading volume of our stock may be volatile or may decline regardless of our operating performance, resulting in substantial losses for investors, and could decline substantially following this offering.
The market price and trading volume of our common stock may fluctuate significantly in response to numerous factors, many of which are beyond our control, including:
| • | actual or anticipated fluctuations in our results of operations; |
| • | the financial projections we may provide to the public, any changes in these projections, or our failure to meet these projections; |
| • | failure of securities analysts to initiate or maintain coverage of us, changes in financial estimates or ratings or negative reports by any securities analysts who follow us or our failure to meet these estimates or the expectations of investors; |
| • | announcements by us or our competitors of significant technical innovations, acquisitions, strategic partnerships, joint ventures, results of operations, or capital commitments; |
| • | changes in operating performance and stock market valuations of other retail companies generally, or those in our industry in particular; |
| • | price and volume fluctuations in the overall stock market, including as a result of trends in the economy as a whole; |
| • | changes in our board of directors or management; |
| • | sales of large blocks of our common stock, including sales by our executive officers or directors; |
31
| • | lawsuits threatened or filed against us; |
| • | changes in laws or regulations applicable to our business; |
| • | changes in our capital structure, such as future issuances of debt or equity securities; |
| • | short sales, hedging, and other derivative transactions involving our capital stock; |
| • | general economic conditions in the United States; |
| • | other events or factors, including those resulting from war, incidents of terrorism, pandemics, or other public health emergencies or responses to these events; and |
| • | the other factors described in the sections titled “Risk Factors” and “Cautionary Note Regarding Forward-Looking Statements.” |
Future sales of shares by existing stockholders could cause our stock price to decline.
If our existing stockholders sell, or indicate an intention to sell, substantial amounts of our common stock in the public market after the contractual lock-up agreements described below expire and other restrictions on resale lapse, the trading price of our common stock could be adversely impacted. As of January 31, 2021, we had outstanding 186,873,341 million shares of common stock. Approximately 73% of these shares are subject to a 180-day contractual lock-up with the underwriters in connection with our initial public offering (“IPO”), with such lock-up agreements to expire on April 26, 2021. The underwriters may permit our executive officers, directors, employees, and current stockholders who are subject to the contractual lock-up to sell shares prior to the expiration of the lock-up agreements. The representatives for the underwriters in the IPO agreed to waive the IPO lock-up with respect to the filing by us of the registration statement of which this prospectus forms a part and the offer and sale by the selling stockholders of the shares in this offering. Upon the expiration of the lock-up agreements, all such shares will be eligible for resale in the public market, subject to applicable securities laws, including the Securities Act. In addition, as discussed in “Certain Relationships and Related Party Transactions,” following the expiration of the 180-day contractual lock-up, certain officers, directors, and employees will be prohibited from selling shares for an additional 540 days, subject to limited waivers and exceptions, with such additional lock-up period expiring on October 18, 2022. Upon expiration of each of these lock-up periods, the trading price of our common stock could be adversely impacted if any of these certain significant stockholders sell, or indicate an intention to sell, substantial amounts of our common stock in the public market.
Stockholders’ ability to influence corporate matters may be limited because a small number of stockholders beneficially own a substantial amount of our common stock and continue to have substantial control over us.
As of January 31, 2021, our officers, directors, and principal stockholders (greater than 5% stockholders) collectively beneficially own approximately 69% of our issued and outstanding common stock ( % following completion of this offering or % if the underwriters exercise their option to purchase additional shares in full). As a result, these stockholders will be able to exert significant influence over all matters requiring stockholder approval, including the election of directors and approval of significant corporate transactions, such as a merger or other sale of our Company or its assets, and may have interests that are different from our other stockholders’ and may vote in a way with which other stockholders disagree and which may be adverse to the interests of our other stockholders. In addition, this concentration of ownership may have the effect of preventing, discouraging, or deferring a change of control, which could depress the market price of our common stock.
32
Transactions engaged in by our principal stockholders, our officers or directors involving our common stock may have an adverse effect on the price of our stock.
As described above, our officers, directors, and principal stockholders (greater than 5% stockholders) collectively control approximately 69% of our issued and outstanding common stock as of January 31, 2021 ( % following completion of this offering or % if the underwriters exercise their option to purchase additional shares in full). Sales of our shares by these stockholders, including in this offering, could have the effect of lowering our stock price. The perceived risk associated with the possible sale of a large number of shares by these stockholders, or the adoption of significant short positions by hedge funds or other significant investors, could cause some of our stockholders to sell their stock, thus causing the price of our stock to decline. In addition, actual or anticipated downward pressure on our stock price due to actual or anticipated sales of stock by our directors or officers could cause other institutions or individuals to engage in short sales of our common stock, which may further cause the price of our stock to decline.
From time to time, our directors and executive officers may sell shares of our common stock on the open market. These sales will be publicly disclosed in filings made with the Securities and Exchange Commission (the “SEC”). In the future, our directors and executive officers may sell a significant number of shares for a variety of reasons unrelated to the performance of our business. Our stockholders may perceive these sales as a reflection on management’s view of the business and result in some stockholders selling their shares of our common stock. These sales could cause the price of our stock to drop.
Certain of our stockholders have the right to engage or invest in the same or similar businesses as us.
L Catterton and GIC Pte. Ltd. (“GIC”) each engage in other investments and business activities in addition to their ownership of us. Under our fifth amended and restated certificate of incorporation, L Catterton and GIC each have the right, and have no duty to abstain from exercising such right, to engage or invest in the same or similar businesses as us, do business with any of our customers or vendors, or employ or otherwise engage any of our officers, directors or employees. If L Catterton, GIC or any of their respective officers, directors or employees acquire knowledge of a potential transaction that could be a corporate opportunity, they have no duty, to the fullest extent permitted by law, to offer such corporate opportunity to us, our stockholders or our affiliates.
In the event that any of our directors and officers who is also a director, officer or employee of L Catterton or GIC acquires knowledge of a corporate opportunity or is offered a corporate opportunity, provided that this knowledge was not acquired solely in such person’s capacity as our director or officer and such person acts in good faith to the fullest extent permitted by law, then even if L Catterton or GIC pursue or acquire the corporate opportunity or if L Catterton or GIC do not present the corporate opportunity to us, such person is deemed to have fully satisfied such person’s fiduciary duties owed to us and is not liable to us.
We do not intend to pay dividends for the foreseeable future.
We currently intend to retain any future earnings to finance the operation and expansion of our business and we do not expect to declare or pay any dividends in the foreseeable future. As a result, stockholders must rely on sales of their common stock after price appreciation as the only way to realize any future gains on their investment.
33
Anti-takeover provisions in our charter documents and under Delaware law could make an acquisition of us more difficult, limit attempts by our stockholders to replace or remove our current management, and limit the market price of our common stock.
Provisions in our certificate of incorporation and bylaws may have the effect of delaying or preventing a change of control or changes in our management. Our amended and restated certificate of incorporation and amended and restated bylaws include provisions that:
| • | permit the board of directors to establish the number of directors and fill any vacancies and newly created directorships; |
| • | provide that, from and after the date on which our private equity sponsors cease to beneficially own at least a majority of the outstanding shares of our common stock (the “Trigger Event”), a director may be removed only for cause and only by the affirmative vote of the holders of at least 66 2/3% in voting power of all the then-outstanding shares of stock of the Company entitled to vote thereon, voting together as a single class; |
| • | provide that, from and after the Trigger Event, the affirmative vote of the holders of at least 66 2/3% in voting power of all the then-outstanding shares of stock of the Company entitled to vote thereon, voting together as a single class, is required in order to amend certain provisions of our fifth amended and restated certificate of incorporation regarding the amendment of our fifth amended and restated certificate of incorporation, the composition and authority of our board of directors, the election and removal of directors, limitations of director liability, stockholder meetings, corporate opportunities, choice of forum and the interpretation of our fifth amended and restated certificate of incorporation; |
| • | authorize the board of directors to amend our bylaws without the assent or vote of shareholders, provided that, from and after the Trigger Event, stockholders may amend the bylaws with the affirmative vote of the holders of at least 66 2/3% in voting power of all the then-outstanding shares of stock of the Company entitled to vote thereon, voting together as a single class; |
| • | from and after the Trigger Event and with the exception of actions required or permitted to be taken by the holders of preferred stock, prohibit stockholder action by written consent, instead requiring stockholder actions to be taken at a meeting of our stockholders; |
| • | permit our board of directors, without further action by our stockholders, to fix the rights, preferences, privileges, and restrictions of preferred stock, the rights of which may be greater than the rights of our common stock; |
| • | restrict the forum for certain litigation against us to Delaware; |
| • | establish advance notice requirements for nominations for election to our board of directors or for proposing matters that can be acted upon by stockholders at annual stockholder meetings; and |
| • | provide for a staggered board. |
These provisions may frustrate or prevent any attempts by our stockholders to replace or remove our current management by making it more difficult for stockholders to replace members of our board of directors, which is responsible for appointing the members of our management. As a result, these provisions may adversely affect the market price and market for our common stock if they are viewed as limiting the liquidity of our stock or as discouraging takeover attempts in the future.
34
The provision of our fifth amended and restated certificate of incorporation, requiring exclusive forum in certain courts in the State of Delaware or the federal district court for the District of Delaware for certain types of lawsuits, may have the effect of discouraging lawsuits against our directors and officers.
Our fifth amended and restated certificate of incorporation requires, to the fullest extent permitted by law, that (i) any derivative action or proceeding brought on our behalf, (ii) any action asserting a claim of breach of a fiduciary duty owed by any of our directors, officers, or other employees or stockholders to us or our stockholders, creditors or other constituents, or a claim of aiding and abetting any such breach of fiduciary duty, (iii) any action asserting a claim against us or our directors or officers arising pursuant to any provision of the Delaware General Corporation Law (the “DGCL”), or our fifth amended and restated certificate of incorporation or our amended and restated bylaws or as to which the DGCL confers jurisdiction on the Court of Chancery of the State of Delaware, (iv) any action to interpret, apply, enforce or determine the validity of our fifth amended and restated certificate of incorporation or amended and restated bylaws, (v) any action asserting a claim against us or our directors or officers governed by the internal affairs doctrine or (vi) any action asserting an “internal corporate claim” as that term is defined in Section 115 of the DGCL will have to be brought only in the Court of Chancery of the State of Delaware (or if the Court of Chancery of the State of Delaware lacks subject matter jurisdiction, any other state court of the State of Delaware, or if no state court of the State of Delaware has subject matter jurisdiction, the federal district court for the District of Delaware), unless we consent in writing to the selection of an alternative forum. The foregoing provision will not apply to claims arising under the Securities Act of 1933, as amended (the “Securities Act”), or the Securities Exchange Act of 1934, as amended (the “Exchange Act”). Unless we consent in writing to the selection of an alternative forum, the federal district court for the District of Delaware shall be, to the fullest extent permitted by law, the exclusive forum for the resolution of any complaint asserting a cause of action arising under the Securities Act against us or any of our directors or officers. Although we believe these exclusive forum provisions benefit us by providing increased consistency in the application of Delaware law and federal securities laws in the types of lawsuits to which each applies, the exclusive forum provisions may limit a stockholder’s ability to bring a claim in a judicial forum that it finds favorable for disputes with us or any of our directors, officers, or stockholders, which may discourage lawsuits with respect to such claims. Our stockholders will not be deemed to have waived our compliance with the federal securities laws and the rules and regulations thereunder as a result of our exclusive forum provisions. Further, in the event a court finds either exclusive forum provision contained in our fifth amended and restated certificate of incorporation to be unenforceable or inapplicable in an action, we may incur additional costs associated with resolving such action in other jurisdictions, which could harm our business, operating results, and financial condition.
We will continue to incur increased costs as a result of being a public company, and our management will continue to be required to devote substantial time to compliance with our public company responsibilities and corporate governance practices.
As a company with publicly-traded securities, we expect to incur costs associated with corporate governance requirements that are applicable to us as a public company, including rules and regulations of the SEC, under the Sarbanes-Oxley Act of 2002 (the “Sarbanes-Oxley Act”), the Dodd-Frank Wall Street Reform and Consumer Protection Act of 2010, the Exchange Act, as well as the Nasdaq listing requirements. These rules and regulations are expected to significantly increase our accounting, legal, and financial compliance costs and make some activities more time-consuming. We also expect these rules and regulations to make it more expensive for us to maintain directors’ and officers’ liability insurance. As a result, it may be more difficult for us to attract and retain qualified persons to serve on our board of directors or as executive officers. Furthermore, these rules and regulations will increase our legal and financial compliance costs and will make some activities more time-consuming and costly. We cannot predict or estimate the amount of additional costs we will
35
continue to incur as a public company or the timing of such costs. Accordingly, increases in costs incurred as a result of becoming a publicly traded company may adversely affect our business, financial condition, and results of operations.
If we are unable to effectively implement or maintain a system of internal control over financial reporting, we may not be able to accurately or timely report our financial results and our stock price could be adversely affected.
As a result of becoming a public company, we will be required by Section 404 of the Sarbanes-Oxley Act to evaluate the effectiveness of our internal control over financial reporting as of the end of each fiscal year and include a management report assessing the effectiveness of our internal control over financial reporting, beginning with our Annual Report on Form 10-K for the year ending October 2, 2021. In the following year, we must include a report issued by our independent registered public accounting firm based on its audit of the Company’s internal control over financial reporting, in each case. We may identify weaknesses or deficiencies that we may be unable to remedy before the requisite deadline for those reports or we may be unable to complete our assessment in a timely manner.
Any failure to maintain internal control over financial reporting could severely inhibit our ability to accurately report our financial condition or results of operations. The effectiveness of our controls and procedures may be limited by a variety of factors, including:
| • | faulty human judgment and simple errors, omissions, or mistakes; |
| • | fraudulent action of an individual or collusion of two or more people; |
| • | inappropriate management override of procedures; and |
| • | the possibility that any enhancements to controls and procedures may still not be adequate to assure timely and accurate financial control. |
Our ability to comply with the annual internal control report requirements will depend on the effectiveness of our financial reporting and data systems and controls across the Company. We expect these systems and controls to involve significant expenditures and to become increasingly complex as our business grows. To effectively manage this complexity, we will need to continue to improve our operational, financial, and management controls, and our reporting systems and procedures. Any weaknesses or deficiencies or any failure to implement required new or improved controls, or difficulties encountered in the implementation or operation of these controls, could harm our operating results and cause us to fail to meet our financial reporting obligations or result in material misstatements in our financial statements, which could limit our ability to access the capital markets, adversely affect our business and investor confidence in us, and reduce our stock price.
At the completion of our IPO, we were a “controlled company” within the meaning of the corporate governance standards of Nasdaq, but have since lost “controlled company” status and are relying on the one-year transition period afforded by the rules of Nasdaq. During this transition period, you may not have the same protections afforded to stockholders of companies that are subject to such requirements.
At the completion of our IPO, more than 50% of the voting power in the election of our directors was held by an individual, group, or another company, and as a result, we were a “controlled company” within the meaning of the corporate governance standards of Nasdaq. As of November 11, 2020, we were no longer a controlled company and must comply with certain corporate governance requirements by the conclusion of the one-year transition period afforded by the rules of Nasdaq, or November 11, 2021, including the requirements that:
| • | a majority of our board of directors consists of “independent directors,” as defined under the rules of such exchange; |
36
| • | our board of directors has a compensation committee that is composed entirely of independent directors with a written charter addressing the committee’s purpose and responsibilities; and |
| • | our board of directors has a nominating and corporate governance committee that is composed entirely of independent directors with a written charter addressing the committee’s purpose and responsibilities. |
As a result, the majority of our directors are not currently independent and, with the exception of the audit committee, no committee of our board of directors is composed entirely of independent directors. Accordingly, until such time at which we comply with the above-mentioned corporate governance requirements, you may not have the same protections afforded to stockholders of companies that are subject to all of the corporate governance requirements of Nasdaq.
37
CAUTIONARY NOTE REGARDING FORWARD-LOOKING STATEMENTS
This prospectus contains forward-looking statements about us and our industry that involve substantial risks and uncertainties. All statements other than statements of historical facts contained in this prospectus, including statements regarding our future results of operations or financial condition, business strategy and plans and objectives of management for future operations, are forward-looking statements. In some cases, you can identify forward-looking statements because they contain words such as “anticipate,” “believe,” “contemplate,” “continue,” “could,” “estimate,” “expect,” “intend,” “may,” “plan,” “potential,” “predict,” “project,” “should,” “target,” “will,” or “would” or the negative of these words or other similar terms or expressions. Our actual results could differ materially from those indicated in these forward-looking statements for a variety of reasons, including, among others:
| • | our ability to execute on our growth strategies; |
| • | our ability to maintain favorable relationships with suppliers and manufacturers; |
| • | competition from mass merchants and specialty retailers; |
| • | impacts on our business from the sensitivity of our business to weather conditions, changes in the economy, and the housing market; |
| • | our ability to implement technology initiatives that deliver the anticipated benefits, without disrupting our operations; |
| • | our ability to attract and retain senior management and other qualified personnel; |
| • | regulatory changes and development affecting our current and future products; |
| • | our ability to obtain additional capital to finance operations; |
| • | our ability to establish and maintain intellectual property protection for our products, as well as our ability to operate our business without infringing the intellectual property rights of others; |
| • | impacts on our business from the COVID-19 pandemic; and |
| • | other risks and uncertainties, including those listed in the section titled “Risk Factors.” |
You should not rely on forward-looking statements as predictions of future events. We have based the forward-looking statements contained in this prospectus primarily on our current expectations and projections about future events and trends that we believe may affect our business, financial condition, and operating results. The outcome of the events described in these forward-looking statements is subject to risks, uncertainties, and other factors described in the section titled “Risk Factors” and elsewhere in this prospectus. Moreover, we operate in a very competitive and rapidly changing environment. New risks and uncertainties emerge from time to time, and it is not possible for us to predict all risks and uncertainties that could have an impact on the forward-looking statements contained in this prospectus. The results, events, and circumstances reflected in the forward-looking statements may not be achieved or occur, and actual results, events, or circumstances could differ materially from those described in the forward-looking statements.
In addition, statements that “we believe” and similar statements reflect our beliefs and opinions on the relevant subject. These statements are based on information available to us as of the date of this prospectus. And while we believe that information provides a reasonable basis for these statements, that information may be limited or incomplete. Our statements should not be read to indicate that we have conducted an exhaustive inquiry into, or review of, all relevant information. These statements are inherently uncertain, and investors are cautioned not to unduly rely on these statements.
38
The forward-looking statements made in this prospectus are based on events or circumstances as of the date on which the statements are made. We undertake no obligation to update any forward-looking statements made in this prospectus to reflect events or circumstances after the date of this prospectus or to reflect new information or the occurrence of unanticipated events, except as required by law. We may not actually achieve the plans, intentions, or expectations disclosed in our forward-looking statements, and you should not place undue reliance on our forward-looking statements. Our forward-looking statements do not reflect the potential impact of any future acquisitions, mergers, dispositions, joint ventures, or investments.
39
The selling stockholders will receive all net proceeds from the sale of the shares of our common stock to be sold in this offering. We will not receive any of the proceeds from the sale of our common stock by the selling stockholders, including from any exercise by the underwriters of their option to purchase additional shares. The expenses of the offering, not including the underwriting discount, are estimated at $ million and are payable by us. See “Underwriting”.
40
We have never declared nor paid any cash dividends on our common stock. We currently intend to retain all available funds and any future earnings for use in the operation of our business and do not expect to pay any dividends on our common stock in the foreseeable future. Any future determination relating to our dividend policy will be made by our board of directors and will depend on a number of factors, including: our actual and projected financial condition, liquidity, and results of operations; our capital levels and needs; tax considerations; any acquisitions or potential acquisitions that we may examine; statutory and regulatory prohibitions and other limitations; the terms of any credit agreements or other borrowing arrangements that restrict the amount of cash dividends that we can pay; general economic conditions; and other factors deemed relevant by our board of directors. We are not obligated to pay dividends on our common stock.
41
The following table sets forth our cash and cash equivalents and capitalization as of January 2, 2021.
| Cash and cash equivalents |
$ | |||
| Debt: |
||||
| Term Loan—due on August 16, 2023 |
||||
| Senior Unsecured Notes—due on August 16, 2024 |
||||
| ABL Credit Facility—due on August 13, 2025 |
||||
| Stockholder’s equity: |
||||
| Common stock, $0.001 par value, 186,873,341 shares authorized issued and outstanding at January 31, 2021, 1,001,000,000 authorized, 186,606,228 shares, issued and outstanding |
||||
| Preferred stock, $0.001 par value, no shares authorized, issued and outstanding, actual, 1,000,000 shares authorized and no shares issued and outstanding, as adjusted |
||||
| Capital deficit |
||||
| Retained deficit |
||||
|
|
|
|||
| Total stockholder’s deficit |
||||
|
|
|
|||
| Total capitalization |
$ | |||
|
|
|
The number of shares of common stock that will be outstanding after this offering is based on 186,873,341 million shares of common stock outstanding as of January 31, 2021 and excludes shares of common stock reserved for future issuance under our 2020 Omnibus Incentive Plan.
You should read this information in conjunction with our consolidated financial statements and the related notes and the sections entitled “Management’s Discussion and Analysis of Financial Condition and Results of Operations,” “Selected Historical Consolidated Financial and Other Information,” and “Description of Capital Stock” included elsewhere in this prospectus.
42
SELECTED HISTORICAL CONSOLIDATED FINANCIAL AND OTHER INFORMATION
You should read the following selected consolidated financial data together with the section titled “Management’s Discussion and Analysis of Financial Condition and Results of Operations” and our consolidated financial statements and the related notes included elsewhere in this prospectus. The selected consolidated financial data included in this section are not intended to replace the consolidated financial statements and are qualified in their entirety by the consolidated financial statements and the related notes included elsewhere in this prospectus.
We have derived the following selected consolidated statements of operations data for the fiscal years ended October 3, 2020, September 28, 2019 and September 29, 2018 from our audited consolidated financial statements included elsewhere in this prospectus. Our historical results are not necessarily indicative of the results that may be expected for any future period.
| Fiscal Year Ended | ||||||||||||
| (dollars in thousands, except per share amounts) | October 3, 2020(1) |
September 28, 2019 |
September 29, 2018 |
|||||||||
| Statement of operations data: |
||||||||||||
| Sales |
$ | 1,112,229 | $ | 928,203 | $ | 892,600 | ||||||
| Cost of merchandise and services sold |
651,516 | 548,463 | 535,464 | |||||||||
|
|
|
|
|
|
|
|||||||
| Gross profit |
460,713 | 379,740 | 357,136 | |||||||||
| Selling, general and administrative expenses |
314,338 | 258,152 | 241,669 | |||||||||
|
|
|
|
|
|
|
|||||||
| Operating income |
146,375 | 121,588 | 115,467 | |||||||||
| Other expense: |
||||||||||||
| Interest expense |
84,098 | 98,578 | 91,656 | |||||||||
| Other expenses, net |
1,089 | 7,453 | 1,759 | |||||||||
|
|
|
|
|
|
|
|||||||
| Total other expense |
85,187 | 106,031 | 93,415 | |||||||||
| Income before taxes |
61,188 | 15,557 | 22,052 | |||||||||
| Income tax expense |
2,627 | 14,855 | 4,926 | |||||||||
|
|
|
|
|
|
|
|||||||
| Net income |
$ | 58,561 | $ | 702 | $ | 17,126 | ||||||
|
|
|
|
|
|
|
|||||||
| Per share data: |
||||||||||||
| Basic and diluted |
$ | 0.37 | $ | 0.00 | $ | 0.11 | ||||||
| Balance sheet data: |
||||||||||||
| Cash and cash equivalents |
$ | 157,072 | $ | 90,899 | $ | 77,569 | ||||||
| Total current assets |
372,133 | 282,089 | 255,332 | |||||||||
| Total assets |
746,438 | 479,721 | 453,160 | |||||||||
| Total current liabilities |
258,196 | 165,522 | 137,165 | |||||||||
| Total liabilities |
1,573,437 | 1,367,078 | 1,342,109 | |||||||||
| Total stockholders’ deficit |
(826,999 | ) | (887,357 | ) | (888,949 | ) | ||||||
| Cash flow data: |
||||||||||||
| Net cash provided by operating activities |
$ | 103,409 | $ | 57,821 | $ | 43,280 | ||||||
| Net cash used in investing activities |
(26,811 | ) | (36,996 | ) | (40,219 | ) | ||||||
| Net cash used in financing activities |
(10,425 | ) | (7,495 | ) | (24,386 | ) | ||||||
| Other financial and operations data: |
||||||||||||
| Number of new locations and acquired |
10 | 28 | 38 | |||||||||
| Number of locations open at end of period |
936 | 952 | 940 | |||||||||
| Comparable sales growth(2) |
18.0 | % | 0.4 | % | (1.3 | )% | ||||||
| Adjusted EBITDA(3) |
$ | 182,770 | $ | 160,003 | $ | 151,799 | ||||||
| Adjusted EBITDA as a percentage of sales(3) |
16.4 | % | 17.2 | % | 17.0 | % | ||||||
| Adjusted net income(3) |
$ | 64,973 | $ | 12,765 | $ | 22,927 | ||||||
| Adjusted net income per share |
$ | 0.42 | $ | 0.08 | $ | 0.15 | ||||||
43
| (1) | Consisted of 53 weeks. Please see the section titled “Management’s Discussion and Analysis of Financial Condition and Results of Operations” for an explanation of our fiscal calendar. |
| (2) | Please see the section titled “Management’s Discussion and Analysis of Financial Condition and Results of Operations—Key Factors and Measures We Use to Evaluate Our Business.” |
| (3) | Please see the section titled “Management’s Discussion and Analysis of Financial Condition and Results of Operations—Key Factors and Measures We Use to Evaluate Our Business” for a reconciliation from our net income to adjusted EBITDA and net income to adjusted net income. |
44
MANAGEMENT’S DISCUSSION AND ANALYSIS OF FINANCIAL CONDITION AND RESULTS OF OPERATIONS
The following discussion and analysis of our financial condition and results of operations should be read together with the section titled “Selected Historical Consolidated Financial and Other Information” and our consolidated financial statements and related notes, which are included elsewhere in this prospectus. This discussion may contain forward-looking statements based upon current expectations that involve risks and uncertainties. Our actual results may differ materially from those anticipated in these forward-looking statements as a result of various factors, including those set forth under “Risk Factors” or in other sections of this prospectus.
We operate on a fiscal calendar that results in a fiscal year consisting of a 52- or 53-week period ending on the Saturday closest to September 30th. In a 52-week fiscal year, each quarter contains 13 weeks of operations; in a 53-week fiscal year, each of the first, second and third quarters includes 13 weeks of operations and the fourth quarter includes 14 weeks of operations. References to fiscal year 2020 and fiscal year 2019 refer to the fiscal years ended October 3, 2020 and September 28, 2019. Fiscal year 2020 included 53 weeks of operations. Fiscal year 2019 included 52 weeks of operations.
Our Company
We are the largest and most trusted direct-to-consumer brand in the nearly $11 billion U.S. pool and spa care industry, serving residential, professional, and commercial consumers. Founded in 1963, we are the only direct-to-consumer pool and spa care brand with national scale, operating an integrated marketing and distribution ecosystem powered by a physical network of 936 branded locations and a robust digital platform. We offer an extensive assortment of professional-grade products, the majority of which are exclusive to Leslie’s, as well as certified installation and repair services, all of which are essential to the ongoing maintenance of pools and spas. Our dedicated team of associates, pool and spa care experts, and experienced service technicians are passionate about empowering our consumers with the knowledge, products, and solutions necessary to confidently maintain and enjoy their pools and spas. The considerable scale of our integrated marketing and distribution ecosystem, which is powered by our direct-to-consumer network, uniquely enables us to efficiently reach and service every pool and spa in the continental United States.
We operate primarily in the pool and spa aftermarket industry which is one of the most fundamentally attractive consumer categories given its scale, predictability, and growth outlook. We have a highly predictable, recurring revenue model, as evidenced by our 57 consecutive years of sales growth. More than 80% of our assortment is comprised of non-discretionary products essential to the care of residential and commercial pools and spas. Our assortment includes chemicals, equipment and parts, cleaning and maintenance equipment, and safety, recreational, and fitness-related products. We also offer important essential services, such as equipment installation and repair for residential and commercial consumers. Consumers receive the benefit of extended vendor warranties when purchasing product through our locations or when our certified in-field technicians install or repair equipment on-site. We offer complimentary, commercial-grade in-store water testing and analysis via our proprietary AccuBlue® system, which increases consumer engagement, conversion, basket size, and loyalty, resulting in higher lifetime value. Our water treatment expertise is powered by data and intelligence accumulated from the millions of water tests we have performed over our history, positioning us as the most trusted water treatment service provider in the industry. Due to the non-discretionary nature of our products and services, our business has historically delivered strong, uninterrupted growth and profitability in all market environments, including the Great Recession and the COVID-19 pandemic.
45
We have a legacy of leadership and disruptive innovation. Since our founding in 1963, we have been the leading innovator in our category and have provided our consumers with the most advanced pool and spa care available. As we have scaled, we have leveraged our competitive advantages to strategically reinvest in our business and intellectual property to develop new value-added capabilities. Over the course of our history, we have pioneered complimentary in-store water testing, offered complimentary in-store equipment repair services, introduced the industry’s first loyalty program, and developed an expansive platform of owned and exclusive brands. These differentiated capabilities allow us to meet the needs of any pool and spa owner, whether they care for their pool or spa themselves or rely on a professional, whenever, wherever, and however they choose to engage with us.
Key Factors and Measures We Use to Evaluate Our Business
We consider a variety of financial and operating measures in assessing the performance of our business. The key GAAP measures we use are sales, gross profit and gross margin, selling, general and administrative expenses, and operating income. The key non-GAAP measures we use are comparable sales, comparable sales growth, adjusted EBITDA, adjusted net income, and adjusted net income per share.
Sales
We offer a broad range of products that consists of regularly purchased, non-discretionary pool and spa maintenance items such as chemicals, equipment, cleaning accessories and parts, as well as installation and repair services for pool and spa equipment. Our offering of proprietary, owned and third-party brands across diverse product categories drives sales growth by attracting new consumers and encouraging repeat visits from our existing consumers. We recognize product sales upon purchase of merchandise by the consumer. Sales related to services are recognized when services are performed. Terms are customarily point of sale or free on board shipping point, net of related discounts and sales tax. When we receive payment from consumers before the consumer has taken possession of the merchandise or the service has been performed, the amount received is recorded as deferred revenue until the sale or service is complete. Sales are impacted by product mix and availability, as well as promotional and competitive activities and the spending habits of our consumers. Growth of our sales is primarily driven by comparable sales growth and expansion of our locations in existing and new markets.
Comparable Sales and Comparable Sales Growth
We measure comparable sales growth as the increase or decrease in sales recorded by the comparable base in any reporting period, compared to sales recorded by the comparable base in the prior reporting period. The comparable base includes sales through our locations and through our e-commerce websites and third-party marketplaces. Comparable sales is a key measure used by management and our board of directors to assess our financial performance.
We consider a new or acquired location comparable in the first full month after it has completed 52 weeks of sales. Closed locations become non-comparable during their last partial month of operation. Locations that are relocated are considered comparable at the time the relocation is complete. Comparable sales are not calculated in the same manner by all companies, and accordingly, are not necessarily comparable to similarly titled measures of other companies and may not be an appropriate measure for performance relative to other companies.
The number of new locations reflects the number of locations opened during a particular reporting period. New locations require an initial capital investment in location build-outs, fixtures, and equipment, which we amortize over time as well as cash required for inventory.
46
We opened or acquired 10 locations in fiscal year 2020, 28 locations in fiscal year 2019, and 38 locations in fiscal year 2018. We consolidated operations in certain markets and closed 26 locations in fiscal year 2020, 16 locations in fiscal year 2019, and 5 locations in fiscal year 2018. As of October 3, 2020, we operate 936 retail locations in 37 states across the United States. We own 27 locations and lease the remainder of our locations. Our initial lease terms are typically five years with options to renew for multiple successive five-year periods. We evaluate new opportunities in new and existing markets based on the number of pools and spas in the market, competition, our existing locations, availability and cost of real estate, and distribution cost, and operating costs of our locations. We review performance of our locations on a regular basis and evaluate opportunities to strategically close locations to improve our profitability. Our limited investment costs in individual locations and our ability to transfer sales to our extensive network of remaining locations and e-commerce websites allows us to improve profitability as a result of any strategic closures.
Gross Profit and Gross Margin
Gross profit is equal to our sales less our cost of merchandise and services sold. Cost of merchandise and services sold reflects the direct cost of purchased merchandise, costs to package certain chemical products, including direct materials and labor, costs to provide services, including labor and materials, as well as distribution and occupancy costs. The direct cost of purchased merchandise includes vendor rebates, which are treated as a reduction of merchandise costs. We recognize vendor rebates at the time the obligations to purchase products or perform services have been completed, and the related inventory has been sold. Distribution costs include warehousing and transportation expenses, including costs associated with third-party fulfillment centers used to ship merchandise to our e-commerce consumers. Occupancy costs include the rent, common area maintenance, real estate taxes, and depreciation and amortization costs of all retail locations. These costs are significant and can be expected to continue to increase as our company grows.
Gross margin is gross profit as a percentage of our sales. Gross margin is impacted by merchandise costs, pricing and promotions, product mix and availability, inflation, and service costs, which can vary. Our proprietary brands, custom-formulated products, and vertical integration provide us with cost savings, as well as greater control over product availability and quality as compared to other companies in the industry. Gross margin is also impacted by the costs of distribution and occupancy costs, which can vary.
Our gross profit is variable in nature and generally follows changes in sales. The components of our cost of merchandise and services sold may not be comparable to the components of cost of sales or similar measures of other companies. As a result, our gross profit and gross margin may not be comparable to similar data made available by other companies.
Selling, General and Administrative Expenses
Our selling, general and administrative expenses (“SG&A”), include selling and operating expenses at our retail locations and corporate-level general and administrative expenses. Selling and operating expenses at retail locations include payroll, bonus and benefit costs for personnel, supplies, and credit and debit card processing costs. Corporate expenses include payroll, bonus, and benefit costs for our corporate and field support functions, marketing and advertising, insurance, utilities, occupancy costs related to our corporate office facilities, professional services, and depreciation and amortization for all assets, except those related to our retail locations and distribution operations, which are included in cost of merchandise and services sold. Selling and operating expenses generally vary proportionately with sales and the change in the number of locations. In contrast, general and administrative expenses are generally not directly proportional to sales and the change in the number of locations, but will be expected to increase over time to support the needs of our growing company. The components of our SG&A may not be comparable to the components of similar measures of other companies.
47
Operating Income
Operating income is gross profit less SG&A. Operating income excludes interest expense, income tax expense, and other expenses, net. We use operating income as an indicator of the productivity of our business and our ability to manage expenses.
Adjusted EBITDA
Adjusted EBITDA is a key measure used by management and our board of directors to assess our financial performance. Adjusted EBITDA is also frequently used by analysts, investors and other interested parties to evaluate companies in our industry, when considered alongside other GAAP measures. We use adjusted EBITDA to supplement GAAP measures of performance to evaluate the effectiveness of our business strategies, to make budgeting decisions and to compare our performance against that of other companies using similar measures.
Adjusted EBITDA is defined as earnings before interest (including amortization of debt costs), taxes, depreciation, amortization, loss (gain) on disposition of fixed assets, management fees, equity-based compensation expense, mark-to-market on interest rate cap, and special items. Adjusted EBITDA is not a recognized measure of financial performance under GAAP but is used by some investors to determine a company’s ability to service or incur indebtedness. Adjusted EBITDA is not calculated in the same manner by all companies, and accordingly, is not necessarily comparable to similarly entitled measures of other companies and may not be an appropriate measure for performance relative to other companies. Adjusted EBITDA should not be construed as an indicator of a company’s operating performance in isolation from, or as a substitute for, net income (loss), cash flows from operations or cash flow data, all of which are prepared in accordance with GAAP. We have presented adjusted EBITDA solely as supplemental disclosure because we believe it allows for a more complete analysis of results of operations. Adjusted EBITDA is not intended to represent, and should not be considered more meaningful than, or as an alternative to, measures of operating performance as determined in accordance with GAAP. In the future, we may incur expenses or charges such as those added back to calculate adjusted EBITDA. Our presentation of adjusted EBITDA should not be construed as an inference that our future results will be unaffected by these items.
Adjusted Net Income and Adjusted Net Income per Share
Adjusted net income and adjusted net income per share are additional key measures used by management and our board of directors to assess our financial performance. Adjusted net income and adjusted net income per share are also frequently used by analysts, investors, and other interested parties to evaluate companies in our industry, when considered alongside other GAAP measures.
Adjusted net income is defined as net income adjusted to exclude loss (gain) on disposition of assets, management fees, equity-based compensation expense, mark-to-market on interest rate cap, and special items. Adjusted net income per share is defined as adjusted net income divided by the weighted average number of common shares outstanding.
48
The tables below provide a reconciliation from our net income to adjusted EBITDA and net income to adjusted net income for fiscal year 2020, fiscal year 2019, and fiscal year 2018.
| Fiscal Year Ended | ||||||||||||
| October 3, 2020 |
September 28, 2019 |
September 29, 2018 |
||||||||||
| Net income |
$ | 58,561 | $ | 702 | $ | 17,126 | ||||||
| Interest expense |
84,098 | 98,578 | 91,656 | |||||||||
| Income tax expense |
2,627 | 14,855 | 4,926 | |||||||||
| Depreciation and amortization expenses(a) |
28,925 | 30,424 | 31,611 | |||||||||
| Loss on disposition of assets(b) |
785 | 1,751 | 1,057 | |||||||||
| Management fee(c) |
4,900 | 4,533 | 3,223 | |||||||||
| Equity-based compensation expense(d) |
1,785 | 2,130 | 1,785 | |||||||||
| Mark-to-market on interest rate cap(e) |
22 | 4,288 | (3,045 | ) | ||||||||
| Other(f) |
1,067 | 2,742 | 3,460 | |||||||||
|
|
|
|
|
|
|
|||||||
| Adjusted EBITDA |
$ | 182,770 | $ | 160,003 | $ | 151,799 | ||||||
|
|
|
|
|
|
|
|||||||
| Fiscal Year Ended | ||||||||||||
| October 3, 2020 |
September 28, 2019 |
September 29, 2018 |
||||||||||
| Net income |
$ | 58,561 | $ | 702 | $ | 17,126 | ||||||
| Loss on disposition of assets(b) |
785 | 1,751 | 1,057 | |||||||||
| Management fee(c) |
4,900 | 4,533 | 3,223 | |||||||||
| Equity-based compensation expense(d) |
1,785 | 2,130 | 1,785 | |||||||||
| Mark-to-market on interest rate cap(e) |
22 | 4,288 | (3,045 | ) | ||||||||
| Other(f) |
1,067 | 2,742 | 3,460 | |||||||||
| Tax effects of these adjustments(g) |
(2,147 | ) | (3,381 | ) | (206 | ) | ||||||
|
|
|
|
|
|
|
|||||||
| Adjusted net income |
$ | 64,973 | $ | 12,765 | $ | 23,400 | ||||||
|
|
|
|
|
|
|
|||||||
| (a) | Includes depreciation related to our distribution centers and stores, which is included within the cost of merchandise and services sold line item in our consolidated statements of operations. |
| (b) | Consists of loss on disposition of assets associated with store closures or the sale of property and equipment. |
| (c) | Represents amounts paid or accrued in connection with our management services agreement. The management services agreement terminated upon the completion of our IPO. |
| (d) | Represents non-cash charges related to equity-based compensation. |
| (e) | Includes non-cash charges related to the change in fair value of our interest rate cap agreements. |
| (f) | Other non-recurring, non-cash or discrete items as determined by management, such as transaction related costs, personnel-related costs, legal expenses, strategic project costs, and miscellaneous costs. |
| (g) | Represents the tax effect of the total adjustments based on our statutory tax rate for each fiscal year. |
Factors Affecting the Comparability of our Results of Operations
Our results over the past three years have been affected by, among other events, the following events, which must be understood in order to assess the comparability of our period-to-period financial performance and condition.
Impact of COVID-19
We are closely monitoring the impact of COVID-19 on all aspects of our business and in all of our locations. As of October 3, 2020, we operated 936 locations in 37 states and all locations are currently
49
open. During the twelve months ended October 3, 2020, we maintained operations in nearly all of our markets as an ‘essential’ business, as defined by various federal, state, and local authorities, by providing essential products and services that maintain the safety and sanitization of homes and businesses. Certain of our locations were temporarily closed or restricted to curbside service only. These closures and restrictions did not have a material impact on our performance during the twelve months ended October 3, 2020. We remain committed to supporting federal, state, and local mandates to prevent the spread of COVID-19 while we operate our business and to do our part in protecting public health.
We help keep our communities safe from serious public health risks by providing essential products and services. Water that is not properly maintained can serve as a breeding ground for potentially fatal bacteria and viruses.
As a business, the health and safety of our consumers, communities, and associates remain our highest priority, and we continue to take all precautions recommended by the Centers for Disease Control and Prevention to ensure their safety and well-being. We have proactively implemented extensive measures in response to COVID-19 throughout our business operations, including:
| • | Required team members who are experiencing symptoms or have been in close contact with someone who has symptoms or has been exposed to the coronavirus to stay home; |
| • | Improved employee benefits related to COVID-19 conditions; |
| • | Distributed personal protective equipment and implemented temperature monitoring protocols, including the installation of contactless temperature scanners in our corporate offices and distribution centers; |
| • | Enhanced facility cleaning including routine sanitization of high touch surfaces; |
| • | Implemented social distancing guidelines and capacity restrictions in our locations and reduced operating hours; |
| • | Encouraged contactless payments and introduced curbside pickup and contact-free service calls; |
| • | Incurred front line recognition pay for associates in our locations, distribution centers, and service technicians during the third and fourth quarters of 2020; |
| • | Executed remote workforce plan for associates in our corporate offices; and |
| • | Enacted mandatory travel restrictions. |
We have also closely coordinated with our vendor partners to minimize the impact of supply disruptions and maintain the flow of essential products to meet the elevated demand from consumers in the current environment. The full impact of COVID-19 on our financial and operating performance will depend significantly on the duration and severity of the pandemic, the actions taken to contain or mitigate its impact, and the change in consumer behaviors. It is not possible to predict the likelihood, timing, or severity of the aforementioned direct and indirect impacts of COVID-19 on our business. We may further restrict the operations of our locations and distribution facilities and these measures could have a material impact on our sales and earnings. COVID-19 could also lead to significant disruption to our supply chain for products we sell and could have a material impact on our sales and earnings.
Business Acquisitions
In January 2018, we acquired a provider of supplies and services for swimming pools, spas, and above ground pools, and related equipment. The acquisition included five locations in Pennsylvania.
50
In May 2018, we acquired a pool and spa parts distributor headquartered in Tucson, Arizona. The acquisition included inventory and assets at facilities located in Arizona and Tennessee.
In January 2019, we acquired a provider of supplies and services for swimming pools, spas, barbecues, and fireplaces based in Washington. The acquisition included nine locations in the Pacific Northwest and expanded our physical presence to 36 states.
In October 2019, we acquired a provider of supplies and services for spas, swim spas, and saunas based in Oregon. The acquisition included six locations in the Pacific Northwest and expanded our physical presence to 37 states.
The consolidated financial statements include the results of operations of the acquisitions since their respective acquisition dates. The acquisitions did not have a material impact on our financial position or results of operations, either individually or in the aggregate. The total purchase consideration was allocated to the assets acquired and liabilities assumed at their estimated fair values as of the date of acquisition, as determined by management. The excess of the purchase price over the amounts allocated to assets acquired and liabilities assumed has been recorded as goodwill.
Incremental Public Company Expenses
As a newly public company we will incur significant expenses on an ongoing basis that we did not incur as a private company. Those costs include additional director and officer liability insurance expenses, as well as third-party and internal resources related to accounting, auditing, Sarbanes-Oxley Act compliance, legal, and investor and public relations expenses. These costs will generally be expensed under SG&A in the consolidated statement of operations.
Results of Operations
The following tables summarize key components of our results of operations for the periods indicated, both in dollars and as a percentage of our sales.
51
We derived the consolidated statements of operations for fiscal year 2020, fiscal year 2019 and fiscal year 2018 from our consolidated financial statements. Our historical results are not necessarily indicative of the results that may be expected in the future.
| Results of Operations | ||||||||||||
| Fiscal Year Ended | ||||||||||||
| (dollars in thousands, except per share amounts) | October 3, 2020 |
September 28, 2019 |
September 29, 2018 |
|||||||||
| Statement of operations data: |
||||||||||||
| Sales |
$ | 1,112,229 | $ | 928,203 | $ | 892,600 | ||||||
| Cost of merchandise and services sold |
651,516 | 548,463 | 535,464 | |||||||||
|
|
|
|
|
|
|
|||||||
| Gross profit |
460,713 | 379,740 | 357,136 | |||||||||
| Selling, general and administrative expenses |
314,338 | 258,152 | 241,669 | |||||||||
|
|
|
|
|
|
|
|||||||
| Operating income |
146,375 | 121,588 | 115,467 | |||||||||
| Other expense: |
||||||||||||
| Interest expense |
84,098 | 98,578 | 91,656 | |||||||||
| Other expenses, net |
1,089 | 7,453 | 1,759 | |||||||||
|
|
|
|
|
|
|
|||||||
| Total other expense |
85,187 | 106,031 | 93,415 | |||||||||
| Income before taxes |
61,188 | 15,557 | 22,052 | |||||||||
| Income tax expense |
2,627 | 14,855 | 4,926 | |||||||||
|
|
|
|
|
|
|
|||||||
| Net income |
$ | 58,561 | $ | 702 | $ | 17,126 | ||||||
|
|
|
|
|
|
|
|||||||
| Percentage of Sales(1) | (%) | (%) | (%) | |||||||||
|
|
|
|
|
|
|
|||||||
| Sales |
100.0 | 100.0 | 100.0 | |||||||||
| Cost of merchandise and services sold |
58.6 | 59.1 | 60.0 | |||||||||
|
|
|
|
|
|
|
|||||||
| Gross Margin |
41.4 | 40.9 | 40.0 | |||||||||
| Selling, general and administrative expenses |
28.3 | 27.8 | 27.1 | |||||||||
|
|
|
|
|
|
|
|||||||
| Operating income |
13.2 | 13.1 | 12.9 | |||||||||
| Interest expense |
7.6 | 10.6 | 10.3 | |||||||||
| Other expenses, net |
0.1 | 0.8 | 0.1 | |||||||||
| Total other expense |
7.7 | 11.4 | 10.5 | |||||||||
| Income before taxes |
5.5 | 1.7 | 2.5 | |||||||||
| Income tax expense |
0.2 | 1.6 | 0.6 | |||||||||
|
|
|
|
|
|
|
|||||||
| Net income |
5.3 | 0.1 | 1.9 | |||||||||
|
|
|
|
|
|
|
|||||||
| Other financial and operations data: |
||||||||||||
| Number of new and acquired locations |
10 | 28 | 38 | |||||||||
| Number of locations open at end of period |
936 | 952 | 940 | |||||||||
| Comparable sales growth(2) |
18.0 | % | 0.4 | % | (1.3 | )% | ||||||
| Adjusted EBITDA(3) |
$ | 182,770 | $ | 160,003 | $ | 151,799 | ||||||
| Adjusted EBITDA as a percentage of sales(3) |
16.4 | % | 17.2 | % | 17.0 | % | ||||||
| Adjusted net income(3) |
$ | 64,973 | $ | 12,765 | $ | 22,927 | ||||||
| Adjusted net income per share |
$ | 0.42 | $ | 0.08 | $ | 0.15 | ||||||
| (1) | Components may not add to totals due to rounding. |
| (2) | See the section titled “Management’s Discussion and Analysis of Financial Condition and Results of Operations—Key Factors and Measures We Use to Evaluate Our Business.” |
| (3) | See the section titled “Management’s Discussion and Analysis of Financial Condition and Results of Operations—Key Factors and Measures We Use to Evaluate Our Business” for a reconciliation from our net income to adjusted EBITDA and net income to adjusted net income. |
52
Fiscal Year 2020 Compared to Fiscal Year 2019
Impact of 53rd week
Fiscal year 2020 included a 53rd week, which added approximately $18.0 million in sales, $1.5 million in net income, and $3.0 million in adjusted EBITDA.
Sales
Sales increased to $1,112.2 million in fiscal year 2020 from $928.2 million in fiscal year 2019, an increase of $184.0 million or 19.8%. The increase was the result of a comparable sales increase of 18.0% and non-comparable sales growth primarily attributable to acquisitions and the 53rd week. The comparable sales increase of $163.3 million in fiscal year 2020 was driven by an increase in consumer demand across all product categories due to higher use of residential pools and spas. We believe that COVID-19 has accelerated secular trends in consumer behavior and has favorably impacted our sales. While the duration and effects of the COVID-19 pandemic are uncertain, we anticipate that the changes in consumer behavior will continue for the foreseeable future.
Gross Profit and Gross Margin
Gross profit increased to $460.7 million in fiscal year 2020 from $379.7 million in fiscal year 2019, an increase of $81.0 million or 21.3%. Gross profit increased by $72.4 million related to higher comparable sales and by $8.8 million related to higher non-comparable sales, and was partially offset by $0.2 million in higher occupancy expenses. Gross margin increased to 41.4% in fiscal year 2020 compared to 40.9% in fiscal year 2019, an increase of 51 basis points.
Selling, General and Administrative Expenses
SG&A increased to $314.3 million in fiscal year 2020 from $258.2 million in fiscal year 2019, an increase of $56.2 million or 21.8%. The increase in SG&A was primarily driven by increased costs related to higher sales volume of $20.6 million, higher compensation expense of $10.9 million, expenses associated with COVID-19 of $8.6 million for temporary wage increases and personal protective equipment, expenses related to strategic consolidations of certain locations of $3.5 million, one-time bonus incentive accruals of $2.9 million, and higher general and administrative expenses of $9.7 million partially driven by higher investments in leadership and information technology. As a percentage of sales, SG&A increased to 28.3% in fiscal year 2020 compared to 27.8% in fiscal year 2019, an increase of 45 basis points.
Total Other Expense
Total other expense decreased to $85.2 million in fiscal year 2020 from $106.0 million in fiscal year 2019, a decrease of $20.8 million. The decrease in fiscal year 2020 was primarily driven by lower interest expense on our floating rate debt of $14.5 million, a reduction in fair market valuation adjustments related to our interest rate cap agreements of $4.3 million, and a reduction of other expenses of $2.0 million.
Income Taxes
We recorded an income tax expense of $2.6 million in fiscal year 2020 and an expense of $14.9 million in fiscal year 2019, a decrease of $12.2 million. The change in income tax expenses was the result of higher pre-tax income during fiscal year 2020 and was more than offset by the impact of limitations on interest expense deductibility in accordance with section 163(j) of the Tax Cuts and Jobs Act of 2017 in each period.
53
Net Income and Net Income per Share
Consequently, net income increased to $58.6 million in fiscal year 2020 from an income of $0.7 million in fiscal year 2019, an increase of $57.9 million. Net income per share increased to $0.37 in fiscal year 2020 from a net income per share of $0.00 in fiscal year 2019.
Adjusted EBITDA
Adjusted EBITDA increased to $182.8 million in fiscal year 2020 from $160.0 million in fiscal year 2019, an increase of $22.8 million or 14.2%. The increase is due primarily to our increase in comparable sales and an improvement in gross margin. Adjusted EBITDA as a percentage of sales decreased to 16.4% in fiscal year 2020 compared to 17.2% in fiscal year 2019, a decrease of 81 basis points.
Adjusted Net Income and Adjusted Net Income per Share
Adjusted net income increased to $65.0 million in fiscal year 2020 from an adjusted net income of $12.8 million in fiscal year 2019, an increase of $52.2 million. Adjusted net income per share increased to $0.42 in fiscal year 2020 from an adjusted net income per share of $0.08 in fiscal year 2019.
Fiscal Year 2019 Compared to Fiscal Year 2018
Sales
Sales increased to $928.2 million in fiscal year 2019 from $892.6 million in fiscal year 2018, an increase of $35.6 million or 4.0%. This increase was driven primarily by a $31.9 million increase related to non-comparable sales related to acquisitions and higher comparable sales of $3.7 million. Comparable sales increased by 0.4% in fiscal year 2019 when compared to the prior year.
Gross Profit and Gross Margin
Gross profit increased to $379.7 million in fiscal year 2019 from $357.1 million in fiscal year 2018, an increase of $22.6 million or 6.3%. Gross profit increased by $18.0 million related to higher comparable sales and by $8.8 million related to higher non-comparable sales. The increase in gross profit was partially offset by higher occupancy expenses of $2.6 million and higher distribution expenses of $1.6 million. Gross margin increased to 40.9% in fiscal year 2019 compared to 40.0% in fiscal year 2018, an increase of 90 basis points.
Selling, General and Administrative Expenses
SG&A increased to $258.2 million in fiscal year 2019 from $241.7 million in fiscal year 2018, an increase of $16.5 million or 6.8%. The increase in SG&A was primarily driven by costs related to higher sales volume of $8.8 million, higher compensation expense of $5.2 million, and higher corporate support expenses of $2.5 million. As a percentage of sales, SG&A increased to 27.8% in fiscal year 2019 compared to 27.1% in fiscal year 2018, an increase of 74 basis points.
Total Other Expense
Total other expense increased to $106.0 million in fiscal year 2019 from $93.4 million in fiscal year 2018, an increase of $12.6 million. The increase was primarily driven by higher interest expense on our floating rate debt of $6.9 million, the impact related to the change in fair value of our interest rate cap agreements of $7.3 million, and partially offset by lower other expenses of $1.6 million.
54
Income Taxes
Income tax expense increased to $14.9 million in fiscal year 2019 from $4.9 million in fiscal year 2018. The increase in income tax expense and the effective tax rate is related to a higher valuation allowance recorded in the current year due to limitations on interest expense deductibility in accordance with section 163(j) of the Tax Cuts and Jobs Act of 2017. As of September 28, 2019 and September 29, 2018, we recorded a deferred tax asset of $17.9 million and $5.7 million, respectively, and a valuation allowance of $16.8 million and $5.7 million, respectively, related to our interest expense limitation.
Net Income and Net Income per Share
Consequently, net income decreased to $0.7 million in fiscal year 2019 from $17.1 million in fiscal year 2018, a decrease of $16.4 million. Net income per share decreased to $0.00 in fiscal year 2019 compared to $0.11 in fiscal year 2018.
Adjusted EBITDA
Adjusted EBITDA increased to $160.0 million in fiscal year 2019 compared to $151.8 million in fiscal year 2018, an increase of $8.2 million or 5.4%. The increase in adjusted EBITDA primarily related to the incremental sales associated with an increase in our non-comparable sales and an improvement in gross margin. Adjusted EBITDA as a percentage of sales increased to 17.2% in fiscal year 2019 compared to 17.0% in fiscal year 2018, an increase of 23 basis points.
Adjusted Net Income and Adjusted Net Income Per Share
Adjusted net income decreased to $12.8 million in fiscal year 2019 compared to $23.4 million in fiscal year 2018, a decrease of $10.1 million. Adjusted net income per share decreased to $0.08 in fiscal year 2019 compared to $0.15 in fiscal year 2018.
Seasonality and Quarterly Fluctuations
Our business is highly seasonal. In general, sales and earnings are highest during our fiscal year third and fourth quarters, which include April through September and represent the peak months of swimming pool use. In fiscal year 2020, we generated 77% of our sales and 109% of our adjusted EBITDA in the third and fourth quarters of our fiscal year. Sales are substantially lower during our fiscal first and second quarters. We have a long track record of investing in our business throughout the year, including in operating expenses, working capital, and capital expenditures related to new locations and other growth initiatives. While these investments drive performance during the primary selling season in our third and fourth fiscal quarters, they have a negative impact during our first and second fiscal quarters.
We experience a build-up of inventory and accounts payable during the fiscal first and second quarters of the year in anticipation of the peak swimming pool supply selling season. We negotiate extended payment terms with certain of our primary suppliers as we receive merchandise in December through March and we pay for merchandise in April through July. As a result of lower sales volumes during our fiscal first and second quarters, we reach peak borrowing during our fiscal second quarter.
The principal external factor affecting our business is weather. Hot weather can increase purchases of chemicals and other non-discretionary products, purchases of discretionary products, and can drive increased activity around installation and repair services we offer. Unseasonably cool weather or significant amounts of rainfall during the peak sales season can reduce chemical
55
consumption in pools and spas and decrease consumer purchases of our products and services. In addition, unseasonably early or late warming trends can increase or decrease the length of the pool season and impact timing around pool openings and closings and, therefore, our total sales and timing of our sales.
We generally open new locations before our peak selling season begins and we close locations after our peak selling season ends. We expect that our quarterly results of operations will fluctuate depending on the timing and amount of sales contributed by new locations.
Liquidity and Capital Resources
Overview
Our primary sources of liquidity are net cash provided by operating activities and availability under our ABL Credit Facility. Historically, we have funded working capital requirements, capital expenditures, payments related to acquisitions, and debt service requirements with internally generated cash on hand and through our ABL Credit Facility.
Cash and cash equivalents consist primarily of cash on deposit with banks. Cash and cash equivalents totaled $157.1 million as of October 3, 2020, $90.9 million as of September 28, 2019, and $77.6 million as of September 29, 2018. As of October 3, 2020, September 28, 2019, and September 29, 2018, we did not have any outstanding borrowings under our ABL Credit Facility. On August 13, 2020, we entered into an agreement to amend our ABL Credit Facility to extend the final maturity to August 13, 2025 and increase our borrowing capacity to $200 million, subject to certain restrictions.
Our primary working capital requirements are for the purchase of inventory, payroll, rent, other facility costs, distribution costs, and general and administrative costs. Our working capital requirements fluctuate during the year, driven primarily by seasonality and the timing of inventory purchases.
Our capital expenditures are primarily related to infrastructure-related investments, including investments related to upgrading and maintaining our information technology systems, ongoing location improvements, expenditures related to our distribution centers, and new location openings. We expect to fund capital expenditures from net cash provided by operating activities.
Based on our growth plans, we believe our cash and cash equivalents position, net cash provided by operating activities and availability under our ABL Credit Facility will be adequate to finance our working capital requirements, planned capital expenditures, and debt service over the next 12 months. In the future, we may also allocate capital toward additional strategic acquisitions. If cash provided by operating activities and borrowings under our ABL Credit Facility are not sufficient or available to meet our capital requirements, then we will be required to obtain additional equity or debt financing in the future. There can be no assurance equity or debt financing will be available to us if we need it or, if available, the terms will be satisfactory to us.
As of October 3, 2020, outstanding standby letters of credit totaled $11.6 million and, after considering borrowing base restrictions, we had $125.5 million of available borrowing capacity under the terms of the ABL Credit Facility. As of October 3, 2020, we were in compliance with the covenants under the ABL Credit Facility, the Term Loan, and the Senior Unsecured Notes.
56
Summary of Cash Flows
A summary of our cash flows from operating, investing, and financing activities is presented in the following table (in thousands):
| Fiscal Year Ended | ||||||||||||
| October 3, 2020 |
September 28, 2019 |
September 29, 2018 |
||||||||||
| Net cash provided by operating activities |
$ | 103,409 | $ | 57,821 | $ | 43,280 | ||||||
| Net cash used in investing activities |
(26,811 | ) | (36,996 | ) | (40,219 | ) | ||||||
| Net cash used in financing activities |
(10,425 | ) | (7,495 | ) | (24,386 | ) | ||||||
|
|
|
|
|
|
|
|||||||
| Net increase (decrease) in cash and cash equivalents |
$ | 66,173 | $ | 13,330 | $ | (21,325 | ) | |||||
|
|
|
|
|
|
|
|||||||
Cash Provided by Operating Activities
Net cash provided by operating activities increased to $103.4 million in fiscal year 2020 from $57.8 million in fiscal year 2019, an increase of $45.6 million or 78.8%. The increase was primarily driven by a $57.9 million increase in net income, a $2.8 million decrease related to changes in operating assets and liabilities, and a decrease in non-cash adjustments of $9.5 million. The changes in operating assets and liabilities was driven by changes in working capital, including an increase in accounts payable and accrued expenses primarily related to compensation expense accruals and payment timing for other expenses, lower inventories resulting from higher sales volume in the current year period, lower accounts receivable related to reduced commercial account activity and improved collection of vendor receivables. The increase in cash flows related to working capital was partially offset by an increase in prepaid expenses related to our capitalized cloud computing arrangements with certain vendors, and an increase in income tax payable. The increase in non-cash adjustments primarily related to a change in deferred income taxes.
Net cash provided by operating activities increased to $57.8 million in fiscal year 2019 from $43.3 million in fiscal year 2018, an increase of $14.5 million or 33.6%. The increase was primarily driven by a $33.3 million increase related to changes in operating assets and liabilities and partially offset by a $16.4 million decrease in net income. The changes in operating assets and liabilities were driven by changes in by working capital, including an increase in accounts payable and accrued expenses primarily related to compensation expense accruals and payment timing of rent and other expenses, and an increase in income tax payable.
Cash Used in Investing Activities
Net cash used in investing activities decreased to $26.8 million in fiscal year 2020 from $37.0 million in fiscal year 2019, a decrease of $10.2 million. The decrease in net cash used in investing activities relates to fewer new locations and a reduction in investments related to acquisitions in the current year period. Our net cash used in investing activities related to the acquisitions included $6.2 million in fiscal year 2020 and $9.6 million in fiscal year 2019.
Net cash used in investing activities decreased to $37.0 million for fiscal year 2019 from $40.2 million for fiscal year 2018, a decrease of $3.2 million. The decrease in net cash used in investing activities relates to fewer new locations and a reduction in investments related to the acquisitions in the current year period. Our net cash used in investing activities related to acquisitions included $9.6 million in fiscal year 2019 and $11.8 million in fiscal year 2018.
57
Cash Used in Financing Activities
Net cash used in financing activities increased to $10.4 million in fiscal year 2020 from $7.5 million for fiscal year 2019, an increase of $2.9 million. The increase in net cash used in financing related to an increase of $4.2 million of mandatory payments on our Term Loan offset by a decrease of $1.2 million in payments of declared dividends. Net cash used in financing activities during the periods primarily relates to mandatory payments on our Term Loan.
Net cash used in financing activities decreased to $7.5 million for fiscal year 2019 from $24.4 million for fiscal year 2018, a decrease of $16.9 million. The decrease in net cash used in 2019 is primarily the result of fewer mandatory payments on our Term Loan during year.
Contractual Obligations and Other Commitments
The following table summarizes our contractual cash obligations as of October 3, 2020:
| Payments Due By Period | ||||||||||||||||||||||||||||
| (in millions) |
Total | 2021 | 2022 | 2023 | 2024 | 2025 | Thereafter | |||||||||||||||||||||
| Term Loan |
$ | 811.1 | $ | 8.3 | $ | 8.3 | $ | 794.5 | $ | — | $ | — | $ | — | ||||||||||||||
| Senior Unsecured Notes |
390.0 | — | — | — | 390.0 | — | — | |||||||||||||||||||||
| Purchase commitments(1) |
340.5 | 112.6 | 70.9 | 67.2 | 50.2 | 33.9 | 5.7 | |||||||||||||||||||||
| Operating lease obligations(2) |
243.2 | 68.0 | 59.1 | 46.9 | 34.0 | 19.9 | 15.3 | |||||||||||||||||||||
| Letters of credit |
11.6 | 11.6 | — | — | — | — | — | |||||||||||||||||||||
| ABL Credit Facility(3) |
4.7 | 0.8 | 0.8 | 0.8 | 0.8 | 0.8 | 0.7 | |||||||||||||||||||||
|
|
|
|
|
|
|
|
|
|
|
|
|
|
|
|||||||||||||||
| Total |
$ | 1,801.1 | $ | 201.3 | $ | 139.1 | $ | 909.4 | $ | 475.0 | $ | 54.6 | $ | 21.7 | ||||||||||||||
|
|
|
|
|
|
|
|
|
|
|
|
|
|
|
|||||||||||||||
| (1) | Purchase obligations include all legally binding contracts and primarily relate to firm commitments for inventory purchases. Purchase orders that are not binding agreements are excluded from the table above. |
| (2) | Operating lease obligations relate to our stores, office, distribution, and manufacturing facilities. All of these obligations require cash payments to be made by us over varying periods of time. Certain leases are renewable at our option for periods of one to ten years and certain of these arrangements are cancelable on short notice while others require payments upon early termination. |
| (3) | We are required to pay a commitment fee of 0.375% based on the unused portion of the ABL Credit Facility. |
Off-Balance Sheet Arrangements
We did not have any off-balance sheet arrangements as of October 3, 2020.
Critical Accounting Policies and Estimates
Our consolidated financial statements have been prepared in accordance with GAAP. The preparation of our consolidated financial statements and notes to consolidated financial statements requires us to make estimates that affect the reported amounts of assets, liabilities, sales and expenses, and related disclosures of contingent assets and liabilities. We base these estimates on historical results and various other assumptions believed to be reasonable, all of which form the basis for making estimates concerning the carrying values of assets and liabilities that are not readily available from other sources. Actual results may differ from these estimates.
58
Our significant accounting policies are described in Note 2 to our consolidated financial statements included elsewhere in this prospectus. We believe that the following critical accounting policies affect the most significant estimates and management judgments used in preparing the consolidated financial statements.
Vendor Rebates
Many of our vendor arrangements provide for us to receive specified amounts of consideration when we achieve various measures. These measures generally relate to the volume of purchases from our vendors. We account for vendor rebates as a reduction of the cost of product and therefore a reduction of inventory until we sell the product, at which time we recognize such consideration as a reduction of cost of merchandise and services sold. For certain arrangements, we estimate the amount earned based on our latest projection of total purchases. We update our estimates each period to reflect actual purchase levels and any changes to our projection of total purchases.
Goodwill and Other Intangibles
We review goodwill and indefinite-lived intangible assets for impairment annually or on an interim basis whenever events or changes in circumstances indicate the fair value of such assets may be below their carrying amount.
For goodwill, we may first make a qualitative assessment of whether it is more likely than not that a reporting unit’s fair value is less than its carrying value. The qualitative impairment assessment includes considering various factors including macroeconomic conditions, industry and market conditions, cost factors, and any reporting unit specific events. If it is determined through the qualitative assessment that the reporting unit’s fair value is more likely than not greater than its carrying value, the quantitative impairment assessment is not required. If the qualitative assessment indicates it is more likely than not that the reporting unit’s fair value is not greater than its carrying value, we must perform a quantitative impairment assessment. If it is determined a quantitative assessment is necessary, we would compare the fair value of the reporting unit to the respective carrying value, which includes goodwill. If the fair value of the reporting unit exceeds its carrying value, goodwill is not considered impaired. If the carrying value is higher than the fair value, the difference would be recognized as an impairment loss.
Similar to our test for impairment of goodwill, we may first make a qualitative assessment of whether it is more likely than not that an indefinite-lived intangible assets’ fair value is less than its carrying value to determine whether it is necessary to perform a quantitative impairment assessment. If it is determined a quantitative assessment is necessary, we would compare their estimated fair values to their carrying values. We would recognize an impairment charge when the estimated fair value of the indefinite-lived intangible asset is less than its carrying value. We annually evaluate whether the trade names continue to have an indefinite life.
Income Taxes
We account for income taxes under the asset and liability method, which requires the recognition of deferred tax assets and liabilities for the future tax consequences attributable to differences between the financial statement carrying amounts and tax bases of existing assets and liabilities. Deferred tax assets, including the benefit of net operating loss and tax credit carryforwards, are evaluated based on the guidelines for realization and are reduced by a valuation allowance if it is deemed more likely than not that such assets will not be realized. We consider several factors in evaluating the realizability of our deferred tax assets, including the nature, frequency and severity of recent losses, the remaining years available for carryforwards, changes in tax laws, the future profitability of the operations in the jurisdiction, and tax planning strategies.
59
The ultimate realization of deferred tax assets can be dependent upon the generation of future taxable income during the periods in which the associated temporary differences became deductible. On a quarterly basis, we evaluate whether it is more likely than not that our deferred tax assets will be realized in the future and conclude whether a valuation allowance must be established.
Self-Insurance
We are self-insured for certain losses related to health, workers’ compensation and general liability insurance, although we maintain stop-loss coverage with third-party insurers to limit our liability exposure. Liabilities associated with these losses are estimated in part by considering historical claim experience, industry factors, severity factors and other assumptions. We review and update these reserves on a quarterly basis.
Inventory Valuation
Inventories consist of merchandise held for sale and are stated at the lower of cost or net realizable value. When evidence exists that the net realizable value of inventory is lower than its cost, the difference is recorded in cost of merchandise and services sold in our consolidated statement of operations as a loss in the period in which it occurs. We provide provisions for losses related to inventories based on historical purchase cost, selling price, margin, and current business trends. The estimates have calculations that require us to make assumptions based on the current rate of sales, age, salability of inventory, and profitability of inventory, all of which may be affected by changes in our merchandising mix and consumer preferences. We do not believe there is a reasonable likelihood that there will be a material change in the assumptions we use to calculate our inventory provisions. However, if actual results are not consistent with our estimates and assumptions, we may be exposed to losses or gains that could be material. We review and update these reserves on a quarterly basis.
Recent Accounting Pronouncements
For information regarding recent accounting pronouncements, see Note 2 to our consolidated financial statements.
Quantitative and Qualitative Disclosures About Market Risk.
Interest Rate Risk
Our operating results are subject to risk from interest rate fluctuations on our borrowings, which carry variable interest rates. Our borrowings include our ABL Credit Facility, Term Loan, and Senior Unsecured Notes. Our ABL Credit Facility provides for revolving loans of up to $200.0 million, with a sub-commitment for issuance of letters of credit of $25.0 million. Because our borrowings bear interest at a variable rate, we are exposed to market risks relating to changes in interest rates. As of October 3. 2020, we had $811.2 million and $390.0 million of outstanding variable rate loans outstanding under our Term Loan and Senior Unsecured Notes, respectively, and no outstanding variable rate debt under our ABL Credit Facility. In conjunction with our IPO all of our obligations related to the Senior Unsecured Notes have been settled. Based on the outstanding variable rate loan balances for the Term Loan and ABL Credit Facility an increase or decrease of 1% in the effective interest rate would cause an increase or decrease in interest cost of approximately $8.1 million over the next 12 months. We have entered into interest rate cap agreements to manage interest rate risk. Such agreements cap the borrowing rate on variable debt to provide a hedge against the risk of rising rates. At October 3, 2020, September 28, 2019, and September 29, 2018, we had two interest rate cap agreements with total notional amount of $750 million (the “Cap Agreements”) to mitigate the impact of fluctuations in
60
the three-month LIBOR and effectively cap the LIBOR applicable to our variable rate debt at a rate of 3.00%. The four-year Cap Agreements reset and settle quarterly through March 31, 2021. Fluctuations in the market value of the Cap Agreements are recorded in “Other income and expenses” on our Consolidated Statements of Operations.
Impact of Inflation
Our results of operations and financial condition are presented based on historical cost. We actively manage the impact of inflation, including tariffs, through strong relationships with our diverse supplier base, vendor negotiation, and price and promotion management. We also strategically invest through inventory purchases in order to obtain favorable pricing ahead of any vendor price increases. As a result, we believe we have an ability to substantially mitigate negative impacts of inflation.
61
Our Mission
We are committed to continuing our legacy as the most trusted authority in pool and spa care. Through our consumer-centric approach, we provide an unparalleled experience for all consumers across all channels, supported by leading product innovation, expert knowledge, and exceptional service.
Our Company
We are the largest and most trusted direct-to-consumer brand in the nearly $11 billion U.S. pool and spa care industry, serving residential, professional, and commercial consumers. Founded in 1963, we are the only direct-to-consumer pool and spa care brand with national scale, operating an integrated marketing and distribution ecosystem powered by a physical network of 936 branded locations and a robust digital platform. We command a market-leading share of nearly 15% of residential aftermarket product spend as of 2019, which represents an increase of approximately 500 basis points since 2010, our physical network is larger than the sum of our twenty largest competitors, and our digital sales are estimated to be greater than five times as large as that of our largest digital competitor. We offer an extensive assortment of professional-grade products, the majority of which are exclusive to Leslie’s, as well as certified installation and repair services, all of which are essential to the ongoing maintenance of pools and spas. Our dedicated team associates, pool and spa care experts, and experienced service technicians are passionate about empowering our consumers with the knowledge, products, and solutions necessary to confidently maintain and enjoy their pools and spas. Over the last five years, we have spent more than $70 million in foundational investments across new technologies and capabilities focused on transforming our consumer experience and advancing our industry leadership. The unprecedented scale of our integrated marketing and distribution ecosystem, which is powered by our direct-to-consumer network, uniquely enables us to efficiently reach and service every pool and spa in the continental United States—capabilities no competitor can match.
62
The aftermarket pool and spa care industry is one of the most fundamentally attractive consumer categories given its scale, predictability, and growth outlook. Since 1970, when industry market data was first collected, the market has demonstrated consistent growth due to the non-discretionary nature of ongoing water treatment to maintain safe, sanitized water. Without proper ongoing maintenance, water quality quickly degrades, yielding unsafe conditions and risking equipment failure. As a result, each pool and spa represents an annuity-like stream of chemical, equipment, and service revenue for their average life span of over 25 years. We estimate the average in-ground pool owner spends $24,000 or more on maintenance products and services over the life of a pool. According to P.K. Data, the U.S. market is comprised of a growing installed base of more than 14 million pools and spas. The industry generated revenue of nearly $11 billion and grew at a 3.8% CAGR from 2015 to 2019.
The industry is currently experiencing a significant increase in demand, as the COVID-19 pandemic has accelerated secular trends in consumer behavior. Consumers are increasingly focused on outdoor living, healthy lifestyles, sanitization and safety, migrating to lower density communities, and spending more time at home, all of which are fundamentally changing their spending patterns. In particular, the stay-at-home reality of the pandemic has led to significant growth in new pool installations and pool usage. Based on research performed by P.K. Data, new pool permit activity through July 2020 has grown by 32% over the comparable period in 2019 and is forecasted to achieve unprecedented year-over-year growth in new pool installations in 2020. This significant increase in new pool construction activity represents a permanent increase in demand for aftermarket products and services. Nearly 200,000 new in ground pools are expected to be constructed in 2020 and 2021, representing nearly $5 billion in estimated lifetime maintenance spend. While our business is not dependent on new pool construction, we believe we are uniquely positioned to capture a meaningful portion of the related aftermarket spend.
Given we play primarily in the aftermarket business, we have a highly predictable, recurring revenue model, which is evidenced by our 57 consecutive years of sales growth. More than 80% of our assortment is comprised of non-discretionary products essential to the care of residential and commercial pools and spas. Our assortment includes chemicals, equipment and parts, cleaning and maintenance equipment, and safety, recreational, and fitness-related products. We also offer important, essential services, such as equipment installation and repair for residential and commercial consumers. Consumers receive the benefit of extended vendor warranties when purchasing product through our locations or when our certified in-field technicians install or repair equipment on-site. We also offer complimentary, commercial-grade in-store water testing and analysis via our proprietary AccuBlue® system, which increases consumer engagement, conversion, basket size, and loyalty, resulting in higher lifetime value. Our water treatment expertise is powered by data and intelligence accumulated from the millions of water tests we have performed over our history, positioning us as the most trusted water treatment service provider in the industry. Due to the non-discretionary nature of our products and services, our business has historically delivered strong, uninterrupted growth and profitability in all market environments, including the Great Recession and the COVID-19 pandemic. Our growth has recently accelerated, and for fiscal year 2020, our sales increased 19.8%.
63
57 Years of Leadership and Disruptive Innovation in Pool & Spa Care
Since our founding in 1963, we have been the leading innovator in our category and have provided our consumers with the most advanced pool and spa care available. As we have scaled, we have leveraged our competitive advantages to strategically reinvest in our business and intellectual property to develop new value-added capabilities that allow us to meet the needs of any pool and spa owner, whether they care for their pool or spa themselves or rely on a professional, whatever the nature of their need may be, and however they wish to engage with us.
Legacy of Innovation
Over our 57-year history, we have introduced innovative ways to serve pool and spa owners and the professionals who care for their pools and spas.
Owned and Exclusive Brands. Since our inception in 1963, we have offered a portfolio of owned and exclusive brands. We continue to expand our selection of exclusive offerings through innovation, most recently with the launch of the Jacuzzi® and our RightFit® brands in 2016. Our exclusive brands and products account for approximately 55% of total sales and 80% of chemical sales. These proprietary brands and custom-formulated products are only available through our integrated platform and offer professional-grade quality to our consumers, while allowing us to achieve higher gross margins relative to sales of third-party products.
Complimentary and Proprietary Water Testing. We pioneered complimentary in-store water testing, and over the course of our history have conducted more than 40 million tests, which has helped us establish relationships, cultivate loyalty, and drive attractive lifetime value with our consumers as they rely on us for their water treatment needs. We have found that consumers who regularly test their water with us spend more with us per year than other consumers, and we believe that these consumers experience significantly fewer days where their pools are out of commission.
Complimentary In-Store Repair. We provide complimentary in-store equipment repair, which we offer to all consumers with the purchase of Leslie’s replacement parts. Over the last fifteen years, we have conducted more than one million in-store repairs.
In-Field Services. We employ the industry’s largest in-field service network, consisting of more than 200 pool and spa care service professionals who have the expertise to provide essential, on-site equipment installation and repair services for residential and commercial consumers throughout the continental United States.
64
Loyalty Program. In 2014, we launched the industry’s first loyalty program, which helps track loyalty members’ water treatment history and prescriptions and rewards them for shopping with us. As of October 3, 2020, our loyalty program has more than 3.3 million members, up more than 50% from 2.1 million active members as of September 2018. For the year ended October 3, 2020, our loyalty members generated more than 60% of our direct residential sales. Our loyalty members spend twice as much with us on average compared to our other consumers.
Professional Market. In 2015, we made the strategic decision to resource this channel and accelerate our sales growth to professional consumers. Through acquisitions, technology investments, and increased utilization of our integrated network, we drove a sales CAGR of over 20% through fiscal year 2020. Our differentiated go to market model includes 936 convenient locations including dedicated Leslie’s PRO locations in certain markets, extended operating hours, expansive product offering through our online platforms, multiple fulfillment capabilities, and the ability to provide pool professionals with referrals to residential consumers. Despite our strong growth, our penetration in the professional market remains modest with an estimated market share of less than 10%.
Leslie’s Evolution in the Digital World
Over the last five years, we have spent more than $70 million investing in new service offerings and digital capabilities that have modernized how consumers take care of their pools and spas.
Digital Network. We have built the largest digital presence in the industry. Our complementary platform of branded proprietary e-commerce websites and marketplace storefronts allows us to seamlessly serve the needs of all digital consumers through curated pricing and targeted merchandising strategies. In addition to our owned e-commerce websites, approximately 40% of our digital sales take place through online marketplaces. In all, our digital network is strategically designed to maximize total profitability. Our digital sales have grown at a CAGR of more than 35% between fiscal year 2015 and fiscal year 2020, and represented 26% of our total sales in fiscal year 2020, up from 8% in fiscal year 2015.
Mobile App. In 2018, we introduced a custom-designed mobile app that allows consumers to create a personalized pool profile, sync in-store prescriptions, and monitor the performance of at-home water tests. As of January 2021, the mobile app had more than one half million downloads and an average user rating of 4.6/5.0. We plan to continue enhancing this critical element of our network by introducing new features, including transaction capabilities.
Consumer-Centric Integrated Ecosystem. We architected a consumer-centric integrated ecosystem comprised of our physical network of 936 locations and a robust, data-driven digital platform. Over the last two years, we have invested in new capabilities, including global inventory visibility, buy online pick-up in store (“BOPIS”), buy online return in store (“BORIS”), and ship from store (“SFS”), each of which will come online in 2021. With our integrated physical and digital network, we will have the unique advantage of being able to reach all consumers in the continental United States in less than 24 hours, whether they are homeowners, pool and spa professionals, or commercial pool operators, whenever, wherever, and however they prefer to shop.
AccuBlue® Water Testing & Prescription Service. In January 2020, we launched our AccuBlue® in-store water testing device and enhanced water testing experience. AccuBlue®, which features exclusive and proprietary software that incorporates our 57 years of accumulated water treatment expertise, automates and gamifies the water testing experience, driving enhanced accuracy, higher throughput, greater consumer engagement, and increased consumer adherence to prescription
65
recommendations. Locations that have been equipped with AccuBlue® are growing sales at a faster rate than our other locations, supported by an increase in number of water tests performed, an improved conversion rate, and an increase in number of products prescribed per test which has resulted in greater units per transaction. In December 2020, we completed the rollout of AccuBlue® across our physical network.
Highly Experienced and Visionary Management Team. Over the last five years, we have built a diverse, multi-disciplinary management team to drive our consumer-first, digitally enabled growth. Since 2018, four of our eight senior leaders have joined our organization, bringing new expertise and capabilities that are highly complementary and synergistic with our core industry expertise that we have accumulated over decades.
Innovating the Future of Pool and Spa Care
As we look forward, we are committed to better serving our digital-first consumer by introducing an expanded portfolio of connected pool and spa products and services. We believe that we are uniquely positioned to leverage our market-leadership to continue to disrupt the pool and spa care category and further distance ourselves from our competition.
AccuBlue HomeTM Subscription. We are actively developing new technologies that seek to fundamentally change the way all consumers, whether a novice or an expert, care for their pools and spas. Through a new AccuBlue HomeTM subscription offering, we will leverage our proprietary water diagnostics software to convert on-demand test results into actionable prescriptions and treatment plans tailored to the specific size and conditions of a consumer’s pool or spa, which we can seamlessly and automatically fulfill through our integrated network.
Certified Pool Maintenance Offering. We are assembling a strategic network of qualified pool professionals to extend the Leslie’s brand into on-site water maintenance, completing our suite of service offerings in the residential pool ecosystem.
Ongoing R&D. We continue to leverage our intellectual property and differentiated strategic position to be the innovator and disruptor in our industry. We plan to strategically reinvest in our business and bring to market new products and services that will continue to improve our ability to serve our consumers and win in the marketplace. In addition to our internal efforts, as the most recognized and trusted authority in the industry with the most direct access and deepest relationships with pool and spa owners, we continue to receive unsolicited opportunities from third parties to introduce to the market and commercialize new products and services on an exclusive basis.
Recent Financial Performance
Our compelling financial profile is characterized by consistent growth, strong profitability, and high cash flow generation.
Comparing the fiscal year ended September 28, 2019 and fiscal year ended October 3, 2020, we achieved the following results:
| • | Increase in sales from $928.2 million to $1,122.2 million, representing year-over-year growth of 19.8%; |
| • | Comparable sales growth of 18.0% for the fiscal year ended October 3, 2020; |
| • | Increase in operating income from $121.6 million to $146.4 million, representing year-over-year growth of 20.4%; and |
66
| • | Increase in adjusted EBITDA from $160.0 million to $182.8 million, representing year-over-year growth of 14.2%. |
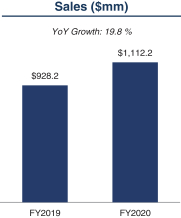
|
|
|
Fiscal year 2020 included a 53rd week. Please see the section titled “Management’s Discussion and Analysis of Financial Condition and Results of Operations” for an explanation of our fiscal calendar.
Our Competitive Strengths
We believe that the following competitive strengths have been key drivers of our success to date, and strategically position us for continued success.
Undisputed direct-to-consumer market leader in the aftermarket pool and spa care industry, with industry-leading brand recognition and loyalty.
For 57 years, we have been dedicated to addressing our consumers’ pool needs so they can spend less time maintaining and more time enjoying their pools. We are the only direct-to-consumer pool and spa care brand with a nationwide physical presence and an integrated digital platform, consisting of individually merchandised e-commerce websites, a mobile app with transaction capabilities, and online marketplace operations, is designed to address the needs of all pool and spa consumers. The remainder of the industry is highly fragmented across both offline and online providers. We command a market-leading share of nearly 15% of residential aftermarket product spend, which represents an increase of approximately 500 basis points since 2010, our physical network is larger than the sum of the next twenty largest competitors, and our digital sales are estimated to be greater than five times as large as that of our largest digital competitor. We measure the size of our physical network in terms of number of physical locations. Similarly, we calculate the sum of our twenty largest competitors as the sum of the number of physical locations operated by our competitors. Additionally, we estimate our share of digital sales to be greater than 60%.
We believe that our history, scale, and consumer-centric approach have contributed to industry-leading consumer affinity metrics. As a result of our consumer-centric approach, we have a Voice of Customer (VoC) score of approximately 75% based on our regular surveys of our consumer file, which demonstrates our consumers’ strong affinity for our brand.
Direct relationships with more than 11 million pool and spa owners and professionals, generating durable, annuity-like economics.
We are the largest national pool and spa care brand that has a direct relationship with pool and spa owners and the professionals who serve them. Across our integrated platform, we have a total file of approximately 11 million consumers. Through our team of highly trained pool and spa experts, we offer sophisticated product recommendations and other expert advice, which cultivates long-standing
67
relationships with our consumers. The comprehensive nature of our product and service offering eliminates the need for consumers to leave the Leslie’s ecosystem, driving exceptional retention with annuity-like economics. We define “direct relationships” as the number of unique customers for whom we have a mailing address, a phone number, or an email address.
In 2014, we launched our loyalty membership program to further deepen our consumer relationships. The program, which serves more than 3.3 million consumers, allows members to save, earn, and redeem via discounts, points, and rewards. We track consumer preferences, order frequency, and pool profiles in order to curate and enhance our recommendations and promotions, anticipate product demand, and track lifetime value to better incentivize our loyalty members. For the fiscal year ended October 3, 2020, our loyalty members generated more than 60% of our direct residential sales. On average, a loyalty member spends twice as much with us per year than a non-loyalty member.
Consumer-centric connected ecosystem for all pool and spa owners and the professionals who serve them using proprietary, leading brands across all channels.
We have built the most extensive and geographically diverse pool and spa care network in the United States, consisting of three formats: Residential, Professional (PRO), and Commercial. Our locations are strategically located in densely populated areas mainly throughout the Sunbelt, including California, Arizona, Texas, and Florida. Across our physical network, we employ a team of associates, including pool and spa care experts and service technicians, who act as solution providers to all of our consumers, including both DIY and DIFM pool owners as well as pool professionals.
As the world has become more digitally focused, and consumers increasingly demand “smart” home-enabled options, we have focused on architecting the industry-leading integrated digital platform of proprietary e-commerce websites designed to serve our residential, professional, and commercial consumers. Our proprietary e-commerce websites serve digital consumers through curated pricing and targeted merchandising strategies. In addition to our owned e-commerce websites, we offer our products through online marketplaces such as Amazon, eBay, and Walmart. As a result of our strategic investments in digital, we are uniquely positioned to serve our consumers with cross-channel capabilities and capture incremental online demand from new consumers while growing the total profitability of the network.
Comprehensive assortment of proprietary brands with recurring, essential, superior product formulations, and trusted, solution-based services for all consumers.
We offer a comprehensive product assortment, consisting of more than 30,000 products across chemicals, equipment and parts, cleaning and maintenance equipment, and safety, recreational, and fitness-related categories. More than 80% of our product sales are non-discretionary and recurring in nature; these products are critical to the ongoing maintenance of pools and spas. In addition, approximately 55% of our total sales and 80% of our chemical sales are derived from proprietary brands and custom-formulated products, which allows us to create an entrenched consumer relationship, control our supply chain, and capture attractive margins. Consumers choose our exclusive, proprietary brands and custom-formulated products for their efficacy and value, a combination that we believe cannot be found elsewhere.
We pair our comprehensive product assortment with differentiated in-store and on-site service offerings. We pioneered the complimentary in-store water test and resulting pool or spa water prescription, which has driven consumer traffic and loyalty, and has created a “pharmacist-like” relationship with our consumers. Through innovation, we recently introduced significant upgrades to our water testing capabilities with the launch of our AccuBlue® platform. The AccuBlue® testing device
68
screens for nine distinct water quality criteria. We have found that 85% of AccuBlue® tests come back with a score below 80%, indicating potentially unsafe pool water and resulting in three or more problems that need to be addressed. Our in-store experts leverage our proprietary AccuBlue® water diagnostics software engine to offer our consumers a customized prescription and treatment plan using our comprehensive range of exclusive products, walking them through product use sequencing step-by-step. These detailed and sophisticated treatment algorithms are supported by our differentiated water treatment expertise built over decades. Historically, we have found that consumers who regularly test their water with us spend more with us per year than other consumers, underscoring the importance of this acquisition and retention vehicle. We also employ the industry’s largest network of in-field technicians who perform on-site evaluations, installation, and repair services for residential and commercial consumers.
Attractive financial profile characterized by consistent, profitable growth, and strong cash flow conversion offering multiple levers to drive shareholder value.
We have delivered 57 consecutive years of sales growth, demonstrating our ability to deliver strong financial results through all economic cycles. Our growth has been broad based across residential pool, residential spa, professional pool, and commercial pool consumers and has been driven by strong retention and profitable acquisition of sticky, long-term consumer relationships. Due to our scale, vertical integration, and operational excellence, we maintain high profitability. Due to our low maintenance capital intensity, we generate strong cash flows. As a result of our attractive financial profile, we have significant flexibility with respect to capital allocation, giving us the ability to drive long-term shareholder value through various operating and financial strategies.
Highly experienced and visionary management team that combines deep industry expertise and advanced, direct-to-consumer capabilities.
Our strategic vision and culture are directed by our executive management team under the leadership of our Chief Executive Officer, Michael R. Egeck, and our Executive Vice President and Chief Financial Officer, Steven M. Weddell. Our well-balanced executive management team is comprised of leaders with decades of experience in the pool and spa care industry as well as recently hired executives who bring new expertise and capabilities to Leslie’s from outside industries. Our management team is uniquely capable of executing upon our strategic vision and successfully continuing to create long-term shareholder value.
Our Growth Strategies
Grow our consumer file.
We believe we have significant opportunity to acquire new residential consumers and reactivate lapsed residential consumers, which we plan to do by executing on the following strategies:
| • | Acquire or reactivate consumers via optimized marketing strategy. We believe we have a sizeable opportunity to grow by serving the millions of pool and spa owners in our market who do not actively shop with us today. We plan to accelerate our acquisition of these potential new or reactivated consumers and, at the same time, reduce consumer acquisition cost by shifting our marketing mix toward more efficient digital and social channels. |
| • | Capture outsized share of new pool and spa consumers. We have observed considerable recent acceleration in new pool and hot tub installations, bringing new consumers to our market. We intend to bolster consumer file growth by deploying targeted marketing tactics to win outsized share of this new consumer cohort. |
69
Increase share of wallet among existing consumers.
We currently serve a file of approximately 5.5 million active consumers, which represents approximately one-third of the estimated total addressable market of pool and spa owners. We believe we have a significant opportunity to increase spend from existing consumers and drive higher lifetime value. We plan to do this by executing on the following strategies:
| • | Increase loyalty membership penetration and introduce program upgrades. We plan to continue to market our loyalty program in-store and online to convert more of our consumers to loyalty members. In addition, we are in the process of enhancing our loyalty program to offer more value-added features and further drive member engagement. We will explore opportunities to drive interest by selectively offering special incentives and rewards as well as introducing new value-added features. We believe these initiatives will drive higher transaction frequency and basket size, which will result in increased category spend and higher lifetime value with existing consumers. |
| • | Enhance retention marketing. While we have historically been satisfied with our consumer retention metrics, we believe there is opportunity to drive even greater retention. We plan to do this by more actively leveraging our consumer database to personalize the consumer experience with targeted messaging and product recommendations. |
| • | Expand our product and service offering. We plan to expand our offering by introducing new and innovative products and services in our existing categories and by expanding into adjacent categories. Specifically, we believe there is an opportunity with products targeted to spa owners, who have historically been underserved. |
Grow additional share in the professional market.
We believe we have a significant opportunity to grow our sales with pool care professionals, who individually spend more than 25x as much as residential consumers on pool supplies and equipment.
Our research suggests that small and mid-size pool professionals value convenience and referrals, both of which we are uniquely positioned to offer given our 900+ locations and industry’s largest consumer file. We plan to expand our physical network of PRO locations, which specifically cater to pool professionals, by opening new locations and selectively remodeling existing residential locations. We believe there is significant whitespace opportunity to operate more than 200 total PRO locations across the United States. We also plan to assemble an affiliated network of qualified pool professionals to extend the Leslie’s name into water maintenance. We believe that this initiative represents a natural adjacency and will resonate with existing residential consumers as well as help attract new residential consumers.
Utilize strategic M&A to consolidate share and further enhance capabilities.
The aftermarket pool and spa industry remains highly fragmented, which offers attractive opportunities to utilize strategic M&A to drive consolidation. We have historically used, and plan to continue to use, strategic acquisitions to obtain consumers and capabilities in both new and existing markets. We believe that we are the consolidator of choice in the industry, and we will continue to focus on acquiring high quality, market-leading businesses with teams, capabilities, and technologies that uniquely position us to create value by applying best practices across our entire physical and digital network to better serve new and existing consumer types.
Addressing underserved residential whitespace.
We have identified more than 700 underserved residential pool and spa care markets in the continental United States. With our omni-channel capabilities, successful track record of new location
70
openings, and targeted digital marketing tactics, we believe we are well positioned to capitalize on this meaningful whitespace opportunity. We plan to assess each market independently and determine the most capital efficient way to serve these trade areas using a mix of digital assets and physical locations.
Continue to introduce disruptive innovation.
Leslie’s has a legacy of disruptive innovation in the pool and spa care industry. We plan to continue that legacy by continuously developing and introducing capabilities that create value for our consumers. Present areas of focus include water testing, maintenance prescriptions, new product offerings, and our product distribution ecosystem.
As the Internet of Things wave continues, we believe consumers will seek the convenience of “smart” home functionality in more facets of their daily lives. We believe this presents an opportunity to introduce a full service, connected home solution that effectively automates pool maintenance, including actively monitoring our customer’s water, diagnosing, developing, and prescribing a treatment plan, and delivering to our customer’s home the assortment of products needed to maintain a clear, safe, beautiful pool.
Our Industry
We operate in the large and growing aftermarket pool and spa care industry, which we believe is among the most highly predictable, recurring, and defensible consumer markets. The industry broadly is comprised of: (i) chemicals; (ii) equipment, parts, and accessories; and (iii) services. According to leading research firms, the industry generated revenue of nearly $11 billion in 2019 and grew at a 3.8% CAGR from 2015 to 2019.
The U.S. market is comprised of a growing installed base of more than 14 million pools and spas according to P.K. Data. The installed base of residential in ground pools has grown for at least 50 consecutive years, further underscoring the resilience of the industry we operate in. Once a new pool or spa is installed, it requires ongoing maintenance, which creates perpetual demand for maintenance products over the life of that pool or spa. We estimate the average in-ground pool owner spends $24,000 or more on maintenance products and services over the life of a pool. In the last ten years, the average age of existing in-ground residential pools has increased from approximately 19 years to approximately 22 years; as the installed base continues to age, we expect there to be increasing demand from consumers for aftermarket parts and service to maintain their pools.
The industry is currently experiencing a seismic shift in demand due to secular trends in consumer behavior that have been accelerated by the COVID-19 pandemic. Consumers are increasingly adopting healthier lifestyles and a heightened sense of sanitization and safety, while migrating to lower density communities and spending more time at home and outdoors. Based on research performed by P.K. Data, new pool permit activity through July 2020 has grown by 32% compared to 2019 and is forecasted to drive unprecedented year-over-year growth in new pool installations. Nearly 200,000 new in ground pools are expected to be constructed in 2020 and 2021, representing nearly $5 billion in estimated lifetime maintenance spend.
While we benefit from the growth in the installed base, our business is not dependent on new pool construction activity and can generate strong growth from a fixed installed base through increased pool usage and maintenance needs.
Our Consumers
We strategically serve all consumers within the aftermarket pool and spa care industry including Residential Pool, Residential Spa, Professional Pool, and Commercial Pool consumers.
71
| • | Residential Pool. The residential pool market consists of 8.5 million pools representing a total aftermarket sales opportunity of $6.1 billion. Within this market, DIY aftermarket spend represents roughly 70% of total spend while DIFM services represent approximately 30% of total spend. We serve approximately 5.5 million active consumers. Many of these consumers visit our locations on a regular basis to conduct water testing, seek expert pool advice, and purchase products as well as utilize our integrated digital platforms. |
| • | Residential Spa. The residential spa market consists of nearly 5.5 million spas or hot tubs representing a $0.7 billion aftermarket sales opportunity for chemicals and equipment. Including the $1.1 billion market for new spas, residential spa represents a total addressable market of approximately $1.8 billion. We serve nearly 320,000 active residential spa consumers. |
| • | Professional Pool. The professional pool market consists of nearly 45,000 professionals who spend an estimated $23,000 on chemicals and equipment per year on average, representing a total sales opportunity of more than $650 million. We serve nearly 20,000 active professional pool consumers who specialize in pool maintenance and equipment repair for DIFM homeowners, businesses, and government entities. We provide pool professionals access to wholesale pricing across our integrated network. |
| • | Commercial Pool. The commercial pool market consists of more than 250,000 pools representing a total aftermarket sales opportunity of $2 billion. We serve nearly 60,000 active commercial pool consumers, including operators of hotels, motels, apartment complexes, and water parks. |
Our Product and Service Offering
We offer a comprehensive assortment of more than 30,000 products across chemicals, equipment and parts, cleaning and maintenance equipment, and safety, recreational, and fitness related products. More than 80% of our assortment is comprised of essential and non-discretionary products that are needed by residential and professional consumers to care for pools and spas. The vast majority of our assortment features non-discretionary products that are shelf-stable and generally not prone to either obsolescence or shrinkage, which could occur from changing technology or consumer buying habits. As the trusted one-stop destination for all aftermarket pool and spa needs, we provide an extensive and highly differentiated product offering. We aim to fulfill the needs of our residential, professional, and commercial consumers with our comprehensive assortment, in-stock inventory, and product selection across a broad range of premium third-party and proprietary brands.
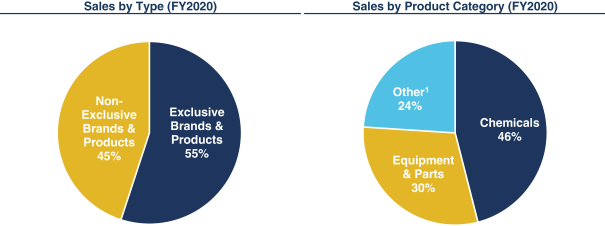
72
Since our inception in 1963, we have offered a growing portfolio of owned and exclusive brands, including the launch of the Jacuzzi® and our RightFit® brands in 2016. Our exclusive brands and products account for approximately 55% of total sales and 80% of chemical sales. Our premium, exclusive and broad assortment differentiates us from “commoditized” products offered by big-box retailers and enables us to build strong relationships with our consumers.
In addition to our comprehensive product assortment, we offer critical services, such as complimentary water testing and in-store equipment repair. We also employ the industry’s largest in-field service network, consisting of more than 200 pool and spa care service professionals who have the expertise to provide essential on-site equipment installation and repair services for residential and commercial consumers throughout the continental United States.
Our Integrated Platform
We operate an integrated platform consisting of physical locations, distribution centers, and proprietary e-commerce websites.
The map below reflects our network:
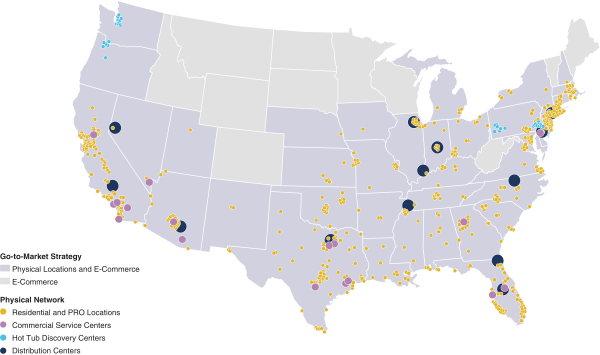
| • | Residential Locations. We serve our residential consumers through 903 residential locations that are strategically located in 37 states. We offer a range of differentiated and innovative in-store and on-site service offerings including our in-store water test. Our residential locations are supported by a team of associates, including pool and spa care experts and experienced service technicians, who are committed to decoding pool care for consumers and performing on-site installation and repair services. On average, our residential locations average 3,500 square feet, and have on average 900 in-store SKUs. Our residential locations have service counters through which we also provide products and services to professional consumers. Our residential locations feature relatively modest upfront investment of |
73
| approximately $300,000, modest ongoing maintenance capital expenditures, and achieve strong performance levels by year four, including sales of $525,000, 4-wall EBITDA margins of over 20%, and an attractive cash-on-cash return of more than 35%. We have identified, and third-party analysis has confirmed, more than 700 opportunities in underserved markets. We will determine how to most efficiently serve these markets through our integrated ecosystem. |
| • | Digital Network. Our complementary platform of branded proprietary e-commerce websites and marketplace storefronts allows us to seamlessly serve the needs of all digital consumers through curated pricing and targeted merchandising strategies. In the last two years, we have invested in integrating our online and physical platforms and enhancing our ability to serve our consumers by developing omni-channel capabilities including BOPIS, BORIS, SFS, and STS, among other services, which are due to launch in calendar year 2021. In addition to our owned e-commerce websites, we are the leading partner for Amazon in the pool category, and accounted for more than 30% of Amazon’s estimated pool and spa care business in the year ended October 3, 2020. |
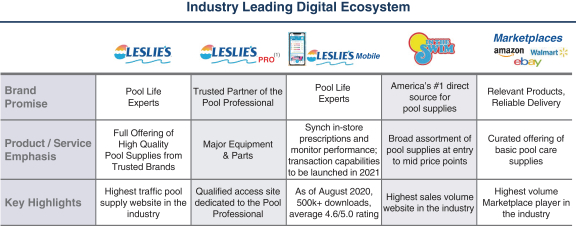
(1) Leslie’s PRO website to be launched in 2021.
| • | PRO Locations. Our PRO locations carry additional SKUs targeting the professional consumer. We have identified significant opportunities to expand and develop our PRO network to address the growing and underserved professional consumer base. In addition, the PRO locations offer attractive economics featuring significantly higher average unit volume, sales per square foot, and greater contribution generation. Finally, our PRO locations draw more professionals into the broader Leslie’s ecosystem, driving meaningfully higher professional sales volumes in our residential locations situated in the same trade area. We believe we have a near-term opportunity to expand our PRO locations from 16 today to more than 200 by adding new locations in key markets and selectively retrofitting existing residential locations with incremental inventory and limited capital expenditures. On average, our PRO locations have 1,500 in-store SKUs. Our PRO locations also serve residential and commercial consumers. |
| • | Commercial Service Centers. We serve our commercial consumers through 17 Commercial Service Centers. These are our largest format locations with an extensive assortment and ability to service bulk orders and special items and services. Our physical network coupled with our forthcoming omni-channel capabilities and in-field service network offers unparalleled convenience to commercial consumers. |
| • | Hot Tub Discovery Centers. In select markets, we also operate full service hot tub and spa locations under the banners of AquaQuip, Valley Pool & Spa, and Oregon Hot Tub, which specialize in the hot tub and spa category. At these locations, we offer an expanded |
74
| assortment of merchandise and services specifically catering to current and prospective spa owners. In addition to these standalone locations, we also operate four MyLife® Hot Tub Discovery Centers and eight MyLife® Hot Tub Showrooms in select Leslie’s residential locations, where we feature our proprietary MyLife® brand line of spas. |
Our Vertically Integrated Model
We operate a vertically integrated supply chain, packaging, and distribution model, which represents a significant competitive advantage.
As the only vertically integrated national pool and spa care brand in the United States, we have the capability to produce and package products at our company-operated packaging plants and third-party contract packaging facilities. Our strategy is to identify, produce, and package high volume items that do not require sophisticated or capital-intensive production or packaging equipment, but allow us to offer our consumers a premium product while offering us a significant cost advantage. We source a variety of raw materials and chemicals directly from a diversified supplier base; we maintain strong relationships with these suppliers; and no single supplier represents more than 10% of our annual purchases. Using these raw materials, we manufacture and package a wide selection of final SKUs, including but not limited to, chlorine products, pH adjusters, and filter cleaners. A significant portion of our total mix is comprised of products that we manufacture or package through vertical integration, which offers economies of scale that has resulted in higher quality products and a structurally advantaged margin profile.
We also have the unique competitive advantage of operating a vertically integrated distribution and delivery model. In addition to operating two manufacturing plants, we operate a national network of eight Company-operated distribution centers as well as five third-party distribution centers. Our eight Company-operated distribution centers have the capacity to carry a broad breadth of our products in significant quantities and are capable of replenishing inventory throughout our physical network. From these facilities, we self-distribute to our physical network through an owned fleet, consisting of 31 tractors and 125 trailers, which helps ensure optimal in-stock levels throughout the year. Our third-party distribution centers are strategically located to complement our company-operated distribution centers and primarily fulfill online orders. As we implement new omni-channel capabilities in the near future, including ship-from-store, we will have 936 new omni distribution points across the United States, which will give us the unique advantage of being able to reach all consumers in the continental United States in less than 24 hours.
Our Marketing Strategy
As a result of our comprehensive product and service offering and longstanding relationship with our consumers, we currently capture between 40% and 50% of our consumers’ total aftermarket product spend in the category, which is the highest such share in the category according to a recent survey. Despite this significant penetration, we believe there is significant potential to drive increased share of wallet through strategic initiatives such as our loyalty membership program and dynamic promotions.
Due to the highly recurring, replenishment nature of our product mix and long-term consumer relationships, we believe that our investments in consumer marketing generate highly attractive returns. When we acquire new consumers through our loyalty program, their average spend with us over time is several hundred dollars. However, we have not historically invested significant dollars in new consumer acquisition. For the year ended October 3, 2020, we invested $19 million in marketing, representing less than 2% of sales (including <1% in consumer acquisition). Historically, the vast majority of this spend has been directed toward retention rather than new consumer acquisition.
75
Going forward, we believe we have a sizable opportunity to profitably grow our investment in new consumer acquisition. We have the unique competitive advantage of knowing where virtually every pool and spa in the United States is located, and by leveraging this database, we have the ability to allocate our advertising dollars in a highly targeted manner. Through these strategies, we plan to increase brand awareness and profitably acquire new consumers.
Our Competition
The U.S. aftermarket pool and spa care industry is fragmented and competitive. We compete against a wide range of manufacturers, retailers, distributors, and service providers in the residential, professional, and commercial pool and spa care market. This includes original equipment manufacturers, regional and local retailers, home improvement retailers, mass-market retailers, and specialty e-commerce operators. Key competitive groups include:
| • | Regional and Local Independent Retailers: includes more than 8,000 smaller, local independent competitors, which offer the convenience of proximity. The vast majority of these competitors operate single stores and, due to relative economies of scale, this group generally offers a limited SKU selection, charges higher prices and invests less resources in marketing; |
| • | Home Improvement Retailers: includes national home improvement retailers, such as Home Depot, Lowe’s, and local and regional hardware stores. This group generally employs a seasonal strategy whereby a limited SKU selection is offered during select spring and summer months, does not offer services and does not have associates with the pool and spa care expertise or offer services to consumers; |
| • | Mass-Market Retailers: includes larger, scaled players, such as Amazon, Walmart, and Costco. This group generally offers a limited SKU selection, often on a seasonal basis, and does not offer services or pool and spa care expertise; and |
| • | Wholesale Distributors: includes large wholesalers such as Pool Corp. This group generally does not directly serve the end-consumer, but rather serves as an intermediary that supplies product to retailers as well as the professional channel. |
Our competitors offer pool care products and services of varied quality and across a wide range of retail price points. We experience greater brick and mortar competition in the states with the largest installed pool bases, including California, Texas, Florida, and Arizona. While some of our competitors also market and sell online, there are various challenges to serving consumers in the aftermarket pool and spa care industry via e-commerce. These challenges include regulatory restrictions on shipping hazardous materials, the need for professional installation of equipment at point of delivery, and the need for regular water testing, expert advice, and customized prescriptions and solutions related to the sale of chemicals. In addition, due to the seasonality of the aftermarket pool and spa care industry, several competitors tend to offer only a limited selection of products during select spring and summer months.
Our Sponsors
L Catterton
With approximately $20 billion of equity capital across seven fund strategies in 17 offices globally, L Catterton is the largest consumer-focused private equity firm in the world. L Catterton’s team of nearly 200 investment and operating professionals partners with management teams around the world to implement strategic plans to foster growth, leveraging deep category insight, operational excellence, and a broad thought partnership network. Since 1989, the firm has made more than 200 investments in leading consumer brands. L Catterton was formed through the partnership of Catterton, LVMH, and Groupe Arnault.
76
GIC
GIC is a leading global investment firm established in 1981 to manage Singapore’s foreign reserves. A disciplined long-term value investor, GIC is uniquely positioned for investments across a wide range of asset classes, including equities, fixed income, private equity, real estate, and infrastructure. In private equity, GIC invests through funds as well as directly in companies, partnering with its fund managers and management teams to help world class businesses achieve their objectives. Headquartered in Singapore, GIC employs more than 1,700 people across 10 offices in key financial cities worldwide.
Information Systems
We believe that our management information systems will support our continued growth. Over the last five years, we have invested over $45 million in our information system infrastructure. We have robust and growing capabilities that enable our integrated platform to function seamlessly across channels.
Human Capital Resources
As of October 3, 2020, we employed approximately 3,700 employees. Of these employees, approximately 2,650 work in our physical network, 250 work as in-field service technicians, 525 work in corporate, infrastructure, or e-commerce and 275 work in our distribution centers. We believe that we have good relations with our employees. None of our employees are currently covered under any collective bargaining agreements.
We consider our employees to be the foundation for our growth and success. As such, our future success depends in large part on our ability to attract, train, retain, and motivate qualified personnel. The growth and development of our workforce is an integral part of our success. We place a priority on promoting from within. Over the last three years, approximately 74% of our retail and corporate management openings have been filled by existing employees.
We are also committed to developing and fostering a culture of diversity and inclusion and know that a company’s ultimate success is directly linked to its ability to identify and hire talented individuals from all backgrounds and perspectives.
Trademarks and Other Intellectual Property
In the course of our business, we employ various trademarks, trade names and service marks, including Leslie’s®, AccuBlue®, MyLife®, and our logo, in packaging and advertising our products. We have registered trademarks and trade names for several of our major products on the Principal Register of the United States Patent and Trademark Office. We distinguish the products produced in our chemical repackaging operation or by third party repackagers at our direction through the use of the Leslie’s brand name and logo and the trademarks and trade names of the individual items, none of which is patented, licensed, or otherwise restricted to or by us. We believe the strength of our trademarks and trade names has been beneficial to our business and we intend to continue to protect and promote our trademarks in appropriate circumstances.
Legal Proceedings
We are subject to various litigations, claims and other proceedings that arise from time to time in the ordinary course of business. We believe these actions are routine and incidental to the business.
77
While the outcome of these actions cannot be predicted with certainty, we do not believe that any will have a material adverse impact on our company.
Properties
We have 936 locations, two manufacturing facilities, eight Company-operated distribution centers, and five third-party distribution centers in 37 states. Most of our locations operate on flexible five-year leases which offer significant flexibility as they can be located in a variety of venues, including strip centers, lifestyle centers, and shopping centers. Our current physical network is summarized in the chart below:
| State |
Number of Locations |
|||
| Alabama |
9 | |||
| Arizona |
91 | |||
| Arkansas |
3 | |||
| California |
168 | |||
| Connecticut |
16 | |||
| Delaware |
3 | |||
| Florida |
88 | |||
| Georgia |
34 | |||
| Illinois |
9 | |||
| Indiana |
12 | |||
| Iowa |
1 | |||
| Kansas |
6 | |||
| Kentucky |
6 | |||
| Louisiana |
14 | |||
| Maryland |
9 | |||
| Massachusetts |
11 | |||
| Michigan |
5 | |||
| Mississippi |
4 | |||
| Missouri |
13 | |||
| Nebraska |
2 | |||
| Nevada |
25 | |||
| New Hampshire |
3 | |||
| New Jersey |
32 | |||
| New Mexico |
3 | |||
| New York |
32 | |||
| North Carolina |
13 | |||
| Ohio |
16 | |||
| Oklahoma |
21 | |||
| Oregon |
5 | |||
| Pennsylvania |
33 | |||
| Rhode Island |
1 | |||
| South Carolina |
9 | |||
| Tennessee |
13 | |||
| Texas |
197 | |||
| Utah |
3 | |||
| Virginia |
15 | |||
| Washington |
11 | |||
|
|
|
|||
| Total Locations |
936 | |||
|
|
|
|||
78
Our corporate offices are located in Phoenix, Arizona. The 92,669 square foot office building has a current lease term through February 28, 2027, after which we have the ability to exercise two five-year renewal options.
Government Regulation
We are subject to federal, state, and local laws and regulations relating to matters such as product labeling, weights and measures, zoning, land use, environmental protection, local fire codes, and workplace safety including regulation by the Environmental Protection Agency, the Consumer Product Safety Commission, the Department of Transportation, the Occupational Safety and Health Administration, and the National Fire Protection Agency. Most of these requirements govern the packaging, labeling, handling, transportation, storage, and sale of chemicals. We store certain types of chemicals at each of our locations and the storage of these items is strictly regulated by local fire codes. In addition, we sell algaecides and related products that are regulated as pesticides under the Federal Insecticide, Fungicide and Rodenticide Act, and various state pesticide laws. These laws primarily relate to labeling, annual registration, and licensing. Compliance with such laws and regulations in the future could prove to be costly and could affect various aspects of the business, including, but not limited to, the amount of chemical products we are able to maintain in our locations, our ability to obtain various governmental approvals (such as product labeling and registration approvals), and our handling, transportation, and storage of the various products that we sell. Additionally, with the trend in environmental, health, transportation, and safety regulations becoming more restrictive, it is possible that the costs of compliance with such laws and regulations will continue to increase.
Insurance
We are self-insured for losses relating to workers’ compensation, general liability, and employee medical. Stop-loss coverage has been purchased to limit exposure to any material level of claims. Self-insured liabilities are accrued based upon our estimates of the aggregate claims incurred but not reported using historical experience.
79
The following table sets forth information about our executive officers and directors.
Directors and Executive Officers
Our board of directors consists of nine directors. Our directors and executive officers are as follows:
| Name |
Age | Position(s) | ||
| Steven L. Ortega |
59 | Chairman | ||
| Michael R. Egeck |
62 | Chief Executive Officer and Director | ||
| Steven M. Weddell |
46 | Executive Vice President, Chief Financial Officer, Secretary and Treasurer | ||
| Paula F. Baker |
53 | Chief Revenue Officer | ||
| Yolanda Daniel |
54 | Director | ||
| Jodeen Kozlak |
57 | Director | ||
| Marc Magliacano |
46 | Director | ||
| Matthew Lischick |
36 | Director | ||
| Eric Kufel |
54 | Director | ||
| Susan O’Farrell |
57 | Director | ||
| John Strain |
52 | Director |
Set forth below is a brief biography of each of our executive officers and directors.
Steven L. Ortega
Steven L. Ortega is our Chairman and serves on our board of directors. Mr. Ortega’s prior roles at the Company include Chief Executive Officer and President from 2017 to 2020, President and Chief Operating Officer from 2015 to 2017, Chief Financial Officer and Chief Operating Officer from 2014 to 2015, and EVP and Chief Financial Officer from 2005 to 2015. Prior to joining the Leslie’s organization, Mr. Ortega served as Executive Vice President and Chief Financial Officer for BI-LO, LLC from 1999 to 2005. At that time, BI-LO, LLC, was a $4.8 billion leading multi-branded regional supermarket chain in the southeast United States, which operated 423 stores in six states. Mr. Ortega’s responsibilities at BI-LO, LLC included the leadership and oversight of the Finance, Treasury, Accounting, Real Estate, Construction, Information Technology, Risk Management, and Internal Audit functions. Mr. Ortega also held the position of President of Golden Gallon Convenience Stores, a wholly owned subsidiary of BI-LO, LLC, based in Tennessee. Prior to joining BI-LO, LLC, Mr. Ortega was with American Stores Company, holding various positions within their supermarket and drug store subsidiaries, including Vice President, Finance and Administration and Vice President, Logistics. Mr. Ortega has a B.S. in Accounting from the University of Arizona. Mr. Ortega was selected to serve on our board of directors because of his experience and knowledge of the consumer industry, including as our former Chief Executive Officer and Chief Operating Officer.
Michael R. Egeck
Michael R. Egeck is our Chief Executive Officer and serves on our board of directors. Mr. Egeck joined the Company in February 2020. Previously, Mr. Egeck served as the Chief Executive Officer of PSEB Group, a $1.5 billion operating company composed of the Eddie Bauer outdoor brand and teen retailer PACSUN. Mr. Egeck has more than three decades of experience and a proven track record of driving transformational growth for a variety of brands and business models including: Chief Executive
80
Officer of Eddie Bauer (from 2012 to 2020); Chief Executive Officer of Hurley International, a division of Nike, Inc. (from 2011 to 2012); President of True Religion Apparel, Inc. (from 2010 to 2011); President of VF Corp’s Contemporary Brand Coalition (from 2007 to 2009); Chief Executive Officer of Seven For All Mankind, prior to its acquisition by VF Corp. (from 2006 to 2007); President of VF Corp’s Outdoor and Action Sports Coalition (from 2004 to 2006); and President of The North Face, a division of VF Corp (from 2000 to 2004). Previously, Mr. Egeck held senior leadership positions at Columbia Sportswear and Seattle Pacific Industries. Mr. Egeck has a B.A. in Economics from the University of Washington and an M.B.A. from the Michael G. Foster School of Business at the University of Washington. Mr. Egeck was selected to serve on our board of directors because of his experience and knowledge of the consumer industry, including as our Chief Executive Officer.
Steven M. Weddell
Steven M. Weddell is our Executive Vice President, Chief Financial Officer, Secretary and Treasurer. Mr. Weddell joined the Company in such capacities in June 2015. Mr. Weddell worked at Goldman, Sachs & Co. from 2003 to 2015, in the Investment Banking Group, and served as a Managing Director in the Consumer Retail Group as well as the Merger Leadership Group. Mr. Weddell also served as a Manager in the Assurance Practice at Arthur Andersen LLP. Mr. Weddell earned his CPA license in California and previously held Series 7 and Series 24 licenses. Mr. Weddell has a B.S. in Accounting from the University of Southern California and an M.B.A. from the Wharton School of Business at the University of Pennsylvania.
Paula F. Baker
Paula F. Baker has been our Chief Revenue Officer since March 2020. Prior to that, Ms. Baker served as our Chief People and Performance Officer since November 2019. Before joining Leslie’s, Ms. Baker served 15 years with Best Buy. From June 2017 to March 2019, Ms. Baker served as the President of US Retail at Best Buy, where she led the organization responsible for over 1,000 stores and $35 billion in revenue. While at Best Buy, Ms. Baker served in a variety of retail and human resources leadership roles, including Chief Human Resources Officer in 2016 and Territory Vice President from 2012 to 2016. During her time at Best Buy, Ms. Baker was also a Territory Human Resources Director from 2010 to 2012 and served in District Manager and General Manager roles from 2004 to 2010. Before joining Best Buy in 2004, Ms. Baker worked at Books-A-Million, a large chain bookstore in the southeast, Golfsmith International, a retail golf superstore, and St. Andrews Golf Company, a premier golf club manufacturer and retailer, in retail leadership roles. Ms. Baker has a bachelor’s degree in accounting and finance from the University of Nevada—Las Vegas.
Yolanda Daniel
Yolanda Daniel serves on our board of directors. Ms. Daniel joined the board in October 2020. Ms. Daniel currently serves as Vice President, Finance of the Federal Reserve Bank of Chicago where she leads financial planning and analysis, managerial accounting, financial analytics, procurement and payment services. Ms. Daniel brings 30 years of experience in finance, accounting and audit leadership for global and US-based operations across the distribution, financial services, and healthcare industries. Ms. Daniel has most recently served as finance executive for mission based organizations including CFO for IFF, a community development financial institution and real estate developer, and the American Board of Medical Specialties. Ms. Daniel’s career, predominantly in industry, includes leadership roles at W. W. Grainger, Inc. where she was global chief audit executive, division CFO for Acklands-Grainger, Inc. (Grainger Canada), and vice president for U.S. financial services and global finance transformation. While at CVS Health (formerly CVS Caremark), Ms. Daniel led internal audit services as Vice President, and was actively engaged in attest and advisory services during the divestiture of its physician practice management business, and subsequent growth and
81
integration activities for the pharmaceutical benefits management business leading to its 2006 ranking as a Fortune 100. In 2015, Ms. Daniel was honored as a Chicago United Business Leader of Color, and is a Fellow of the 2017 class of the Aspen Institute Finance Leaders Fellowship, and a member of the Aspen Global Leadership Network. Ms. Daniel earned an MBA from Kellogg School of Management at Northwestern University, Bachelor of Science in accounting from the University of Alabama at Birmingham, and is an honors marketing alumna from Jackson State University.
Jodeen A. Kozlak
Jodeen A. Kozlak serves on our board of directors. Ms. Kozlak joined the Board in October 2020. Ms. Kozlak is the founder of Kozlak Capital Partners, LLC, a private consulting firm, and has served as its CEO since 2017. Ms. Kozlak previously served as the Global Senior Vice President of Human Resources of Alibaba Group, a multinational conglomerate (2016-2017). Ms. Kozlak also previously served as the Executive Vice President and Chief Human Resources Officer of Target Corporation, one of the largest retailers in the U.S. (2007-2016), and held other senior leadership roles in her 15-year career there. Prior to joining Target Corporation, Ms. Kozlak was a partner in a private law practice and began her career at Arthur Andersen & Co. Ms. Kozlak also serves on the board of directors of C.H. Robinson Worldwide Inc. (Nasdaq: CHRW), MGIC Investment Corporation (NYSE: MTG), and KB Home (NYSE: KBH). Ms. Kozlak brings to the board of directors significant executive management and public board experience. Ms. Kozlak also has developed significant knowledge and expertise in the area of human capital development and she has a deep understanding of executive compensation within a public company.
Marc Magliacano
Marc Magliacano serves on our board of directors. Mr. Magliacano joined the board in February 2017. Mr. Magliacano currently serves as a Managing Partner for L Catterton’s Flagship Buyout Fund. L Catterton is the world’s largest consumer-focused private equity firm, with approximately $20 billion of equity capital across seven fund strategies in 17 offices globally. Mr. Magliacano has been a senior investment professional at L Catterton since May 2006. Prior to joining L Catterton, from 1999 to 2006, Mr. Magliacano was a Principal at North Castle Partners, a private equity firm focused on making consumer growth investments that benefit from healthy living and aging trends. While at North Castle, Mr. Magliacano originated and executed investments in the consumer health and wellness sectors. Prior to joining North Castle, Mr. Magliacano worked at NMS Capital, the merchant bank of NationsBanc Montgomery Securities, making growth investments in early stage consumer and retail businesses. Mr. Magliacano has served on the boards of directors of a variety of private and public companies, including Restoration Hardware. Mr. Magliacano received a BS in Economics from the University of Pennsylvania’s Wharton School of Business with dual degrees in Finance and Operations and Information Management and received an MBA from Columbia Business School. Mr. Magliacano was selected to serve as a director due to his prior experience on a variety of private and public company boards.
Matthew Lischick
Matthew Lischick serves on our board of directors. Mr. Lischick joined the board in February 2017. Mr. Lischick currently serves as a Partner at L Catterton. L Catterton is the world’s largest consumer-focused private equity firm, with approximately $20 billion of equity capital across seven fund strategies in 17 offices globally. Previously, Mr. Lischick was a Principal at L Catterton. Prior to joining L Catterton in 2009, Mr. Lischick worked in the Consumer Products & Retail Investment Banking Group at Bank of America Merrill Lynch. Mr. Lischick has a B.S. in Business Administration from Georgetown University and an M.B.A. from Harvard Business School. Mr. Lischick was selected to serve as a director because he possesses particular knowledge and experience in supporting high-
82
growth consumer businesses and has previously served as a director of companies with similar characteristics as the Company.
Eric Kufel
Eric Kufel serves on our board of directors. Mr. Kufel joined the board in January 2018 and served as our Executive Chairman from January 2019 through September 2019. Previously, Mr. Kufel served as Chairman of CorePower Yoga from 2016 to 2020 and as its Chief Executive Officer from 2016 to 2019. From 2015 to 2016, Mr. Kufel was an Operating Partner at L Catterton and served on the board of Ferrara Candy Company. Mr. Kufel also served as a Director and the Chief Executive Officer of Van’s Foods from 2009 to 2014 and Inventure Foods, Inc. from 1997 to 2008. Mr. Kufel has a Bachelor of Business Administration Degree from Gonzaga University and a master’s degree from the Thunderbird School of Global Management. Mr. Kufel was selected to serve as a director due to his extensive experience in leadership roles in the consumer industry.
Susan O’Farrell
Susan C. O’Farrell serves on our board of directors. Ms. O’Farrell joined the board in October 2020. Previously, Ms. O’Farrell served as Chief Financial Officer, Senior Vice President, Principal Accounting Officer and Treasurer at BlueLinx Holdings Inc. Ms. O’Farrell has been a senior financial executive holding several roles with The Home Depot since 1999. As the Vice President of Finance at The Home Depot, Ms. O’Farrell led teams supporting the retail organization. Most recently, Ms. O’Farrell was responsible for the finance function for The Home Depot’s At Home Services Group. Ms. O’Farrell began her career with Andersen Consulting, LLP, leaving as an Associate Partner in 1996 for a strategic information systems role with AGL Resources. Ms. O’Farrell served as Director BlueLinx Corporation, a subsidiary of BlueLinx Holdings. Ms. O’Farrell has a B.S. in business administration from Auburn University. Ms. O’Farrell was selected to serve as a director due to her extensive leadership experience in the retail and distribution industry, her broad business background, as well as her experience as the Chief Financial Officer of a publicly listed company.
John Strain
John Strain serves on our board of directors. Mr. Strain joined the board in August 2018. Mr. Strain currently serves as the Head of e-Commerce and Technology at Gap, Inc., an American worldwide clothing and accessories retailer founded in 1969. Mr. Strain has responsibilities for technology, product management, data and analytics, and loyalty and payments. Mr. Strain also oversees the digital business including e-commerce strategy and operations and digital and direct marketing. With almost 30 years in the retail technology and e-commerce space, Mr. Strain brings a consumer-centric mindset to a delivery orientation that has resulted in a track-record of successful digital transformations. Prior to joining Gap Inc., Mr. Strain was the General Manager of the Retail and Consumer Goods Industry for Salesforce. Mr. Strain also spent 11 years at Williams-Sonoma Inc. as the Chief Digital and Technology Officer where he was responsible for technology, product management, and digital marketing. Mr. Strain also spent 14 years as a management consultant. Mr. Strain received a B.S. in Finance from Santa Clara University where he was a member of the Retail Management Institute. Mr. Strain was selected to serve as a director due to his experience in various positions with consumer facing companies.
Director and Executive Officer Qualifications
Although we have not formally established any specific minimum qualifications that must be met by each of our officers, we generally evaluate the following qualities: educational background, diversity
83
of professional experience, including whether the person is a current or was a former chief executive officer or chief financial officer of a public company or the head of a division of a prominent international organization, knowledge of our business, integrity, professional reputation, independence, wisdom, and ability to represent the best interests of our shareholders.
The Nominating and Governance Committee of the board of directors prepares policies regarding director qualification requirements and the process for identifying and evaluating director candidates for adoption by the board of directors. The above-mentioned attributes, along with the leadership skills and other experiences of our officers and board of directors members described above, are expected to provide us with a diverse range of perspectives and judgment necessary to facilitate our goals of shareholder value appreciation through organic and acquisition growth.
Composition of the Board of Directors and Election of Directors
Our board of directors is currently composed of nine members. In accordance with our fifth amended and restated certificate of incorporation, our directors are divided into three classes serving staggered three-year terms. At each annual meeting of stockholders, our directors will be elected to succeed the class of directors whose terms have expired. Our current directors are divided among the three classes as follows:
| • | the Class I directors consist of Yolanda Daniel, Michael Egeck and Eric Kufel, and their terms will expire at the first annual meeting of stockholders occurring after the IPO; |
| • | the Class II directors consist of Jodeen Kozlak, Matthew Lischick and John Strain, and their terms will expire at the second annual meeting of stockholders occurring after the IPO; and |
| • | the Class III directors consist of Marc Magliacano, Susan O’Farrell and Steven Ortega, and their terms will expire at the third annual meeting of stockholders occurring after the IPO. |
Directors in a particular class will be elected for three-year terms at the annual meeting of shareholders in the year in which their terms expire. As a result, only one class of directors will be elected at each annual meeting of our shareholders, with the other classes continuing for the remainder of their respective three-year terms. Each director’s term continues until the election and qualification of his successor, or his earlier death, resignation, retirement, disqualification or removal.
The classification of our board of directors, together with the ability of the stockholders to remove our directors only for cause and the inability of stockholders to call special meetings, may have the effect of delaying or preventing a change of control or management. See the section titled “Description of Capital Stock—Anti-Takeover Provisions” for a discussion of other anti-takeover provisions that are included in our fifth amended and restated certificate of incorporation.
Director Independence
Our board of directors has undertaken a review of its composition, the composition of its committees and the independence of each director. Based upon information provided by each director, our board of directors has determined that none of our directors, with the exception of Michael Egeck, Eric Kufel, Matthew Lischick, Marc Magliacano and Steven Ortega, has a relationship that would interfere with the exercise of independent judgment in carrying out the responsibilities of a director and is independent under applicable Nasdaq rules. In making these determinations, our board of directors considered the current and prior relationships that each non-employee director has with our company and all other facts and circumstances our board of directors deemed relevant in determining their independence, including the beneficial ownership of our capital stock by each non-employee director, and the transactions involving them described in the section titled “Certain Relationships and Related Party Transactions.”
84
Committees of Our Board of Directors
Our board of directors has established an audit committee, a compensation committee and a nominating and corporate governance committee. The composition and responsibilities of each of the committees of our board of directors are described below. Members serve on these committees until their resignation or until otherwise determined by our board of directors.
At the completion of our IPO, more than 50% of the voting power in the election of our directors was held by an individual, group, or another company, and as a result, we were a “controlled company” within the meaning of the corporate governance standards of Nasdaq. As of November 11, 2020, we were no longer a controlled company and must comply with certain corporate governance requirements by the conclusion of the one-year transition period afforded by the rules of Nasdaq, or November 11, 2021, including the requirements that:
| • | a majority of our board of directors consists of “independent directors,” as defined under the rules of such exchange; |
| • | our board of directors has a compensation committee that is composed entirely of independent directors with a written charter addressing the committee’s purpose and responsibilities; and |
| • | our board of directors has a nominating and corporate governance committee that is composed entirely of independent directors with a written charter addressing the committee’s purpose and responsibilities. |
As a result, the majority of our directors are not currently independent and, with the exception of the audit committee, no committee of our board of directors is composed entirely of independent directors. Accordingly, until such time at which we comply with the above-mentioned corporate governance requirements, you may not have the same protections afforded to stockholders of companies that are subject to all of the corporate governance requirements of Nasdaq.
Audit Committee
Our audit committee consists of Susan O’Farrell, who chairs the committee, Yolanda Daniel and John Strain. Our board of directors has determined that each proposed committee member meets the “financial literacy” requirement for audit committee members under the Nasdaq rules and that Susan O’Farrell is an “audit committee financial expert” within the meaning of the SEC rules.
The audit committee’s primary responsibilities include, among other matters:
| • | selecting a qualified firm to serve as the independent registered public accounting firm to audit our financial statements; |
| • | helping to ensure the independence and performance of the independent registered public accounting firm; |
| • | reviewing financial statements and discussing the scope and results of the independent audit and quarterly reviews with the independent registered public accounting firm, and reviewing, with management and the independent registered public accounting firm, our interim and year-end results of operations and the reports and certifications regarding internal controls over financial reporting and disclosure controls; |
| • | preparing the audit and risk committee report that the SEC requires to be included in our annual proxy statement; |
| • | reviewing the adequacy and effectiveness of our disclosure controls and procedures and developing procedures for employees to submit concerns anonymously about questionable accounting or audit matters; |
85
| • | reviewing our policies on risk assessment and risk management; |
| • | reviewing related party transactions; and |
| • | approving or, as required, pre-approving, all audit and all permissible non-audit services and fees, other than de minimis non-audit services, to be performed by the independent registered public accounting firm. |
Our audit committee operates under a written charter that satisfies the applicable rules and regulations of the SEC and the listing standards of Nasdaq.
Compensation Committee
Our compensation committee consists of John Strain, who chairs the committee, Jodeen Kozlak and Marc Magliacano.
The compensation committee’s primary responsibilities include, among other matters:
| • | reviewing, approving and determining, or making recommendations to our board of directors regarding the compensation of our executive officers; |
| • | overseeing our overall compensation philosophy and compensation policies, plans and benefit programs for service providers, including our executive officers; |
| • | administering our equity compensation plans; and |
| • | reviewing, approving, and making recommendations to our board of directors regarding incentive compensation and equity compensation plans. |
Our compensation committee operates under a written charter that satisfies the applicable rules and regulations of the SEC and the listing standards of Nasdaq.
Nominating and Corporate Governance Committee
Our nominating and governance committee consists of Eric Kufel, who chairs the committee, Yolanda Daniel and Jodeen Kozlak.
The nominating and corporate governance committee’s primary responsibilities include, among other matters:
| • | identifying, evaluating, and selecting, or making recommendations to our board of directors regarding, nominees for election to our board of directors and its committees; |
| • | evaluating the performance of our board of directors and of individual directors; |
| • | considering and making recommendations to our board of directors regarding the composition of our board of directors and its committees; |
| • | reviewing developments in corporate governance practices; |
| • | evaluating the adequacy of our corporate governance practices and reporting; |
| • | reviewing the succession planning for our executive officers; and |
| • | developing and making recommendations to our board of directors regarding corporate governance guidelines and matters. |
Our nominating and corporate governance committee operates under a written charter that satisfies the applicable listing standards of Nasdaq.
86
Code of Ethics
Our board of directors has adopted a code of ethics that applies to all of our employees, officers and directors, including our executive, principal financial and principal accounting officers, or persons performing similar functions. The full text of our code of ethics is posted on the investor relations page of our website at www.lesliespool.com. We intend to disclose any future amendments to our code of ethics, or waivers of its requirements granted to executive officers and directors, on our website within four business days following the date of the amendment or waiver.
Compensation Committee Interlocks and Insider Participation
None of our executive officers has served as a member of a compensation committee (or if no committee performs that function, the board of directors) of any other entity that has an executive officer serving as a member of our board of directors.
Director Compensation
During the fiscal year ended October 3, 2020, our non-employee directors (other than Mr. Strain) did not receive any cash fees for their service on the board of directors, but were entitled to reimbursement of all reasonable out-of-pocket expenses incurred in connection with their attendance at board of directors and committee meetings.
Mr. Strain received an annual cash retainer of $125,000 for his service on the board of managers of our indirect parent entity and the boards of certain of our indirect parent entity’s subsidiaries, including the Company. Mr. Strain’s compensation arrangement upon completion of the IPO, and he is now compensated in the manner described below.
| Name |
All Other Compensation | Total | ||||||
| John Strain |
$ | 125,000 | (1) | $ | 125,000 | |||
| (1) | Represents the amount paid to Mr. Strain for his service on the board of managers of our indirect parent entity and the boards of certain of our indirect parent entity’s subsidiaries, including the Company. |
87
Our non-employee directors are eligible to receive cash compensation for their service on our board of directors in the form of annual cash retainers. Our non-employee directors will receive the following annual cash retainers for their service on our board of directors.
| Position | Retainer ($) | |
| Non-Executive Chairman |
125,000 | |
| Board Member (other than the Non-Executive Chairman) |
65,000 | |
| Audit Committee: |
||
| Chairperson |
20,000 | |
| Committee Member |
10,000 | |
| Compensation Committee: |
||
| Chairperson |
15,000 | |
| Committee Member |
10,000 | |
| Nominating and Corporate Governance Committee: |
||
| Chairperson |
10,000 | |
| Committee Member |
5,000 |
Our non-employee directors will receive annual grants of restricted stock units with an aggregate grant date value of $125,000 (with a vesting schedule to be established by the compensation committee at the time of the grant).
Our directors will be reimbursed for travel, food, lodging and other expenses directly related to their activities as directors. Our directors are also entitled to the protection provided by the indemnification provisions in our bylaws that will become effective upon the consummation of this offering. Our board of directors may revise the compensation arrangements for our directors from time to time.
Messrs. Ortega and Kufel are party to succession agreements with the Company that became effective upon completion of the IPO, pursuant to which they are entitled to certain payments and benefits, in addition to the compensation described above. For complete terms of the succession agreements, please see the respective agreements incorporated by reference as exhibits to the registration statement of which this prospectus forms a part. Under Mr. Kufel’s succession agreement, in addition to other accrued benefits and payments due upon termination of his existing employment agreement, he will receive, subject to his execution and non-revocation of a general release of claims in our favor, a lump-sum cash payment in the amount of $250,000. Mr. Kufel also will be eligible to participate in the health plans generally available to our executives (provided that he pays the same portion of the premiums and related deductibles and copays as required to be paid by our actively employed executives) until he obtains other employment. Under Mr. Ortega’s succession agreement, in addition to other accrued benefits and payments due upon termination of his existing employment agreement (including a bonus payment in the amount of $700,000 in respect of fiscal year 2020), he will receive a payment in the amount of $2,904,500, which constitutes his severance as further described below, and be eligible to participate in the health plans generally available to our executives, provided that he pays the same portion of the premiums and related deductibles and copays as required to be paid by our actively employed executives.
Limitations on Liability and Indemnification Matters
Our fifth amended and restated certificate of incorporation and our amended and restated bylaws limits our directors’ liability, and provide that we may indemnify our directors and officers to the fullest
88
extent permitted under the DGCL. The DGCL provides that directors of a corporation will not be personally liable for monetary damages for breach of their fiduciary duties as directors, except for liability for any:
| • | transaction from which the director derives an improper personal benefit; |
| • | act or omission not in good faith or that involves intentional misconduct or a knowing violation of law; |
| • | unlawful payment of dividends or redemption of shares; or |
| • | breach of a director’s duty of loyalty to the corporation or its stockholders. |
The DGCL and our amended and restated bylaws provide that we will, in certain situations, indemnify our directors and officers and may indemnify other employees and other agents, to the fullest extent permitted by law. Any indemnified person is also entitled, subject to certain limitations, to payment or reimbursement of reasonable expenses, including attorneys’ fees and disbursements, in advance of the final disposition of the proceeding.
We have entered or intend to enter into indemnification agreements with each of our directors and officers. These indemnification agreements may require us, among other things, to indemnify our directors and officers for some expenses, including attorneys’ fees, judgments, fines, and settlement amounts incurred by a director or officer in any action or proceeding arising out of his or her service as one of our directors or officers, or any of our subsidiaries or any other company or enterprise to which the person provides services at our request.
We maintain a directors’ and officers’ insurance policy pursuant to which our directors and officers are insured against liability for actions taken in their capacities as directors and officers. We believe that these provisions in our fifth amended and restated certificate of incorporation and amended and restated bylaws and these indemnification agreements are necessary to attract and retain qualified persons as directors and officers.
Insofar as indemnification for liabilities arising under the Securities Act may be permitted to directors, officers or control persons, in the opinion of the SEC, such indemnification is against public policy, as expressed in the Securities Act and is therefore unenforceable.
The limitation of liability and indemnification provisions in our fifth amended and restated certificate of incorporation and amended and restated bylaws may discourage stockholders from bringing a lawsuit against our directors and officers for breach of their fiduciary duty. They may also reduce the likelihood of derivative litigation against our directors and officers, even though an action, if successful, might benefit us and our stockholders. Further, a stockholder’s investment may be adversely affected to the extent that we pay the costs of settlement and damage awards against directors and officers as required by these indemnification provisions. At present, there is no pending litigation or proceeding involving any of our directors, officers or employees for which indemnification is sought and we are not aware of any threatened litigation that may result in claims for indemnification.
89
Our named executive officers (“NEOs” and each an “NEO”) for fiscal year 2020, consisting of all individuals who served as our principal executive officers during such year and our two other most highly compensated executive officers serving at the end of such year, are:
| • | Steven L. Ortega, our former Chief Executive Officer and current Chairman; |
| • | Michael R. Egeck, our Chief Executive Officer; |
| • | Steven M. Weddell, our Executive Vice President and Chief Financial Officer; and |
| • | Paula F. Baker, our Chief Revenue Officer. |
Executive Compensation Philosophy
We believe our compensation philosophy and design are well aligned with the interest of our stockholders, as well as our performance culture, growth strategy, and desire to attract and retain high-quality executives. Our executive compensation philosophy is to provide an attractive, flexible and market-based compensation program tied to company and individual performance and aligned with the interests of our stockholders. In establishing compensation levels and designing the elements of our executive compensation program, we aim to set overall compensation levels that are both internally equitable and commensurate with the companies with which we compete for talent. The principal objectives of our executive compensation program are to attract and retain highly talented executives to serve in leadership positions and advance our long-term growth strategy. We motivate such executives to succeed by providing compensation that is based on both short- and long-term performance and align the interests of our officers with those of our stockholders by delivering a substantial portion of the officers’ compensation through incentives that drive long-term enterprise value creation. We regularly review our executive compensation program with the goal of motivating our executive team to achieve our strategic goals and aligning their interests with those of our stockholders.
Process for Setting Executive Compensation
During the 2020 fiscal year, our board of directors and then current compensation committee had primary responsibility for setting executive compensation. The board of directors and the compensation committee made decisions regarding the compensation program for our named executive officers based upon recommendations from the CEO (except with respect to his own salary) as well as the committee’s general understanding of market trends and practices. These recommendations are generally based upon the executive’s individual contributions for the prior fiscal year, leadership and contribution to our performance, internal pay considerations, market conditions and survey data, and our overall budget for base salary increases for our employees generally. Our board of directors takes all of these factors into account when making its decisions on base salaries but does not assign any specific weight to any one factor. In addition to the annual base salary review, our board of directors may also adjust base salaries at other times during the year in connection with promotions, increased responsibilities, or to maintain competitiveness in the market.
Our compensation committee did not engage a compensation consultant prior to or during fiscal year 2020. Our compensation committee is responsible for the implementation and oversight of our executive compensation program. During fiscal year 2021, we expect to engage a compensation consultant to provide services including a review and analysis of our executive compensation levels and practices, remuneration of members of our board of directors, executive officer and non-employee director equity ownership guidelines, peer group compensation, and long-term incentive plan design
90
and equity grant practices. As part of this review process, we expect the board of directors and the compensation committee to apply its values and philosophy, while considering the compensation levels needed to ensure that our executive compensation program remains competitive and aligned with the interests of our stockholders.
Elements of Compensation
The compensation of our named executive officers generally consists of base salary, annual cash bonus opportunities, long-term incentive compensation in the form of equity awards and other benefits, each as described below.
Base Salary
The base salary payable to each named executive officer is intended to provide a fixed component of compensation reflecting the executive’s skill, competencies, experience, role, responsibilities, contributions, and performance. With the exception of Ms. Baker, there were no base salary increases awarded to NEOs in fiscal year 2020. As of the end of fiscal year 2020, our named executive officers were entitled to the following base salaries:
| Named Executive Officer |
Base Salary | |||
| Steven L. Ortega |
$ | 1,000,000 | ||
| Michael R. Egeck |
$ | 1,000,000 | ||
| Steven M. Weddell |
$ | 450,000 | ||
| Paula F. Baker |
$ | 400,000 | ||
For fiscal year 2020, Ms. Baker received an annualized base salary of $300,000 for serving as our Chief Performance Officer, which increased to $400,000 upon her transition to serving as our Chief Revenue Officer.
The actual base salary amounts paid to the named executive officers during fiscal year 2020 are set forth in the “Summary Compensation Table” below.
Annual Cash Bonus Opportunities
The target performance-based cash bonus opportunity for each named executive officer (other than Mr. Ortega) is expressed as a percentage of his or her base salary and can be earned by meeting certain predetermined corporate performance objectives. Fiscal year 2020 annual cash bonuses for Mr. Egeck, Mr. Weddell and Ms. Baker were targeted at 100%, 100% and 50% of their base salaries, respectively. Mr. Ortega’s target performance-based cash bonus opportunity for fiscal year 2020 was $350,000 and able to be earned in accordance with the same terms as apply to our other named executive officers.
In the first quarter of fiscal year 2020, the board of directors set corporate performance objectives based on the achievement of an annual EBITDA target, which the board of directors believed to best align the interest of the named executive officers and our stockholders. To earn a target bonus payout required fiscal year 2020 EBITDA of $170.0 million with a maximum payout (200% of target) earned for fiscal year 2020 EBITDA in excess of $180.2 million. Based on actual performance, the annual cash bonus earned by each named executive officer for fiscal year 2020 was equal to 200% of his or her target amount, as reflected in the “Summary Compensation Table” below. These amounts were paid out in November of 2020. Mr. Egeck’s and Ms. Baker’s annual cash bonuses for fiscal year 2020 were prorated based on their date of hire.
91
Long Term Equity Incentives
Our equity-based incentive awards are designed to align our interests and the interests of our stockholders with those of our employees, including our named executive officers.
Prior to the IPO, none of our named executive officers held any direct equity interests in our Company. Certain of our employees, including each of our named executive officers, were granted long-term equity incentive awards, in the form of equity interests of our then parent company, designed to incentivize them to remain in our service and drive performance. These long-term equity incentive awards were granted to our named executive officers in the form of profits interest units (collectively, the “incentive units”), which are intended to be treated as “profits interests” for U.S. federal income tax purposes. The incentive units allowed our named executive officers to share in distributions made by our then parent company in certain circumstances. The specific sizes of the incentive unit grants made to our named executive officers were determined in light of the named executive officer’s position and level of responsibilities with us and our then parent company’s overall management equity compensation philosophy.
During fiscal year 2020, Mr. Egeck and Ms. Baker received awards of incentive units in our then parent company as described in the “Summary Compensation Table” below. The size of the awards was determined based upon arms’-length negotiation at the time of each individual’s initial hiring by the Company. These incentive units were cancelled in connection with the consummation of our IPO and replaced with awards of restricted stock units as described in more detail below.
Restricted Stock Unit Awards and Stock Options
Following the end of fiscal year 2020 and in connection with the IPO, we granted stock options and restricted stock units under our 2020 Omnibus Incentive Plan, including to our named executive officers and certain of our directors, to provide additional retention and performance incentives to these individuals.
| • | 6,038,069 restricted stock units were granted in respect of forfeited unvested incentive units. Certain of these restricted stock units will vest based on time only, in accordance with the relevant vesting schedules of the forfeited unvested incentive units in respect of which they are issued. The restricted stock units issued in respect of the unvested performance-vesting incentive units held by each of Messrs. Ortega and Egeck will vest only upon the achievement of volume weighted average price (“VWAP”) targets established by our compensation committee for each such named executive officer, with such VWAP measured over rolling 20-day trading periods, with the first such rolling 20-day trading period commencing on the six-month anniversary of the consummation of the IPO. |
| Name |
Restricted Stock Units |
|||
| Steven L. Ortega |
582,632 | |||
| Michael R. Egeck |
2,535,064 | |||
| Steven M. Weddell |
234,587 | |||
| Paula F. Baker |
282,022 | |||
| • | 4,566,765 stock options were granted, which included stock options that will vest based on time and performance, granted to the named executive officers. The time-vesting stock options will vest over a four-year period following the consummation of our IPO, and the performance-vesting stock options will vest 50% on the Company’s achievement of the net income target for fiscal year 2021 and 50% on the Company’s achievement of the net income target for fiscal year 2022. Our named executive officers received the following stock options exercisable at a |
92
| price of $17 per share in connection with the consummation of the IPO. For each named executive officer, 2/3 of the granted stock options will be subject to time-vesting only and 1/3 of the granted stock options will be subject to performance-vesting only. |
| Name |
Stock Options | |||
| Steven L. Ortega |
147,060 | |||
| Michael R. Egeck |
1,176,472 | |||
| Steven M. Weddell |
735,295 | |||
| Paula F. Baker |
117,648 | |||
Other Benefits
We currently provide broad-based welfare benefits that are available to all of our employees, including our named executive officers, including health, dental, life, vision and disability insurance.
In addition, we maintain, and the named executive officers participate in, a 401(k) plan that provides eligible employees with an opportunity to save for retirement on a tax-advantaged basis and under which we are permitted to make discretionary employer contributions. Employees’ pre-tax contributions are allocated to their respective individual accounts and are then invested in selected investment alternatives according to their directions. The 401(k) plan is intended to be qualified under Section 401(a) of the Code. We currently match participant contributions to the 401(k) plan up to 4% of eligible earnings, up to IRS limits.
We do not maintain any defined benefit pension plans or non-qualified deferred compensation plans.
Employment Arrangements
During fiscal year 2020, we were party to employment agreements with each of our named executive officers except Ms. Baker, the key terms of which are described below. The following is a summary of the material terms of each agreement. However, in connection with and effective the IPO, we amended and restated all of these employment agreements, as further described below.
Mr. Egeck’s employment agreement provides for an indefinite term of employment, and the employment agreement for each of Messrs. Ortega and Weddell provides for an initial term (six years for Mr. Ortega and five years for Mr. Weddell), with automatic one-year extensions beginning upon expiration of the initial term, which may be cancelled upon at least 90 days’ prior written notice from either the respective named executive officer or the Company. Under their respective employment agreements, Messrs. Ortega, Egeck and Weddell were entitled to receive annual base salaries of $1,000,000, $1,000,000 and $450,000, respectively, in each case, subject to annual review by our board of directors. Further, each of Messrs. Egeck and Weddell has the opportunity to earn an annual cash bonus targeted at 100% of his respective annual base salary, and Mr. Ortega has the opportunity to earn an annual bonus targeted at $350,000 for fiscal year 2020 and increasing thereafter. Each of Messrs. Ortega, Egeck and Weddell was also entitled to an annual cash allowance for personal expenses and to participate in the Company’s employee and fringe benefit plans, as may be in effect from time to time, on the same basis as other employees of the Company generally.
In the event of a termination by the Company without “cause” or by the named executive officer for “good reason” (each as defined in his respective employment agreement), each of Messrs. Ortega and Weddell is generally eligible to receive an amount equal to two times the sum of his base salary and target bonus, payable in a lump sum within 14 days after the date of termination (together with
93
certain other payments), as well as reimbursement for his COBRA premiums for up to 18 months post-termination and up to 6 months of outplacement and transition services, and Mr. Egeck is entitled to receive an amount equal to 100% of his base salary, payable in equal monthly installments over the 12-month period following his termination. Each of Messrs. Egeck and Weddell must execute a release of claims in favor of the Company as a condition to receipt of severance.
The employment agreement for each of Messrs. Ortega, Egeck and Weddell contains restrictive covenants prohibiting him from: (i) competing against the Company for 24 months (36 months for Mr. Weddell) after termination of his employment, (ii) soliciting (or interfering with the Company’s relationships with) the Company’s employees, consumers or suppliers for 24 months (36 months for Mr. Weddell) after termination of his employment, and (iii) disclosing the Company’s proprietary information, developments and other intellectual property.
Messrs. Egeck’s and Weddell’s employment agreements have been amended and restated effective upon the IPO, resulting in the following changes to their existing agreements: annual base salaries of $1,025,000 and $570,000 (respectively), IPO bonuses of $550,000 each, removal of the cash allowances, and, for Mr. Egeck, an increase in his severance entitlement (triggered upon a termination by the Company without “cause” or by Mr. Egeck for “good reason”) to two times the sum of his base salary and target bonus, payable in equal monthly installments over the 24-month period following his termination. For complete terms of the amended and restated agreements, please see the respective agreements incorporated by referenced as exhibits to the registration statement of which this prospectus forms a part.
Also effective upon the IPO, Mr. Ortega’s employment agreement terminated and was replaced with a succession agreement detailing Mr. Ortega’s service as our Chairman and payout of his existing entitlements under the employment agreement described above. This succession agreement is incorporated by reference as an exhibit to the registration statement of which this prospectus forms a part, and described in greater detail under “Director Compensation.”
We are also party to an offer letter with Ms. Baker, which provides for employment at-will, an annual base salary of $300,000 (which has subsequently been increased to $400,000), a target annual bonus equal to 50% of her annual base salary, eligibility for benefits provided to our executives and certain payments that have already been made and benefits that have already been provided (including reimbursement of her relocation costs, a signing bonus of $75,000 and an equity incentive grant). Ms. Baker also participates in our 2019 Executive Severance Plan (the “ESP”), pursuant to which, upon a termination of her employment by the Company without “cause” (as defined in the ESP), she will receive a minimum of 6 months of continued base salary payments, subject to her execution of a release of claims against the Company. Ms. Baker will also be subject to cooperation and non-disparagement covenants under the ESP. For complete terms of Ms. Baker’s offer letter and the ESP, please see the respective documents incorporated by reference as exhibits to the registration statement of which this prospectus forms a part.
Other Matters
Tax Implications of Executive Compensation Decisions
Historically, as the Company’s common stock was not currently publicly traded, we have not previously taken the deductibility limit imposed by Section 162(m) of the Code into consideration in making compensation decisions. However, as a public company, we may authorize compensation payments that exceed the deductibility limitation under Section 162(m) of the Code when we believe that such payments are appropriate to attract and retain executive talent.
94
Risk Assessment
Our board of directors does not believe that our executive and non-executive compensation programs encourage excessive or unnecessary risk taking, and any risk inherent in our compensation programs is unlikely to have a material adverse effect on us.
Say-on-Pay
Our executive compensation has not historically been the subject of an advisory vote of stockholders. As a public company, to the extent applicable, our compensation committee will consider the results of advisory votes and the views expressed by our stockholders.
Clawback/Forfeiture
Awards may be subject to clawback or forfeiture to the extent required by applicable law (including, without limitation, Section 304 of the Sarbanes-Oxley Act, Section 954 of the Dodd-Frank Wall Street Reform and Consumer Protection Act), and/or the rules and regulations of the applicable securities exchange, or if so required pursuant to a written policy adopted by the Company or the provisions of an award agreement.
Prohibition on Hedging
Prior to the IPO, our executive officers and directors have not been subject to a policy prohibiting them from engaging in hedging transactions. In connection with the IPO, the compensation committee has adopted a policy prohibiting all executive officers and directors from engaging in any form of hedging transaction involving the securities of the Company. The policy addresses short sales and transactions involving publicly traded options and also prohibits such individuals from holding our securities in margin accounts and from pledging our securities as collateral for loans. We believe that these policies further align our executives’ interests with those of our stockholders.
Summary Compensation Table
The following table sets forth information regarding the compensation of our named executive officers for fiscal year 2020.
| Name and Principal Position |
Year | Salary ($) |
Bonus ($) |
Option Awards ($) |
Non-Equity Incentive Plan Compensation ($) |
All Other Compensation ($)(1) |
Total ($) |
|||||||||||||||||||||
| Steven L. Ortega(2) |
2020 | 1,000,000 | — | — | 700,000 | 78,950 | 1,778,950 | |||||||||||||||||||||
| Former Chief Executive Officer and current Chairman |
||||||||||||||||||||||||||||
| Michael R. Egeck |
2020 | 654,987 | (3) | — | 7,179,102 | (4) | 1,460,916 | 143,235 | 9,438,240 | |||||||||||||||||||
| Chief Executive Officer |
||||||||||||||||||||||||||||
| Steven M. Weddell |
2020 | 450,000 | — | — | 900,000 | 39,665 | 1,389,665 | |||||||||||||||||||||
| Executive Vice President |
||||||||||||||||||||||||||||
| Paula F. Baker(5) |
2020 | 327,224 | 75,000 | (6) | 633,750 | (7) | 327,224 | 127,342 | 1,490,539 | |||||||||||||||||||
| Chief Revenue Officer |
||||||||||||||||||||||||||||
95
| (1) | The amounts in this column are detailed in the table immediately below. |
| Company Contribution to 401(k) Plan(a) |
Personal Use of Company Plane(b) |
Gross-Up on Company Plane Use(b) |
Relocation Services(c) |
Cash Allowance(d) |
Gross-Up on Cash Allowance(e) |
Reimbursement of Legal Expenses(f) |
Total | |||||||||||||||||||||||||
| ($) | ($) | ($) | ($) | ($) | ($) | ($) | ($) | |||||||||||||||||||||||||
| Steven L. Ortega |
5,600 | 15,680 | 2,218 | — | 31,114 | 24,338 | — | 78,950 | ||||||||||||||||||||||||
| Michael R. Egeck |
— | 88,320 | 9,239 | — | 25,000 | 19,555 | 1,121 | 143,235 | ||||||||||||||||||||||||
| Steven M. Weddell |
5,600 | — | — | — | 19,114 | 14,951 | — | 39,665 | ||||||||||||||||||||||||
| Paula F. Baker |
— | — | — | 127,342 | — | — | — | 127,342 | ||||||||||||||||||||||||
| (a) | The amounts in this column represent the Company’s matching 401(k) plan contributions for the relevant named executive officers. |
| (b) | The amounts in the “Personal Use of Company Plane” column represent the aggregate incremental cost to us of each of Mr. Ortega’s and Mr. Egeck’s personal use of Company-owned aircraft in accordance with the terms of the Company’s corporate aircraft policy, under which Messrs. Ortega, Egeck and Weddell were permitted personal use of the Company-owned aircraft and were entitled to gross-ups on related imputed income up to, respectively, 20, 20 and 10 hours of actual flight time per year, which estimated gross-ups are reflected in the “Gross-Up on Company Plane Use” column. The Company-owned aircraft was sold on October 14, 2020, so we do not anticipate any named executive officers incurring additional costs under the Company’s corporate aircraft policy. |
| (c) | The amount in this column represents the aggregate amount of relocation benefits paid by the Company to Ms. Baker. |
| (d) | The amounts in this column represent the annual cash allowances provided to Messrs. Ortega, Egeck and Weddell for expenses related to employment that might be considered partially or wholly personal in nature. We eliminated these cash allowance arrangements in connection with our IPO. |
| (e) | The amounts in this column represent the estimated gross-ups to be paid by the Company on the cash allowances provided to Messrs. Ortega, Egeck and Weddell. |
| (f) | The amount in this column represents Company reimbursement for legal expenses incurred by Mr. Egeck in connection with the negotiation of his employment agreement with us. |
| (2) | Mr. Ortega served as our Chief Executive Officer at the beginning of fiscal year 2020 (i.e., from September 29, 2019 to September 30, 2019) and became our Executive Chairman on October 1, 2019, the position in which he served for the remainder of fiscal year 2020. Accordingly, his compensation as reported in the Summary Compensation Table represents his compensation for both roles. |
| (3) | For fiscal year 2020, Mr. Egeck received a prorated base salary of $654,987. |
| (4) | Mr. Egeck received an award of profits interest units in our Parent, and the amount reflects the aggregate grant date fair value of these profits interest units, computed in accordance with FASB ASC Topic 718 and based on the valuation assumptions described in Note 14 to our consolidated financial statements included elsewhere in this prospectus. |
| (5) | Ms. Baker joined us in November 2019 as our Chief Performance Officer (originally titled Chief People Officer) and transitioned to the role of Chief Revenue Officer in March 2020. |
| (6) | Ms. Baker received a sign-on bonus of $75,000 in connection with commencement of her employment. |
| (7) | Ms. Baker received an award of profits interest units in our Parent, and the amount reflects the aggregate grant date fair value of these profits interest units, computed in accordance with |
96
| FASB ASC Topic 718 and based on the valuation assumptions described in Note 14 to our consolidated financial statements included elsewhere in this prospectus. |
GRANTS OF PLAN-BASED AWARDS IN FISCAL YEAR 2020
The following table sets forth equity and non-equity incentive plan awards granted to our named executive officers in fiscal year 2020. Under SEC rules, the values reported in the “Grant Date Fair Value of Stock Awards” column reflect the grant date fair value of grants of stock awards determined under accounting standards, as discussed above.
| Estimated Future Payouts Under Non- Equity Incentive Plans1 |
||||||||||||||||||||||||
| Name |
Grant Date |
Target ($) |
Maximum ($) |
All Other Option Awards: Number of Securities Underlying Options (#)2 |
Exercise Price of Option Awards ($/Sh)3 |
Grant Date Fair Value of Option Awards ($)4 |
||||||||||||||||||
| Steven L. Ortega |
— | 350,000 | 700,000 | |||||||||||||||||||||
|
|
|
|
|
|
|
|||||||||||||||||||
| Michael R. Egeck |
— | 654,987 | 1,309,974 | |||||||||||||||||||||
| 2/4/2020 | 3,935,675 | N/A | 7,179,102 | |||||||||||||||||||||
|
|
|
|
|
|
|
|
|
|
|
|
|
|||||||||||||
| Steven M. Weddell |
— | 450,000 | 900,000 | |||||||||||||||||||||
|
|
|
|
|
|
|
|||||||||||||||||||
| Paula F. Baker |
— | 163,612 | 327,224 | |||||||||||||||||||||
|
|
|
|
|
|
|
|
|
|
|
|
|
|||||||||||||
| 11/21/2019 | 375,000 | N/A | 633,750 | |||||||||||||||||||||
|
|
|
|
|
|
|
|
|
|||||||||||||||||
| (1) | Represents target and maximum annual cash incentive award opportunities. The target amount is based upon achievement of the EBITDA targets listed in “Annual Cash Bonus Opportunities.” The actual amounts earned by each NEO are set forth in the Summary Compensation Table. |
| (2) | The equity awards disclosed in this table are incentive units in our then parent company, which are intended to be treated as profits interests for U.S. federal income tax purposes. For more information on the incentive units, see “Long Term Equity Incentives” above. Despite the fact that the incentive units do not require the payment of an exercise price or have an option expiration date, we believe they are economically similar to stock options and, as such, they are reported in this table as “Option” awards. All outstanding incentive units were cancelled in connection with the IPO and restricted stock units were granted in respect of any unvested incentive units, as described under “Long Term Equity Incentives” above. |
| (3) | These awards are not traditional options, and therefore, there is no exercise price or expiration date associated with them. As the incentive units were intended to be treated as “profits interests” for U.S. federal income tax purposes, each was granted with the distribution threshold necessary to result in a liquidation value of $0. |
| (4) | The grant date fair value (computed in accordance with FASB ASC Topic 718) is generally the amount that the Company would expense in its financial statements over the award’s service period, but does not include a reduction for forfeitures. This does not represent the actual value that may be realized by an NEO upon settlement of the award. |
97
OUTSTANDING EQUITY AWARDS AT FISCAL YEAR-END
The following table summarizes equity awards held by our named executive officers as of fiscal year 2020. Our named executive officers each held an indirect ownership stake in the Company by holding incentive units in our then parent company.
| Option Awards(1) |
||||||||||||||||||||
| Name |
Number of Securities Underlying Unexercised Options (#) Exercisable |
Number of Securities Underlying Unexercised Options (#) Unexercisable |
Number of Securities Underlying Unexercised Unearned Options (#) |
Option Exercise Price ($)(2) |
Option Expiration Date |
|||||||||||||||
| Steven L. Ortega |
1,414,064 | 249,541 | (3) | 215,288 | (4) | N/A | N/A | |||||||||||||
| Michael R. Egeck |
1,913,176 | 1,147,906 | (5) | 874,594 | (4) | N/A | N/A | |||||||||||||
| Steven M. Weddell |
1,060,548 | 187,156 | (6) | — | N/A | N/A | ||||||||||||||
| Paula F. Baker |
150,000 | 225,000 | (7) | — | N/A | N/A | ||||||||||||||
| (1) | The equity awards disclosed in this table are incentive units in our then parent company, which were intended to be treated as profits interests for U.S. federal income tax purposes. For more information on the incentive units, see “Long Term Equity Incentives” above. Despite the fact that the incentive units do not require the payment of an exercise price or have an option expiration date, we believe they are economically similar to stock options and, as such, they are reported in this table as “Option” awards. Awards reflected as “Unexercisable” are time-vesting incentive units that have not yet vested. Awards reflected as “Unearned” are performance-vesting incentive units that have not yet vested and will not have vested as of completion of our IPO. Awards reflected as “Exercisable” are incentive units that have vested (or will vest in connection with our IPO) but remain outstanding. All incentive units were cancelled in connection with the consummation of our IPO and were replaced with restricted stock units, as described in “Compensation Discussion and Analysis—Elements of Compensation—Restricted Stock Unit Awards and Stock Options.” |
| (2) | These awards are not traditional options, and therefore, there is no exercise price or expiration date associated with them. As the incentive units were intended to be treated as “profits interests” for U.S. federal income tax purposes, each was granted with the distribution threshold necessary to result in a liquidation value of $0. |
| (3) | These incentive units were scheduled to vest on April 21, 2021, so long as Mr. Ortega remained continuously employed by our then parent company or any of its affiliates through that date. |
| (4) | These incentive units were scheduled to vest upon key investors in our then prior parent company receiving a certain level of returns on their investment in our then parent company and its subsidiaries, including the Company. |
| (5) | 12.5% of these incentive units were scheduled to vest on each six-month anniversary of August 4, 2020, in each case, so long as Mr. Egeck remained continuously employed by our then parent company or any of its affiliates through the applicable vesting date. |
| (6) | These incentive units were scheduled to vest on April 21, 2021, so long as Mr. Weddell remained continuously employed by our then parent company or any of its affiliates through that date. |
| (7) | 25% of these incentive units were scheduled to vest on each anniversary of November 21, 2019, in each case, so long as Ms. Baker remained continuously employed by our then parent company or any of its affiliates through the applicable vesting date. |
98
OPTION EXERCISES AND STOCK VESTED
No options were exercised or stock vested during the 2020 fiscal year.
POTENTIAL PAYMENTS UPON TERMINATION OR CHANGE IN CONTROL
Each of our named executive officers is eligible to receive certain payments or benefits upon a termination of employment or in connection with a change in control pursuant to their individual arrangements.
In the event of a termination by the Company without “cause” or by the named executive officer for “good reason” (each as defined in his respective employment agreement), each of Messrs. Ortega and Weddell is generally eligible to receive an amount equal to two times the sum of his base salary and target bonus, payable in a lump sum within 14 days after the date of termination (together with certain other payments), as well as reimbursement for his COBRA premiums for up to 18 months post-termination and up to 6 months of outplacement and transition services, and Mr. Egeck is entitled to receive an amount equal to 100% of his base salary, payable in equal monthly installments over the 12-month period following his termination. Each of Messrs. Egeck and Weddell must execute a release of claims in favor of the Company as a condition to receipt of severance.
Ms. Baker participates in our 2019 Executive Severance Plan (the “ESP”), pursuant to which, upon a termination of her employment by the Company without “cause” (as defined in the ESP), she will receive a minimum of 6 months of continued base salary payments, subject to her execution of a release of claims against the Company.
The following table sets forth a summary of the payments and benefits that the named executive officers would have been eligible to receive had they experienced a qualifying termination as of October 3, 2020 had a qualifying transaction occurred on October 3, 2020:
| Name |
Potential Payment on Change of Control ($) |
Potential Payment on Voluntary Termination or Termination for Cause ($) |
Potential Payment on Involuntary Termination (Without Cause) or Termination by Executive for Good Reason ($) |
|||||||||
| Steven L. Ortega |
||||||||||||
| Cash Severance |
— | — | 2,704,500 | |||||||||
| COBRA Reimbursement |
— | — | 24,738 | |||||||||
| Total |
— | — | 2,729,238 | |||||||||
|
|
|
|
|
|
|
|||||||
| Michael R. Egeck |
||||||||||||
| Cash Severance |
— | — | 1,750,000 | |||||||||
| COBRA Reimbursement |
— | — | — | |||||||||
| Total |
— | — | 1,750,000 | |||||||||
| Steven M. Weddell |
||||||||||||
| Cash Severance |
— | — | 1,804,500 | |||||||||
| COBRA Reimbursement |
— | — | 40,212 | |||||||||
| Total |
— | — | 1,844,712 | |||||||||
|
|
|
|
|
|
|
|||||||
| Paula F. Baker |
||||||||||||
| Cash Severance |
— | — | 200,000 | |||||||||
| COBRA Reimbursement |
— | — | — | |||||||||
| Total |
— | — | 200,000 | |||||||||
99
PRINCIPAL AND SELLING STOCKHOLDERS
The following table presents information concerning the beneficial ownership of the shares of our common stock as of the date of this prospectus by (1) each person known by us to beneficially own more than 5% of the outstanding shares of our common stock, (2) each of our directors and named executive officers, (3) all of our directors and executive officers as a group and (4) the other parties who are selling stockholders in this offering. The table also contains information about beneficial ownership, as adjusted, to reflect the sale of common stock in this offering assuming 186,873,341 shares of common stock outstanding as of January 31, 2021.
Beneficial ownership is determined under the rules of the SEC and generally includes any shares over which a person exercises sole or shared voting and/or investment power over securities. The information is not necessarily indicative of beneficial ownership for any other purpose. Except in cases where community property laws apply or as indicated in the footnotes to this table, we believe that each stockholder identified in the table possesses sole voting and investment power over all shares of common stock shown as beneficially owned by the stockholder. Shares of restricted stock units that are exercisable or exercisable within 60 days of the date of this prospectus are considered outstanding and beneficially owned by the person holding the options for the purpose of computing the percentage ownership of that person but are not treated as outstanding for the purpose of computing the percentage ownership of any other person.
Unless otherwise indicated, the address of each of the individuals named below is Leslie’s, Inc., 2005 East Indian School Road, Phoenix, Arizona 85016.
| Shares of common stock beneficially owned prior to this offering |
Shares of common stock beneficially owned after this offering assuming no exercise of underwriters’ option |
Shares of common stock beneficially owned after this offering assuming full exercise of underwriters’ option |
||||||||||||||||||||||
| Name of Beneficial Owner |
Shares of common stock |
Percentage of Total Outstanding common stock (%) |
Shares of common stock |
Percentage of total outstanding common stock (%) |
Shares of common stock |
Percentage of total outstanding common stock (%) |
||||||||||||||||||
| 5% and Greater Stockholders |
||||||||||||||||||||||||
| Entities Affiliated with L Catterton(1) |
||||||||||||||||||||||||
| Explorer Investment Pte. Ltd.(2) |
||||||||||||||||||||||||
| Named Executive Officers and Directors |
||||||||||||||||||||||||
| Steven L. Ortega |
||||||||||||||||||||||||
| Michael R. Egeck |
||||||||||||||||||||||||
| Steven M. Weddell |
||||||||||||||||||||||||
| Paula R. Baker |
||||||||||||||||||||||||
| Yolanda Daniel |
||||||||||||||||||||||||
| Jodeen Kozlak |
||||||||||||||||||||||||
| Marc Magliacano |
||||||||||||||||||||||||
| Matthew Lischick |
||||||||||||||||||||||||
| Eric Kufel |
||||||||||||||||||||||||
| Susan O’Farrell |
||||||||||||||||||||||||
| John Strain |
||||||||||||||||||||||||
| All Directors and Executive Officers as a group (11 persons) |
||||||||||||||||||||||||
| * | Represents less than one percent. |
100
| (1) | All of the shares of common stock are held by Bubbles Investor Aggregator, L.P. (“Bubbles Aggregator”). C8 Management, L.L.C. is the general partner of Bubbles Aggregator, and the management of C8 Management, L.L.C. is controlled by a managing board. J. Michael Chu and Scott A. Dahnke are the members of the managing board of C8 Management, L.L.C. and as such could be deemed to share voting control and investment power over shares that may be deemed to be beneficially owned by the entities affiliated with Catterton Management Company, L.L.C., but each disclaims beneficial ownership of such shares except to the extent of his pecuniary interest therein. The address of the entities and individuals mentioned in this footnote is 599 West Putnam Avenue, Greenwich, CT 06830. |
| (2) | Explorer Investment Pte. Ltd. (the “GIC Investor”) shares the power to vote and the power to dispose of these shares with GIC Special Investments Pte. Ltd. (“GIC SI”), and GIC, both of which are private limited companies incorporated in Singapore. GIC SI is wholly owned by GIC and is the private equity investment arm of GIC. GIC is wholly owned by the Government of Singapore and was set up with the sole purpose of managing Singapore’s foreign reserves. The Government of Singapore disclaims beneficial ownership of these shares. The business address for the GIC Investor is 168 Robinson Road, #37-01 Capital Tower, Singapore 068912. |
101
General
The following description of our capital stock and certain provisions of our fifth amended and restated certificate of incorporation and amended and restated bylaws are summaries and are qualified by reference to the fifth amended and restated certificate of incorporation and the amended and restated bylaws, copies of which are incorporated by reference as exhibits to the registration statement of which this prospectus forms a part.
Our fifth amended and restated certificate of incorporation authorizes shares of common stock and undesignated preferred stock, the rights, preferences and privileges of which may be designated from time to time by our board of directors.
Our authorized capital stock consists of 1,001,000,000 shares, all with a par value of $0.001 per share, of which:
| • | 1 billion shares are designated as common stock; and |
| • | 1 million shares are designated as preferred stock. |
As of January 31, 2021, we had outstanding:
| • | 186,873,341 shares of common stock; and |
| • | no shares of preferred stock. |
As of January 31, 2021, there were approximately 21 stockholders of record, although there is a much larger number of beneficial holders. The actual number of stockholders is greater than the number of record holders stated above, and includes stockholders who are beneficial owners, but whose shares are held in “street name” by brokers and other nominees. Our board of directors is authorized, without stockholder approval except as required by the listing standards of Nasdaq, to issue additional shares of our capital stock.
Common Stock
Voting Rights
The common stock is entitled to one vote per share on any matter that is submitted to a vote of our stockholders. Holders of shares of our common stock will vote together as a single class on all matters (including the election of directors) submitted to a vote of stockholders.
Our fifth amended and restated certificate of incorporation does not provide for cumulative voting for the election of directors.
Economic Rights
Except as otherwise expressly provided in our fifth amended and restated certificate of incorporation or required by applicable law, all shares of our common stock have the same rights and privileges and rank equally, share ratably and be identical in all respects for all matters, including those described below.
Dividends and Distributions. Subject to preferences that may apply to any shares of preferred stock outstanding at the time, the holders of our common stock are entitled to share equally, on a per
102
share basis, in such dividends and other distributions of cash, property or shares of stock of the Company as may be declared by the board of directors from time to time with respect to the common stock out of assets or funds of the Company legally available therefor.
Liquidation Rights. On our liquidation, dissolution or winding-up, the holders of our common stock are entitled to share ratably in all assets remaining after the payment of the Company of whatever kind available for distribution to the holders of common stock.
No Preemptive or Similar Rights
Our common stock is not entitled to preemptive rights, and are not subject to conversion, redemption or sinking fund provisions.
Preferred Stock
Under our fifth amended and restated certificate of incorporation, our board of directors may, without further action by our stockholders, fix the rights, preferences, privileges and restrictions of up to an aggregate of 1 million shares of preferred stock in one or more series and authorize their issuance. These rights, preferences and privileges could include dividend rights, conversion rights, voting rights, terms of redemption, liquidation preferences and the number of shares constituting any series or the designation of such series, any or all of which may be greater than the rights of our common stock. Any issuance of our preferred stock could adversely affect the voting power of holders of our common stock, and the likelihood that such holders would receive dividend payments and payments on liquidation. In addition, the issuance of preferred stock could have the effect of delaying, deferring or preventing a change of control or other corporate action. No shares of preferred stock are outstanding. We have no present plan to issue any shares of preferred stock.
Registration Rights
In connection with the IPO, we entered into an agreement that provides that certain holders of our capital stock have certain registration rights and are subject to certain transfer restrictions. See the section titled “Certain Relationships and Related Party Transactions—Registration Rights.”
Anti-Takeover Provisions
Stockholder Action; Special Meeting of Stockholders
Our fifth amended and restated certificate of incorporation and amended and restated bylaws provide that, from and after the Trigger Event, our stockholders may not take action by written consent, but may only take action at annual or special meetings of our stockholders, provided, however, that any action required or permitted to be taken by the holders of preferred stock may be taken without a meeting, without prior notice and without a vote, to the extent expressly so provided by the applicable certificate of designation relating to such series of preferred stock. Our fifth amended and restated certificate of incorporation and our amended and restated bylaws also provide that, from and after the Trigger Event, except as otherwise required by law, special meetings of our stockholders can only be called by our chairman of the board or our board of directors.
Authorized But Unissued Shares
The authorized but unissued shares of our common stock and preferred stock are available for future issuance without stockholder approval, subject to any limitations imposed by the listing
103
standards of Nasdaq. These additional shares may be used for a variety of corporate finance transactions, acquisitions, and employee benefit plans. The existence of authorized but unissued and unreserved common stock and preferred stock could make more difficult or discourage an attempt to obtain control of us by means of a proxy contest, tender offer, merger, or otherwise.
Classified Board
Our fifth amended and restated certificate of incorporation provides that our board of directors will be classified into three classes of directors, each of which will hold office for staggered three-year terms. In addition, from and after the Trigger Event, directors may only be removed from the board of directors for cause and only by the affirmative vote of the holders of at least 662/3% in voting power of all the then-outstanding shares of stock of the Company entitled to vote thereon, voting together as a single class. The existence of a classified board could delay a potential acquirer from obtaining majority control of our board of directors, and the prospect of that delay might deter a potential acquirer. See the section titled “Management—Composition of the Board of Directors and Election of Directors.”
Board of Directors Vacancies
Our fifth amended and restated certificate of incorporation and amended and restated bylaws authorize only our board of directors to fill vacant directorships, including newly created seats. In addition, the number of directors constituting our board of directors is permitted to be set only by a resolution adopted by a majority vote of our entire board of directors. These provisions would prevent a stockholder from increasing the size of our board of directors and then gaining control of our board of directors by filling the resulting vacancies with its own nominees. This will make it more difficult to change the composition of our board of directors and will promote continuity of management.
Advance Notice Requirements for Stockholder Proposals and Director Nominations
Our amended and restated bylaws provide advance notice procedures for stockholders seeking to bring business before our annual meeting of stockholders or to nominate candidates for election as directors at our annual meeting of stockholders. Our amended and restated bylaws also specify certain requirements regarding the form and content of a stockholder’s notice. These provisions might preclude our stockholders from bringing matters before our annual meeting of stockholders or from making nominations for directors at our annual meeting of stockholders if the proper procedures are not followed. We expect that these provisions may also discourage or deter a potential acquirer from conducting a solicitation of proxies to elect the acquirer’s own slate of directors or otherwise attempting to obtain control of our company.
No Cumulative Voting
The DGCL provides that stockholders are not entitled to cumulate votes in the election of directors unless a corporation’s certificate of incorporation provides otherwise. Our fifth amended and restated certificate of incorporation does not provide for cumulative voting.
Amendment of Charter and Bylaws Provisions
From and after the Trigger Event, amendments to certain provisions of our fifth amended and restated certificate of incorporation regarding the amendment of our fifth amended and restated certificate of incorporation, the composition and authority of our board of directors, the election and
104
removal of directors, limitations of director liability, stockholder meetings, corporate opportunities, choice of forum and the interpretation of our fifth amended and restated certificate of incorporation will require the affirmative vote of the holders of at least 662/3% in voting power of all the then-outstanding shares of stock of the Company entitled to vote thereon, voting together as a single class. Our amended and restated bylaws authorize the board of directors to amend our bylaws without the assent or vote of shareholders, provided that, from and after the Trigger Event, stockholders may amend the bylaws with the affirmative vote of the holders of at least 662/3% in voting power of all the then-outstanding shares of stock of the Company entitled to vote thereon, voting together as a single class.
Choice of Forum
Our fifth amended and restated certificate of incorporation provides that the Court of Chancery of the State of Delaware will be, to the fullest extent permitted by law, the exclusive forum for the following types of actions or proceedings under Delaware statutory or common law: (i) any derivative action or proceeding brought on our behalf; (ii) any action asserting a breach of fiduciary duty owed by any of our directors, officers, other employees or stockholders to us or our stockholders, creditors or other constituents, or a claim of aiding and abetting any such breach of fiduciary duty; (iii) any action asserting a claim against us or our directors or officers arising under the DGCL or our fifth amended and restated certificate of incorporation or the bylaws or as to which the DGCL confers jurisdiction on the Court of Chancery of the State of Delaware; (iv) any action to interpret, apply, enforce or determine the validity of our fifth amended and restated certificate of incorporation or our amended and restated bylaws; (v) any action asserting an “internal corporate claim” as that term is defined in Section 115 of the DGCL; or (vi) any action asserting a claim against us or our directors or officers that is governed by the internal affairs doctrine; provided, however, that, in the event that the Court of Chancery of the State of Delaware lacks subject matter jurisdiction over any such action or proceeding, any other state court of the State of Delaware, or if no state court of the State of Delaware has subject matter jurisdiction, the federal district court for the District of Delaware), unless we consent in writing to the selection of an alternative forum. Unless we consent in writing to the selection of an alternative forum, the federal district court for the District of Delaware shall, to the fullest extent permitted by law, be the sole and exclusive forum for the resolution of any complaint asserting a cause of action arising under the Securities Act against us or our directors or officers. Notwithstanding the foregoing, the provisions of this paragraph will not apply to suits brought to enforce any liability or duty created by the Exchange Act. Any person or entity purchasing or otherwise acquiring any interest in any shares of our capital stock shall be deemed to have notice of and to have consented to the forum provisions in the fifth amended and restated certificate of incorporation. If any action the subject matter of which is within the scope the forum provisions is filed in a court other than a court located within the State of Delaware (a “foreign action”) in the name of any stockholder, such stockholder shall be deemed to have consented to: (x) the personal jurisdiction of the state and federal courts located within the State of Delaware in connection with any action brought in any such court to enforce the forum provisions (an “enforcement action”), and (y) having service of process made upon such stockholder in any such enforcement action by service upon such stockholder’s counsel in the foreign action as agent for such stockholder.
This choice of forum provision in our fifth amended and restated certificate of incorporation may limit a stockholder’s ability to bring a claim in a judicial forum that it finds favorable for disputes with us or any of our directors, officers, or other employees, which may discourage lawsuits with respect to such claims. There is uncertainty as to whether a court would enforce such provisions, and the enforceability of similar choice of forum provisions in other companies’ charter documents has been challenged in legal proceedings. It is possible that a court could find these types of provisions to be inapplicable or unenforceable, and if a court were to find the choice of forum provision contained in the fifth amended and restated certificate of incorporation to be inapplicable or unenforceable in an action, we may incur additional costs associated with resolving such action in other jurisdictions, which could harm our business, results of operations, and financial condition.
105
Transfer Agent and Registrar
The transfer agent and registrar for our common stock is Computershare Trust Company, N.A.
Exchange
Our common stock is listed on Nasdaq under the symbol “LESL.”
106
SHARES ELIGIBLE FOR FUTURE SALE
As of January 31, 2021, we had 186,873,341 outstanding shares of common stock. Of the outstanding shares, 46,150,197 shares are freely tradable without restriction or further registration under the Securities Act. The remaining outstanding shares of our common stock are restricted securities, as defined in Rule 144. Certain of our stockholders may be considered affiliates.
We cannot predict what effect, if any, sales of shares of our common stock from time to time or the availability of shares of our common stock for future sale may have on the market price of our common stock. Sales of substantial amounts of common stock, including in this offering, or the perception that such sales could occur, could adversely affect prevailing market prices for our common stock and could impair our future ability to raise capital through an offering of equity securities or otherwise. See the section entitled “Risk Factors.”
Lock-up Agreements
We, our executive officers, directors and holders of substantially all of our capital stock outstanding immediately prior to our IPO agreed that, subject to certain exceptions, until April 26, 2021, which is the 180th day after the IPO, we and they will not, without the prior written consent of Goldman Sachs & Co. LLC, Morgan Stanley & Co. LLC and BofA Securities, Inc., dispose of or hedge any shares or any securities convertible into or exchangeable for shares of our capital stock. Goldman Sachs & Co. LLC, Morgan Stanley & Co. LLC and BofA Securities, Inc. may, in their sole discretion, release any of the securities subject to these lock-up agreements at any time. See “Underwriting—Lock-Up Agreements.” The underwriters intend to waive, with respect to the shares being sold in this offering, the restrictions under these lock-up agreements applicable to us and the selling stockholders for purposes of this offering. The remaining shares held by the selling stockholders and not sold in this offering will continue to be locked up under the IPO lock-up agreement. In addition, certain of the selling stockholders are subject to additional lock-up agreements set forth in the Registration Rights and Lock-up Agreement as described in “Certain Relationships and Related Party Transactions—Registration Rights—Additional Lock-up.” As a result of these contractual restrictions, shares of our common stock subject to lock-up agreements are not be eligible for sale until these agreements expire or the restrictions are waived by the representatives of the underwriters or the Company and L Catterton, as applicable. Pursuant to the terms of the Registration Rights and Lock-up Agreement, we and L Catterton agreed to waive the lock-up restrictions with respect to the filing by us of the registration statement of which this prospectus forms a part and the offer and sale by the selling stockholders of the shares in this offering.
Rule 701
In general, under Rule 701, any of an issuer’s employees, directors, officers, consultants, or advisors who purchases shares from the issuer in connection with a compensatory stock or option plan or other written agreement before the effective date of a registration statement under the Securities Act is entitled to sell such shares 90 days after such effective date in reliance on Rule 144. An affiliate of the issuer can resell shares in reliance on Rule 144 without having to comply with the holding period requirement, and non-affiliates of the issuer can resell shares in reliance on Rule 144 without having to comply with the current public information and holding period requirements.
The SEC has indicated that Rule 701 will apply to typical options granted by an issuer before it becomes subject to the reporting requirements of the Exchange Act, along with the shares acquired upon exercise of such options, including exercises after an issuer becomes subject to the reporting requirements of the Exchange Act.
107
Registration Statement on Form S-8
We have filed with the SEC a registration statement on Form S-8 under the Securities Act covering the shares of common stock reserved for issuance under our 2020 Incentive Award Plan. That registration statement was effective upon filing. Upon effectiveness, the shares of common stock covered by that registration statement were eligible for sale in the public market, subject to any vesting restrictions and limitations on exercise under the 2020 Incentive Award Plan, the lock-up agreements and Rule 144 restrictions described below.
Rule 144
All shares of our common stock held by our “affiliates,” as that term is defined in Rule 144 under the Securities Act, generally may be sold in the public market only in compliance with Rule 144. Rule 144 defines an affiliate as any person who directly or indirectly controls, or is controlled by, or is under common control with, the issuer, which generally includes our directors, executive officers, and certain other related persons.
Under Rule 144 under the Securities Act, a person (or persons whose shares are aggregated) who is deemed to be an “affiliate” of ours would be entitled to sell within any three month period a number of shares of our common stock that does not exceed the greater of (i) 1% of the then outstanding shares of our capital stock, or (ii) an amount equal to the average weekly trading volume of our common stock on Nasdaq during the four calendar weeks preceding such sale. Sales under Rule 144 are also subject to a six-month holding period and requirements relating to manner of sale, notice and the availability of current public information about us.
Rule 144 also provides that a person who is not deemed to have been an affiliate of ours at any time during the three months preceding a sale, and who has for at least six months beneficially owned shares of our common stock that are restricted securities, will be entitled to freely sell such shares of our common stock without regard to the limitations described above, subject to our compliance with Exchange Act reporting obligations for at least 90 days prior to the sale, and provided that such sales comply with the current public information requirements of Rule 144. A person who is not deemed to have been an affiliate of ours at any time during the three months preceding a sale, and who has beneficially owned for at least one year shares of our common stock that are restricted securities, will be entitled to freely sell such shares of our common stock under Rule 144 without regard to the current public information requirements of Rule 144, subject to our compliance with Exchange Act reporting obligations for at least 90 days prior to the sale.
Registration Rights
See the section titled “Certain Relationships and Related Party Transactions—Registration Rights.”
108
CERTAIN RELATIONSHIPS AND RELATED PARTY TRANSACTIONS
Other than compensation arrangements for our directors and executive officers, which are described elsewhere in this prospectus, below we describe transactions since September 29, 2018 to which we were a party or will be a party, in which:
| • | the amounts exceeded or will exceed $120,000; and |
| • | any of our directors, executive officers or holders of more than 5% of our capital stock, or any member of the immediate family of, or person sharing the household with, the foregoing persons, had or will have a direct or indirect material interest. |
Management Services Agreement
In February 2017, the Company entered into a management services agreement with affiliates of L Catterton and an affiliate of GIC in connection with the private equity sponsors’ acquisition of the Company in February 2017. The management services agreement provides that the Company will pay an annual fee to provide management and advisory service to the Company and its affiliates, including general management consulting services, support, and analysis with respect to financing alternatives and strategic planning functions. During fiscal year 2020, fiscal year 2019 and fiscal year 2018, the Company paid management fees in the amount of $4.9 million, $4.5 million and $3.2 million, respectively. The management services agreement terminated in connection with the completion of our IPO.
Operating Lease Agreement
In March 2013, the Company entered into an operating lease for its corporate headquarters with DM Ventures I, LLC. The former Chairman of the board of directors of the Company is one of the principals of DM Ventures I, LLC and holds a significant ownership position in the lessor entity. Aggregate rents paid to DM Ventures I, LLC for Leslie’s corporate headquarters were $1.9 million in fiscal year 2020, $1.6 million in fiscal year 2019 and $1.6 million in fiscal year 2018.
Indemnification Agreements
Our fifth amended and restated certificate of incorporation contains provisions limiting the liability of directors, and our amended and restated provide that we will indemnify each of our directors and officers to the fullest extent permitted under Delaware law. Our fifth amended and restated certificate of incorporation and amended and restated bylaws also provide our board of directors with discretion to indemnify our employees and other agents when determined appropriate by the board of directors. In addition, we have entered into an indemnification agreement with each of our directors and executive officers, which requires us to indemnify them. For more information regarding these agreements, see the section titled “Management—Limitations on Liability and Indemnification Matters.”
Policies and Procedures for Transactions with Related Persons
We have adopted a Related Party Transaction Policy that our executive officers, directors, nominees for election as a director, beneficial owners of more than 5% of any class of our common stock and any members of the immediate family of any of the foregoing persons are not permitted to enter into a related person transaction with us without the approval or ratification of our Audit Committee or other independent body of our board of directors. Any request for us to enter into a transaction with an executive officer, director, nominee for election as a director, beneficial owner of
109
more than 5% of any class of our common stock, or any member of the immediate family of any of the foregoing persons, in which the amount involved exceeds $120,000 and such person would have a direct or indirect interest, must be presented to our audit and risk committee or other independent body of our board of directors for review, consideration, and approval. In approving or rejecting any such proposal, our Audit Committee or other independent body of our board of directors is to consider the relevant facts of the transaction, including the risks, costs, and benefits to us and whether the transaction is on terms no less favorable than terms generally available to an unaffiliated third party under the same or similar circumstances.
Registration Rights
Pursuant to the terms of a Registration Rights and Lock-up Agreement (as may be amended from time to time, the “Registration Rights and Lock-up Agreement”) between us and certain holders of our common stock, including affiliates of L Catterton and the GIC Investor, certain holders of our common stock are entitled to demand and piggyback registration rights. The stockholders who are a party to the Registration Rights and Lock-up Agreement hold an aggregate of approximately 75% of our issued and outstanding common stock as of January 31, 2021. We will be required to pay the registration expenses of L Catterton and the GIC Investor, other than any underwriting discounts and commissions applicable to the shares sold for each of their accounts and any transfer taxes payable by them on the sale of their shares pursuant to any such registration.
Demand Registrations. Under the Registration Rights and Lock-Up Agreement, each of L Catterton and the GIC Investor are able to require us to file a registration statement (a “Demand Registration”) under the Securities Act and we are required to notify holders of such securities in the event of such request (a “Demand Registration Request”). L Catterton and the GIC Investor may each issue up to two Demand Registration Requests for long-form underwritten registrations on Form S-1 and unlimited Demand Registration Requests for short-form underwritten registrations on Form S-3 and take down offerings off of a shelf registration statement. All eligible holders will be entitled to participate in any Demand Registration upon proper notice to us and we are required to use our best efforts to effect such registration in accordance with the terms of the Demand Registration Request, subject to the Additional Lock-up (as defined below) and certain rights we have to delay or postpone such registration.
Piggyback Registrations. Under the Registration Rights and Lock-up Agreement, if at any time we propose or are required to register any of our equity securities under the Securities Act (other than a Demand Registration or pursuant to an employee benefit or dividend reinvestment plan) (a “piggyback registration”), we will be required to notify each eligible holder of its right to participate in such registration. We will use reasonable best efforts to cause all eligible securities requested to be included in the registration in accordance with the Registration Rights and Lock-up Agreement to be so included, subject to the Additional Lock-up. We have the right to withdraw or postpone a registration statement in which eligible holders have elected to exercise piggyback registration rights, and eligible holders are entitled to withdraw their registration requests prior to the execution of an underwriting agreement or custody agreement with respect to any such registration.
Additional Lock-up. Under the Registration Rights and Lock-up Agreement, eligible holders, including L Catterton and the GIC Investor, will be subject to lock-up provisions under which they will agree not to sell or otherwise transfer their shares for a period of 90 days following the date of the final prospectus for this offering or 180 days following the date of the final prospectus for our IPO, subject to limited waivers and exceptions. Following the expiration of such 180-day lock-up period, certain eligible holders will not be permitted to sell or otherwise transfer their shares for an additional 540 days thereafter (the “Additional Lock-up”), subject to limited waivers and exceptions, including an exception
110
permitting either L Catterton or the GIC Investor to initiate a sale of shares and a limited waiver for all other eligible holders to sell up to a pro rata amount calculated on the basis of the number of shares requested to be sold by L Catterton and the GIC Investor, collectively, as compared to the entire number of shares held by L Catterton and the GIC Investor, collectively, at the closing of our IPO. This summary is qualified in its entirety by reference to the Registration Rights and Lock-Up Agreement incorporated by reference as exhibits to the registration statement of which this prospectus forms a part.
Director Designation Agreement
In connection with the IPO, we entered into a Director Designation Agreement between us and Bubbles Investor Aggregator, L.P. (“Bubbles Investor”), an affiliate of L Catterton. Pursuant to the terms of this agreement, among other things, we are required to take all necessary and desirable actions (including calling meetings of our board of directors and shareholder meetings and recommending, supporting and soliciting proxies) such that, for so long as the specified conditions in the agreements are satisfied, Bubbles Investor or its affiliates (including L Catterton) will have the right, but not the obligation, to designate for nomination or appointment either one or two directors to our board of directors (with such number being determined in accordance with the agreement based on the satisfaction of certain conditions therein). The agreement stipulates that in the event of vacancy of any of the directors appointed pursuant to the Director Designation Agreement, Bubbles Investor will be entitled to designate an individual to fill such vacancies. Each of the directors appointed pursuant to the Director Designation Agreement may, but will not be required to, qualify as independent pursuant to the Nasdaq listing standards.
This summary is qualified in its entirety by reference to the Director Designation Agreement incorporated by reference as exhibits to the registration statement of which this prospectus forms a part.
111
CERTAIN MATERIAL UNITED STATES FEDERAL INCOME TAX CONSIDERATIONS
The following is a summary of certain United States federal income tax consequences relevant to non-United States holders’ (as defined below) purchase, ownership, and disposition of our common stock issued pursuant to this offering, but does not purport to be a complete analysis of all the potential tax considerations relating thereto. This summary is based upon the provisions of the Code, Treasury regulations promulgated or proposed thereunder, judicial decisions, and published rulings and administrative pronouncements of the United States Internal Revenue Service (the “IRS”), in each case in effect as of the date hereof. These authorities may be changed, possibly with retroactive effect, so as to result in United States federal income tax consequences different from those set forth below. We have not sought, and will not seek, any rulings from the IRS regarding the matters discussed below, and there can be no assurance that the IRS will not take a position contrary to those discussed below or that any position taken by the IRS will not be sustained.
This summary is limited to non-United States holders who purchase our common stock pursuant to this offering and who hold shares of our common stock as capital assets within the meaning of Section 1221 of the Code (generally, property held for investment purposes). This summary does not address the tax consequences arising under the laws of any United States state or local or non-United States jurisdiction or under United States federal gift and estate tax laws or the effect, if any, of the alternative minimum tax, the base erosion and anti-abuse tax, the Medicare contribution tax imposed on net investment income, or the requirements of Section 451 of the Code with respect to conforming the timing of income accruals to financial statements. In addition, this discussion does not address tax considerations applicable to a non-United States holder’s particular circumstances or to a non-United States holder that may be subject to special tax rules, including, without limitation:
| • | banks, insurance companies, or other financial institutions; |
| • | pass-through entities or investors therein; |
| • | tax-exempt organizations or governmental organizations; |
| • | controlled foreign corporations, passive foreign investment companies, and corporations that accumulate earnings to avoid United States federal income tax; |
| • | brokers or dealers in securities or currencies; |
| • | traders in securities that elect to use a mark-to-market method of accounting for their securities holdings; |
| • | United States expatriates and former citizens or former long-term residents of the United States; |
| • | persons who hold our common stock as a position in a hedging transaction, “straddle,” “conversion transaction,” or other risk reduction transaction; |
| • | persons who hold or receive our common stock pursuant to the exercise of any employee stock option or otherwise as compensation; |
| • | tax-qualified retirement plans; |
| • | “qualified foreign pension funds” (within the meaning of Section 897(l)(2) of the Code) and entities all of the interest which are held by qualified foreign pension funds; |
| • | “qualified shareholders” (within the meaning of Section 897(k)(3) of the Code) or investors therein; |
| • | persons deemed to sell our common stock under the constructive sale provisions of the Code; and |
| • | persons who actually or constructively own more than 5% of our common stock. |
112
In addition, if a partnership (including an entity or arrangement classified as a partnership for United States federal income tax purposes) holds our common stock, the tax treatment of a partner generally will depend on the status of the partner and upon the activities of the partner and the partnership. Accordingly, partnerships that hold our common stock, and partners in such partnerships, are urged to consult their tax advisors.
YOU ARE URGED TO CONSULT YOUR TAX ADVISOR WITH RESPECT TO THE APPLICATION OF THE UNITED STATES FEDERAL INCOME TAX LAWS TO YOUR PARTICULAR SITUATION, AS WELL AS ANY TAX CONSEQUENCES OF THE PURCHASE, OWNERSHIP, AND DISPOSITION OF OUR COMMON STOCK ARISING UNDER THE UNITED STATES FEDERAL ESTATE OR GIFT TAX RULES, UNITED STATES ALTERNATIVE MINIMUM TAX RULES, OR UNDER THE LAWS OF ANY NON-UNITED STATES, STATE, OR LOCAL TAXING JURISDICTION OR UNDER ANY APPLICABLE INCOME TAX TREATY.
Non-United States Holder Defined
For purposes of this discussion, you are a “non-United States holder” if you are a beneficial owner of our common stock and you are neither a “United States person” nor an entity or arrangement classified as a partnership for United States federal income tax purposes. A United States person is any person that, for United States federal income tax purposes, is or is treated as:
| • | an individual who is a citizen or resident of the United States; |
| • | a corporation or other entity taxable as a corporation created or organized in the United States or under the laws of the United States, any state thereof, or the District of Columbia; |
| • | an estate whose income is subject to United States federal income tax regardless of its source; or |
| • | a trust (x) whose administration is subject to the primary supervision of a United States court and which has one or more “United States person” (as defined in the Code) who have the authority to control all substantial decisions of the trust or (y) which has made an election under applicable Treasury regulations to be treated as a United States person for United States federal income tax purposes. |
Distributions
As described under “Dividend Policy” in this prospectus, we do not currently expect to make any distributions for the foreseeable future. However, subject to the discussions below regarding FATCA and backup withholding, if we do make distributions of cash or property on our common stock, other than certain pro rata distributions of common stock, those distributions generally will constitute dividends for United States federal income tax purposes to the extent paid from our current or accumulated earnings and profits, as determined under United States federal income tax principles. To the extent distributions exceed both our current and our accumulated earnings and profits, they will first constitute a return of capital and will reduce your adjusted tax basis in our common stock, but not below zero, and then any excess will be treated as capital gain from the sale of our common stock, subject to the tax treatment described below in “—Gain on Sale or Other Taxable Disposition of Common Stock.”
Any dividend paid to you generally will be subject to United States federal withholding tax at a rate of 30% of the gross amount of the dividend, or such lower rate as may be specified by an applicable income tax treaty, except to the extent that the dividends are effectively connected with your conduct of a trade or business within the United States, as described below. In order to claim any treaty benefits to which you are entitled, you must provide us or our paying agent with a properly
113
completed IRS Form W-8BEN or W-8BEN-E (or other appropriate form) certifying your qualification for the reduced treaty rate. If you do not timely furnish the required documentation, but are otherwise eligible for a reduced rate of United States federal withholding tax pursuant to an income tax treaty, you may obtain a refund of any excess amounts withheld by timely filing an appropriate claim for refund with the IRS. If you hold our common stock through a financial institution or other agent acting on your behalf, you will be required to provide appropriate documentation to the agent, who then will be required to provide certification to us or our paying agent, either directly or through other intermediaries.
We may withhold up to 30% of the gross amount of the entire distribution even if greater than the amount constituting a dividend, as described above, to the extent provided for in the Treasury Regulations. If tax is withheld on the amount of a distribution in excess of the amount constituting a dividend, then you may be entitled to a refund of any such excess amounts if a claim for refund is timely filed with the IRS.
Dividends received by you that are effectively connected with your conduct of a trade or business within the United States (and, if an applicable income tax treaty requires, attributable to a permanent establishment or fixed base maintained by you in the United States) are exempt from the United States federal withholding tax described above. In order to claim this exemption, you must provide us or our paying agent with an IRS Form W-8ECI (or appropriate successor form) properly certifying that the dividends are effectively connected with your conduct of a trade or business within the United States. Such effectively connected dividends, although not subject to United States federal withholding tax, are generally taxed at the same graduated United States federal income tax rates applicable to United States persons (unless an applicable income tax treaty provides otherwise), net of certain applicable deductions. In addition, if you are a corporate non-United States holder, you may also be subject to a branch profits tax at a rate of 30% (or such lower rate as may be specified by an applicable income tax treaty) on your effectively connected earnings and profits for the taxable year that are attributable to such dividends, as adjusted for certain items.
Gain on Sale or Other Taxable Disposition of Common Stock
Subject to the discussions below regarding FATCA and backup withholding, you generally will not be subject to United States federal income tax (including withholding thereof) on any gain realized upon the sale or other taxable disposition of our common stock unless:
| • | the gain is effectively connected with your conduct of a United States trade or business (and, if an applicable income tax treaty requires, the gain is attributable to a permanent establishment or fixed base maintained by you in the United States); |
| • | you are an individual who is present in the United States for a period or periods aggregating 183 days or more during the taxable year in which the sale or disposition occurs and certain other conditions are met; or |
| • | our common stock constitutes a United States real property interest by reason of our status as a “United States real property holding corporation,” (a “USRPHC”), for United States federal income tax purposes, at any time during the shorter of the five-year period ending on the date of the sale or other taxable disposition of, or your holding period for, our common stock. |
If you are a non-United States holder described in the first bullet above, you generally will be subject to United States federal income tax on the gain derived from the sale or other taxable disposition (net of certain deductions or credits) under regular graduated United States federal income tax rates generally applicable to United States persons (unless an applicable income tax treaty
114
provides otherwise), and corporate non-United States holders described in the first bullet above also may be subject to the “branch profits tax” described above in the section entitled “—Distributions.”
If you are an individual non-United States holder described in the second bullet above, you will be subject to United States federal income tax at a rate of 30% (or such lower rate as may be specified by an applicable income tax treaty) on the gain derived from the sale or other taxable disposition, which may be offset by certain United States source capital losses recognized in the same taxable year (even though you are not considered a resident of the United States), provided that you have timely filed U.S. federal income tax returns with respect to such losses.
With respect to the third bullet above, we believe that we are not currently and (based upon our projections as to our business) will not become a USRPHC.
Backup Withholding and Information Reporting
Payments of dividends on our common stock will not be subject to backup withholding, provided you either certify your non-United States status, such as by furnishing a valid IRS Form W-8BEN, W-8BEN-E, or W-8ECI (or other applicable form), or otherwise establish an exemption. However, information returns are required to be filed with the IRS in connection with any distributions on our common stock paid to you, regardless of whether such distributions constitute dividends or whether any tax was actually withheld. In addition, proceeds of the sale or other taxable disposition of our common stock within the United States or conducted through certain United States-related brokers generally will not be subject to backup withholding or information reporting, if the applicable withholding agent receives the certification described above or you otherwise establish an exemption. Proceeds of a disposition of our common stock conducted through a non-United States office of a non-United States broker generally will not be subject to backup withholding or information reporting.
Copies of information returns that are filed with the IRS may also be made available under the provisions of an applicable treaty or agreement to tax authorities in your country of residence, establishment, or organization.
Backup withholding is not an additional tax. Any amounts withheld under the backup withholding rules may be allowed credit against a non-United States holder’s United States federal income tax liability, and may entitled the non-United States holder to a refund, provided that the required information is furnished to the IRS in a timely manner.
Additional Withholding Tax on Payments Made to Foreign Accounts
Under legislation and related Treasury guidance (commonly referred to as “FATCA”), a 30% United States federal withholding tax will generally apply to any payments of dividends in respect of and, subject to the regulatory relief described below, gross proceeds from the sale or other disposition of, our common stock to (i) a “foreign financial institution” (as specifically defined in the Code and whether such foreign financial institution is the beneficial owner or an intermediary) which does not provide sufficient documentation, typically on IRS Form W-8BEN-E, evidencing either (x) an exemption from FATCA, or (y) its compliance (or deemed compliance) with FATCA (which may alternatively be in the form of compliance with an intergovernmental agreement with the United States) in a manner which avoids withholding, or (ii) a “non-financial foreign entity” (as specifically defined in the Code and whether such non-financial foreign entity is the beneficial owner or an intermediary) which does not provide sufficient documentation, typically on IRS Form W-8BEN-E, evidencing either (x) an exemption from FATCA, or (y) adequate information regarding certain substantial United States beneficial owners of such entity (if any). If a dividend payment is both subject to withholding under FATCA and subject to the withholding tax discussed above under “—Distributions,” the withholding under FATCA may be
115
credited against, and therefore reduce, such other withholding tax. Under proposed Treasury regulations that may be relied upon pending finalization, the withholding tax on gross proceeds would be eliminated and, consequently, FATCA withholding on gross proceeds is not currently expected to apply. You should consult your tax advisors regarding these rules and whether they may be relevant to your ownership and disposition of our common stock.
THE PRECEDING DISCUSSION OF UNITED STATES FEDERAL TAX CONSEQUENCES IS FOR GENERAL INFORMATION ONLY. THIS DISCUSSION IS NOT TAX ADVICE. EACH PROSPECTIVE INVESTOR IS URGED TO CONSULT ITS TAX ADVISOR REGARDING THE PARTICULAR UNITED STATES FEDERAL, STATE, AND LOCAL AND NON-UNITED STATES TAX CONSEQUENCES OF PURCHASING, HOLDING, AND DISPOSING OF OUR COMMON STOCK, INCLUDING THE CONSEQUENCES OF ANY PROPOSED CHANGE IN APPLICABLE LAWS.
116
We, the selling stockholders and the underwriters named below have entered into an underwriting agreement with respect to the shares being offered. Subject to certain conditions, each underwriter has severally agreed to purchase the number of shares indicated in the following table. Goldman Sachs & Co. LLC, Morgan Stanley & Co. LLC and BofA Securities, Inc. are the representatives of the underwriters.
| Underwriters |
Number of Shares | |||
| Goldman Sachs & Co. LLC |
||||
| Morgan Stanley & Co. LLC |
||||
| BofA Securities, Inc. |
||||
|
|
|
|||
| Total |
||||
The underwriters are committed to take and pay for all of the shares being offered, if any are taken, other than the shares covered by the option described below unless and until this option is exercised.
The underwriters have an option to buy up to an additional shares from the selling stockholders. They may exercise that option for 30 days. If any shares are purchased pursuant to this option, the underwriters will severally purchase shares in approximately the same proportion as set forth in the table above.
Commissions and Discounts
The representatives have advised us that the underwriters propose initially to offer the shares to the public at the public offering price set forth on the cover page of this prospectus and to dealers at that price less a concession not in excess of $ per share. After the initial offering, the public offering price, concession or any other term of the offering may be changed.
| Per Share | Without Option | With Option | ||||||||||
| Public offering price |
$ | $ | $ | |||||||||
| Underwriting discount |
$ | $ | $ | |||||||||
| Proceeds, before expenses, to the selling stockholder |
$ | $ | $ | |||||||||
The expenses of the offering, not including the underwriting discount, are estimated at $ million and are payable by us. We have agreed to reimburse the underwriters for certain expenses in an amount up to $ .
We and the selling stockholders have agreed to indemnify the several underwriters against certain liabilities, including liabilities under the Securities Act.
Lock-Up Agreements
We have agreed with the underwriters from the date of this prospectus through the date that is 90 days after the date of this prospectus (the “Lock-Up Period”) not to (i) offer, sell, contract to sell, pledge, grant any option to purchase, make any short sale or otherwise transfer or dispose of, directly or indirectly, or file with or confidentially submit to the SEC a registration statement under the Securities Act relating to, any securities of the Company that are substantially similar to shares of our common stock, including but not limited to any options or warrants to purchase shares of our stock or any securities that are convertible into or exchangeable for, or that represent the right to receive, stock or any such substantially similar securities, or publicly disclose the intention to make any offer, sale, pledge, disposition or filing or (ii) enter into any swap or other agreement that transfers, in whole or in
117
part, any of the economic consequences of ownership of our stock or any such other securities, whether any such transaction described in clause (i) or (ii) above is to be settled by delivery of stock or such other securities, in cash or otherwise, other than (A) the shares of our common stock to be sold in this offering, (B) any shares of stock issued by the us upon the conversion or exchange of securities convertible into or exchangeable for stock, which securities are outstanding on the date hereof, and (C) the grant of equity incentives pursuant to plans in effect as of the consummation of this offering, unless we obtain the prior written consent of the representatives of the underwriters. In connection with the IPO, we made a similar agreement with respect to the period ending 180 days after November 2, 2020.
Additionally, in connection with the IPO, our officers, directors and holders of substantially all of our common stock, including the selling stockholders in this offering, agreed that, without the prior written consent of Goldman Sachs & Co. LLC, Morgan Stanley & Co. LLC and BofA Securities, Inc., the representatives of the underwriters in the IPO, they will not, during the 180-day period after November 2, 2020, (i) offer, sell, contract to sell, pledge, grant any option to purchase, lend or otherwise dispose of any shares of our common stock, or any options or warrants to purchase any shares of our common stock, or any securities convertible into, exchangeable for or that represent the right to receive shares of our common stock, (ii) engage in any hedging or other transaction or arrangement or (iii) otherwise publicly announce any intention to engage in or cause any action or activity described in clause (i) or (ii) above. These restrictions are subject to certain exceptions for transfers, including customary exceptions related to open market transactions, in connection with gifts, charitable contributions or transfers to immediate family members or to any trust, beneficiary or estate of a beneficiary, in connection with transfers to partnerships, limited liability companies or other entities, transfers by operation of law, the establishment of Rule 10b5-1 plans, the grant or issuance by the company pursuant to any employee benefit plans, in connection with the exercise of stock options or other instruments, including “cashless” or “net” exercises or transfers or forfeitures to satisfy tax withholding obligations, pursuant to any third-party tender offer, merger or similar transaction, a repurchase by the company in connection with a termination of employment, or in the case of a corporation, partnership, limited liability company or other business entity, (A) transfers to limited partners, general partners, members, or holders of similar interests or to any investment holding company controlled or managed by a party subject to these restriction or (B) transfers to affiliates or other entities controlled or managed by a party subject to these restrictions or any of its affiliates, and transfers with the prior written consent of the representatives on behalf of the underwriters. In the event that, during the 180-day period after November 2, 2020, the representatives of the underwriters in the IPO release or waive, in full or in part, any prohibition set forth in the lock-up agreement for any person or entity that beneficially owns 2% of the total outstanding shares of common stock, subject to certain exceptions (a “Triggering Release”), at the time of such Triggering Release, L Catterton and GIC and their affiliates shall be entitled to concurrent releases of common stock on a pro rata basis on the same terms. The lock-up agreement entered into by L Catterton and GIC in connection with the IPO permits the pledge of such shares in connection with lending or other arrangements between third parties (or their affiliates or designees) and L Catterton and GIC or their affiliates or any similar arrangement relating to a financing arrangement for the benefit of L Catterton and GIC or their affiliates; provided, that the amount subject to such pledge shall be limited, in the aggregate, to 1% of the total outstanding shares of common stock as of the consummation of the IPO.
In connection with this offering, Goldman Sachs & Co. LLC, Morgan Stanley & Co. LLC and BofA Securities, Inc. have agreed to waive the IPO lock-up restrictions applicable to us for purposes of this offering. Also in connection with this offering, Goldman Sachs & Co. LLC, Morgan Stanley & Co. LLC and BofA Securities, Inc. have agreed to waive the lock-up restrictions with respect to the selling stockholders, which include certain of our officers and directors. This waiver relates only to the sale of shares in this offering and becomes effective at the time of pricing of this offering. The IPO lock-up
118
restrictions, including those applicable to the selling stockholders, will otherwise continue until the expiration of the original 180-day period, ending April 26, 2021.
Our common stock is listed on Nasdaq under the symbol “LESL.”
Price Stabilization and Short Positions
In connection with the offering, the underwriters may purchase and sell shares of common stock in the open market. These transactions may include short sales, stabilizing transactions, and purchases to cover positions created by short sales. Short sales involve the sale by the underwriters of a greater number of shares than they are required to purchase in the offering, and a short position represents the amount of such sales that have not been covered by subsequent purchases. A “covered short position” is a short position that is not greater than the amount of additional shares for which the underwriters’ option described above may be exercised. The underwriters may cover any covered short position by either exercising their option to purchase additional shares or purchasing shares in the open market. In determining the source of shares to cover the covered short position, the underwriters will consider, among other things, the price of shares available for purchase in the open market as compared to the price at which they may purchase additional shares pursuant to the option described above. “Naked” short sales are any short sales that create a short position greater than the amount of additional shares for which the option described above may be exercised. The underwriters must cover any such naked short position by purchasing shares in the open market. A naked short position is more likely to be created if the underwriters are concerned that there may be downward pressure on the price of the common stock in the open market after pricing that could adversely affect investors who purchase in the offering. Stabilizing transactions consist of various bids for or purchases of common stock made by the underwriters in the open market prior to the completion of the offering.
The underwriters may also impose a penalty bid. This occurs when a particular underwriter repays to the underwriters a portion of the underwriting discount received by it because the representatives have repurchased shares sold by or for the account of such underwriter in stabilizing or short covering transactions.
Purchases to cover a short position and stabilizing transactions, as well as other purchases by the underwriters for their own accounts, may have the effect of preventing or retarding a decline in the market price of our stock, and together with the imposition of the penalty bid, may stabilize, maintain or otherwise affect the market price of the common stock. As a result, the price of the common stock may be higher than the price that otherwise might exist in the open market. The underwriters are not required to engage in these activities and may end any of these activities at any time. These transactions may be effected on Nasdaq, in the over-the-counter market or otherwise.
The underwriters and their respective affiliates are full service financial institutions engaged in various activities, which may include sales and trading, commercial and investment banking, advisory, investment management, investment research, principal investment, hedging, market making, brokerage, and other financial and non-financial activities and services. Certain of the underwriters and their respective affiliates have provided, and may in the future provide, a variety of these services to the issuer and to persons and entities with relationships with the issuer, for which they received or will receive customary fees and expenses.
Other Relationships
In the ordinary course of their various business activities, the underwriters and their respective affiliates, officers, directors, and employees may purchase, sell or hold a broad array of investments and actively trade securities, derivatives, loans, commodities, currencies, credit default swaps, and
119
other financial instruments for their own account and for the accounts of their consumers, and such investment and trading activities may involve or relate to assets, securities and/or instruments of the issuer (directly, as collateral securing other obligations or otherwise) and/or persons and entities with relationships with the issuer. The underwriters and their respective affiliates may also communicate independent investment recommendations, market color or trading ideas and/or publish or express independent research views in respect of such assets, securities, or instruments and may at any time hold, or recommend to clients that they should acquire, long and/or short positions in such assets, securities and instruments.
Certain affiliates of Goldman Sachs & Co. LLC currently hold 100% of our Senior Unsecured Notes and a portion of our Term Loan. Further, some of the underwriters and their affiliates have engaged in, and may in the future engage in, investment banking and other commercial dealings in the ordinary course of business with us or our affiliates. They have received, or may in the future receive, customary fees and commissions for these transactions.
Selling Restrictions
Notice to Prospective Investors in the European Economic Area
In relation to each Member State of the European Economic Area, each, a Relevant State, no offer of the shares may be made to the public in that Relevant State prior to the publication of a prospectus in relation to the shares which has been approved by the competent authority in that Relevant State or, where appropriate, approved in another Relevant State and notified to the competent authority in that Relevant State, all in accordance with the Prospectus Regulation, except that offers of shares may be made to the public in that Relevant State at any time under the following exemptions under the Prospectus Regulation:
| • | to any legal entity which is a qualified investor as defined in the Prospectus Regulation; |
| • | to fewer than 150 natural or legal persons (other than qualified investors as defined in the Prospectus Regulation), subject to obtaining the prior consent of the representatives; or |
| • | in any other circumstances falling within Article 1(4) of the Prospectus Regulation; |
provided that no such offer of ordinary shares referred to above shall result in a requirement for the Company or any representative to publish a prospectus pursuant to Article 3 of the Prospectus Regulation, or supplement a prospectus pursuant to Article 23 of the Prospectus Regulation.
Each person in a Relevant State who initially acquires any shares or to whom any offer is made will be deemed to have represented, acknowledged, and agreed to and with the Company and the underwriters that it is a qualified investor within the meaning of the Prospectus Regulation.
In the case of any shares being offered to a financial intermediary as that term is used in Article 5 (1) of the Prospectus Regulation, each such financial intermediary will be deemed to have represented, acknowledged, and agreed that the shares acquired by it in the offer have not been acquired on a nondiscretionary basis on behalf of, nor have they been acquired with a view to their offer or resale to, persons in circumstances which may give rise to an offer to the public other than their offer or resale in a Relevant State to qualified investors, in circumstances in which the prior consent of the underwriters has been obtained to each such proposed offer or resale.
The Company, the underwriters and their affiliates will rely upon the truth and accuracy of the foregoing representations, acknowledgements, and agreements.
For the purposes of this provision, the expression an “offer to the public” in relation to any shares in any Relevant State means the communication in any form and by any means of sufficient
120
information on the terms of the offer and any shares to be offered so as to enable an investor to decide to purchase or subscribe for any shares, and the expression “Prospectus Regulation” means Regulation (EU) 2017/1129.
The above selling restriction is in addition to any other selling restrictions set out below.
Notice to Prospective Investors in the United Kingdom
This document is for distribution only to persons who (i) have professional experience in matters relating to investments and who qualify as investment professionals within the meaning of Article 19(5) of the Financial Services and Markets Act 2000 (Financial Promotion) Order 2005, as amended, or the Financial Promotion Order; (ii) are persons falling within Article 49(2)(a) to (d) (“high net worth companies, unincorporated associations etc.”) of the Financial Promotion Order; (iii) are outside the United Kingdom; or (iv) are persons to whom an invitation or inducement to engage in investment activity (within the meaning of Section 21 of the Financial Services and Markets Act 2000, as amended) in connection with the issue or sale of any securities may otherwise lawfully be communicated or caused to be communicated (all such persons together being referred to as “relevant persons”). This document is directed only at relevant persons and must not be acted on or relied on by persons who are not relevant persons. Any investment or investment activity to which this document relates is available only to relevant persons and will be engaged in only with relevant persons.
Notice to Prospective Investors in Canada
The shares may be sold only to purchasers purchasing, or deemed to be purchasing, as principal that are accredited investors (as defined in National Instrument 45-106 Prospectus Exemptions or subsection 73.3(1) of the Securities Act (Ontario)), and are permitted clients (as defined in National Instrument 31-103 Registration Requirements, Exemptions and Ongoing Registrant Obligations). Any resale of the shares must be made in accordance with an exemption from, or in a transaction not subject to, the prospectus requirements of applicable securities laws.
Securities legislation in certain provinces or territories of Canada may provide a purchaser with remedies for rescission or damages if this prospectus (including any amendment hereto) contains a misrepresentation, provided that the remedies for rescission or damages are exercised by the purchaser within the time limit prescribed by the securities legislation of the purchaser’s province or territory. The purchaser should refer to any applicable provisions of the securities legislation of the purchaser’s province or territory for particulars of these rights or consult with a legal advisor.
Pursuant to section 3A.3 of National Instrument 33-105 Underwriting Conflicts (NI 33-105), the underwriters are not required to comply with the disclosure requirements of NI 33-105 regarding underwriter conflicts of interest in connection with this offering.
Notice to Prospective Investors in Hong Kong
The shares have not been will not be offered or sold in Hong Kong by means of any document other than (a) to “professional investors” as defined in the Securities and Futures Ordinance (Cap. 571) of Hong Kong and any rules made thereunder or (b) in other circumstances which do not result in the document being a “prospectus” as defined in the Companies (Winding Up and Miscellaneous Provisions) Ordinance (Cap. 32) of Hong Kong or which do not constitute an offer to the public within the meaning of that Ordinance. No advertisement, invitation or document relating to the shares has been or may be issued or has been or may be in the possession of any person for the purposes of issue, whether in Hong Kong or elsewhere, which is directed at, or the contents of which are likely to be accessed or read by, the public of Hong Kong (except if permitted to do so under the securities laws
121
of Hong Kong) other than with respect to shares which are or are intended to be disposed of only to persons outside Hong Kong or only to “professional investors” as defined in the Securities and Futures Ordinance of Hong Kong and any rules made under that Ordinance.
Notice to Prospective Investors in Singapore
This prospectus has not been registered as a prospectus with the Monetary Authority of Singapore. Accordingly, this prospectus and any other document or material in connection with the offer or sale, or invitation for subscription or purchase, of shares may not be circulated or distributed, nor may shares be offered or sold, or be made the subject of an invitation for subscription or purchase, whether directly or indirectly, to persons in Singapore other than (i) to an institutional investor under Section 274 of the Securities and Futures Act, Chapter 289 of Singapore, or the SFA; (ii) to a relevant person pursuant to Section 275(1) of the SFA, or any person pursuant to Section 275(1A) of the SFA, and in accordance with the conditions specified in Section 275 of the SFA; or (iii) otherwise pursuant to, and in accordance with the conditions of, any other applicable provision of the SFA.
Where shares are subscribed or purchased under Section 275 of the SFA by a relevant person which is:
| • | a corporation (which is not an accredited investor (as defined in Section 4A of the SFA)) the sole business of which is to hold investments and the entire share capital of which is owned by one or more individuals, each of whom is an accredited investor; or |
| • | a trust (where the trustee is not an accredited investor) the sole purpose of which is to hold investments and each beneficiary of which is an individual who is an accredited investor, |
| • | securities (as defined in Section 239(1) of the SFA) of that corporation or the beneficiaries’ rights and interest (howsoever described) in that trust shall not be transferred within six months after that corporation or that trust has acquired the shares pursuant to an offer made under Section 275 of the SFA except: |
| • | to an institutional investor or to a relevant person defined in Section 275(2) of the SFA, or to any person arising from an offer referred to in Section 275(1A) or 276(4)(i)(B) of the SFA; |
| • | where no consideration is or will be given for the transfer; |
| • | where the transfer is by operation of law; |
| • | as specified in Section 276(7) of the SFA; or |
| • | as specified in Regulation 32 of the Securities and Futures (Offers of Investments) (Shares and Debentures) Regulations 2005 of Singapore. |
Singapore SFA Product Classification—In connection with Section 309B of the SFA and the CMP Regulations 2018, unless otherwise specified before an offer of shares of our common stock, we have determined, and hereby notify, all relevant persons (as defined in Section 309A(1) of the SFA), that shares of our common stock are “prescribed capital markets products” (as defined in the CMP Regulations 2018) and Excluded Investment Products (as defined in MAS Notice SFA 04-N12: Notice on the Sale of Investment Products and MAS Notice FAA-N16: Notice on Recommendations on Investment Products).
Notice to Prospective Investors in Japan
The shares have not been and will not be registered pursuant to Article 4, Paragraph 1 of the Financial Instruments and Exchange Act. Accordingly, neither the shares nor any interest therein may be offered or sold, directly or indirectly, in Japan or to, or for the benefit of, any “resident” of Japan
122
(which term as used herein means any person resident in Japan, including any corporation or other entity organized under the laws of Japan), or to others for re-offering or resale, directly or indirectly, in Japan or to or for the benefit of a resident of Japan, except pursuant to an exemption from the registration requirements of, and otherwise in compliance with, the Financial Instruments and Exchange Act and any other applicable laws, regulations and ministerial guidelines of Japan in effect at the relevant time.
Notice to Prospective Investors in Switzerland
The shares may not be publicly offered in Switzerland and will not be listed on the SIX Swiss Exchange (“SIX”), or on any other stock exchange or regulated trading facility in Switzerland. This prospectus has been prepared without regard to the disclosure standards for issuance prospectuses under art. 652a or art. 1156 of the Swiss Code of Obligations or the disclosure standards for listing prospectuses under art. 27 ff. of the SIX Listing Rules or the listing rules of any other stock exchange or regulated trading facility in Switzerland. Neither this prospectus nor any other offering or marketing material relating to the shares or the offering may be publicly distributed or otherwise made publicly available in Switzerland.
Neither this prospectus nor any other offering or marketing material relating to the offering, the Company or the shares have been or will be filed with or approved by any Swiss regulatory authority. In particular, this prospectus will not be filed with, and the offer of shares will not be supervised by, the Swiss Financial Market Supervisory Authority, and the offer of shares has not been and will not be authorized under the Swiss Federal Act on Collective Investment Schemes (“CISA”). The investor protection afforded to acquirers of interests in collective investment schemes under the CISA does not extend to acquirers of shares.
Notice to Prospective Investors in Australia
No placement document, prospectus, product disclosure statement or other disclosure document has been lodged with the Australian Securities and Investments Commission (the “ASIC”), in relation to this offering. This prospectus does not constitute a prospectus, product disclosure statement or other disclosure document under the Corporations Act 2001 (the “Corporations Act”) and does not purport to include the information required for a prospectus, product disclosure statement or other disclosure document under the Corporations Act.
Any offer in Australia of the shares may only be made to persons (the “Exempt Investors”) who are “sophisticated investors” (within the meaning of section 708(8) of the Corporations Act), “professional investors” (within the meaning of section 708(11) of the Corporations Act) or otherwise pursuant to one or more exemptions contained in section 708 of the Corporations Act so that it is lawful to offer the shares without disclosure to investors under Chapter 6D of the Corporations Act.
The shares applied for by Exempt Investors in Australia must not be offered for sale in Australia in the period of 12 months after the date of allotment under this offering, except in circumstances where disclosure to investors under Chapter 6D of the Corporations Act would not be required pursuant to an exemption under section 708 of the Corporations Act or otherwise or where the offer is pursuant to a disclosure document which complies with Chapter 6D of the Corporations Act. Any person acquiring shares must observe such Australian on-sale restrictions.
This prospectus contains general information only and does not take account of the investment objectives, financial situation or particular needs of any particular person. It does not contain any securities recommendations or financial product advice. Before making an investment decision, investors need to consider whether the information in this prospectus is appropriate to their needs, objectives and circumstances, and, if necessary, seek expert advice on those matters.
123
Notice to Prospective Investors in the Dubai International Financial Centre
This prospectus relates to an Exempt Offer in accordance with the Offered Securities Rules of the Dubai Financial Services Authority (the “DFSA”). This prospectus is intended for distribution only to persons of a type specified in the Offered Securities Rules of the DFSA. It must not be delivered to, or relied on by, any other person. The DFSA has no responsibility for reviewing or verifying any documents in connection with Exempt Offers. The DFSA has not approved this prospectus nor taken steps to verify the information set forth herein and has no responsibility for the prospectus. The shares to which this prospectus relates may be illiquid and/or subject to restrictions on their resale. Prospective purchasers of the shares offered should conduct their own due diligence on the shares. If you do not understand the contents of this prospectus you should consult an authorized financial advisor.
124
The validity of the shares of common stock offered hereby will be passed upon for us by Gibson, Dunn & Crutcher LLP. Certain legal matters in connection the shares of common stock offered hereby will be passed upon for the underwriters by Latham & Watkins LLP, New York, New York.
125
The consolidated financial statements of Leslie’s, Inc. as of October 3, 2020 and September 28, 2019 and for each of the three years in the period ended October 3, 2020, appearing in this prospectus and registration statement have been audited by Ernst & Young LLP, an independent registered public accounting firm, as set forth in their report thereon appearing elsewhere herein, and are included in reliance upon such report given on the authority of such firm as experts in accounting and auditing.
126
WHERE YOU CAN FIND MORE INFORMATION
We have filed with the SEC a registration statement on Form S-1 under the Securities Act with respect to the shares of common stock offered by this prospectus. This prospectus, which constitutes a part of the registration statement, does not contain all the information set forth in the registration statement, some of which is contained in exhibits to the registration statement as permitted by the rules and regulations of the SEC. For further information with respect to us and our common stock, we refer you to the registration statement, including the exhibits filed as a part of the registration statement. Statements contained in this prospectus concerning the contents of any contract or any other document are not necessarily complete. If a contract or document has been filed as an exhibit to the registration statement, please see the copy of the contract or document that has been filed. Each statement in this prospectus relating to a contract or document filed as an exhibit is qualified in all respects by the filed exhibit. The SEC maintains an internet website that contains reports and other information about issuers, like us, that file electronically with the SEC. The address of that website is www.sec.gov.
We are subject to the information reporting requirements of the Exchange Act, and we will file reports, proxy statements and other information with the SEC. These reports, proxy statements and other information will be available for inspection and copying at the public reference room and website of the SEC referred to above.
We also maintain a website at https://www.lesliespool.com/. Information contained on, or accessible through, our website is not a part of this prospectus and you should not rely on that information when making a decision to invest in our common stock.
127
INDEX TO CONSOLIDATED FINANCIAL STATEMENTS
Audited Consolidated Financial Statements for the fiscal years ended October 3, 2020, September 28, 2019 and September 29, 2018
| F-2 | ||||
| F-3 | ||||
| F-4 | ||||
| F-5 | ||||
| F-6 | ||||
| F-7 |
F-1
REPORT OF INDEPENDENT REGISTERED PUBLIC ACCOUNTING FIRM
To the Stockholders and Board of Directors of Leslie’s, Inc.
Opinion on the Financial Statements
We have audited the accompanying consolidated balance sheets of Leslie’s, Inc. (the Company) as of October 3, 2020 and September 28, 2019, the related consolidated statements of operations, stockholders’ deficit and cash flows for each of the three years in the period ended October 3, 2020, and the related notes (collectively referred to as the “consolidated financial statements”). In our opinion, the consolidated financial statements present fairly, in all material respects, the financial position of the Company at October 3, 2020 and September 28, 2019, and the results of its operations and its cash flows for each of the three years in the period ended October 3, 2020, in conformity with U.S. generally accepted accounting principles.
Adoption of New Accounting Standard
As discussed in Notes 2 and 9 to the consolidated financial statements, the Company changed its method for accounting for leases in the year ended October 3, 2020 due to the adoption of ASU No. 2016-02, Leases.
Basis for Opinion
These financial statements are the responsibility of the Company’s management. Our responsibility is to express an opinion on the Company’s financial statements based on our audits. We are a public accounting firm registered with the Public Company Accounting Oversight Board (United States) (PCAOB) and are required to be independent with respect to the Company in accordance with the U.S. federal securities laws and the applicable rules and regulations of the Securities and Exchange Commission and the PCAOB.
We conducted our audits in accordance with the standards of the PCAOB. Those standards require that we plan and perform the audit to obtain reasonable assurance about whether the financial statements are free of material misstatement, whether due to error or fraud. The Company is not required to have, nor were we engaged to perform, an audit of its internal control over financial reporting. As part of our audits we are required to obtain an understanding of internal control over financial reporting but not for the purpose of expressing an opinion on the effectiveness of the Company’s internal control over financial reporting. Accordingly, we express no such opinion.
Our audits included performing procedures to assess the risks of material misstatement of the financial statements, whether due to error or fraud, and performing procedures that respond to those risks. Such procedures included examining, on a test basis, evidence regarding the amounts and disclosures in the financial statements. Our audits also included evaluating the accounting principles used and significant estimates made by management, as well as evaluating the overall presentation of the financial statements. We believe that our audits provide a reasonable basis for our opinion.
/s/ Ernst & Young LLP
We have served as the Company’s auditor since 2000.
Phoenix, Arizona
December 23, 2020
F-2
CONSOLIDATED BALANCE SHEETS
(Amounts in Thousands, Except Share and Per Share Amounts)
| As of |
October 3, 2020 |
September 28, 2019 |
||||||
| Assets |
||||||||
| Current assets |
||||||||
| Cash and cash equivalents |
$ | 157,072 | $ | 90,899 | ||||
| Accounts and other receivables, net |
31,481 | 33,872 | ||||||
| Inventories, net |
148,966 | 149,729 | ||||||
| Prepaid expenses and other current assets |
34,614 | 7,589 | ||||||
|
|
|
|
|
|||||
| Total current assets |
372,133 | 282,089 | ||||||
| Property and equipment, net |
66,391 | 78,506 | ||||||
| Operating lease right-of-use assets |
177,655 | — | ||||||
| Goodwill and other intangibles, net |
121,186 | 117,724 | ||||||
| Deferred tax assets |
6,583 | — | ||||||
| Other assets |
2,490 | 1,402 | ||||||
|
|
|
|
|
|||||
| Total assets |
$ | 746,438 | $ | 479,721 | ||||
|
|
|
|
|
|||||
| Liabilities and stockholders’ deficit |
||||||||
| Current liabilities |
||||||||
| Accounts payable |
$ | 92,372 | $ | 68,347 | ||||
| Accrued expenses |
101,167 | 82,121 | ||||||
| Operating lease liabilities |
54,459 | — | ||||||
| Income taxes payable |
1,857 | 6,713 | ||||||
| Current portion of long-term debt |
8,341 | 8,341 | ||||||
|
|
|
|
|
|||||
| Total current liabilities |
258,196 | 165,522 | ||||||
| Deferred tax liabilities |
— | 1,240 | ||||||
| Operating lease liabilities, noncurrent |
130,234 | — | ||||||
| Long-term debt, net |
1,179,550 | 1,186,493 | ||||||
| Other long-term liabilities |
5,457 | 13,823 | ||||||
|
|
|
|
|
|||||
| Total liabilities |
1,573,437 | 1,367,078 | ||||||
|
|
|
|
|
|||||
| Commitments and contingencies |
||||||||
| Stockholders’ deficit |
||||||||
| Common stock, $0.001 par value, 156,500,000 shares authorized, issued, and outstanding at October 3, 2020 and September 28, 2019 |
157 | 157 | ||||||
| Capital deficit |
(278,063 | ) | (279,848 | ) | ||||
| Retained deficit |
(549,093 | ) | (607,666 | ) | ||||
|
|
|
|
|
|||||
| Total stockholders’ deficit |
(826,999 | ) | (887,357 | ) | ||||
|
|
|
|
|
|||||
| Total liabilities and stockholders’ deficit |
$ | 746,438 | $ | 479,721 | ||||
|
|
|
|
|
|||||
See accompanying notes which are an integral part of these consolidated financial statements.
F-3
CONSOLIDATED STATEMENTS OF OPERATIONS
(Amounts in Thousands, Except Share and Per Share Amounts)
| Fiscal Year Ended |
October 3, 2020 |
September 28, 2019 |
September 29, 2018 |
|||||||||
| Sales |
$ | 1,112,229 | $ | 928,203 | $ | 892,600 | ||||||
| Cost of merchandise and services sold |
651,516 | 548,463 | 535,464 | |||||||||
|
|
|
|
|
|
|
|||||||
| Gross profit |
460,713 | 379,740 | 357,136 | |||||||||
| Selling, general and administrative expenses |
314,338 | 258,152 | 241,669 | |||||||||
|
|
|
|
|
|
|
|||||||
| Operating income |
146,375 | 121,588 | 115,467 | |||||||||
| Other expense: |
||||||||||||
| Interest expense |
84,098 | 98,578 | 91,656 | |||||||||
| Other expenses, net |
1,089 | 7,453 | 1,759 | |||||||||
|
|
|
|
|
|
|
|||||||
| Total other expense |
85,187 | 106,031 | 93,415 | |||||||||
| Income before taxes |
61,188 | 15,557 | 22,052 | |||||||||
| Income tax expense |
2,627 | 14,855 | 4,926 | |||||||||
|
|
|
|
|
|
|
|||||||
| Net income |
$ | 58,561 | $ | 702 | $ | 17,126 | ||||||
|
|
|
|
|
|
|
|||||||
| Net income per share |
||||||||||||
| Basic and diluted |
$ | 0.37 | $ | 0.00 | $ | 0.11 | ||||||
| Weighted average shares outstanding |
||||||||||||
| Basic and diluted |
156,500,000 | 156,500,000 | 156,500,000 | |||||||||
See accompanying notes which are an integral part of these consolidated financial statements.
F-4
CONSOLIDATED STATEMENTS OF STOCKHOLDERS’ DEFICIT
(Amounts in Thousands, Except Share Amounts)
| Common Stock | Capital Deficit |
Retained Deficit |
Totals | |||||||||||||||||
| Shares | Amount | |||||||||||||||||||
| Balance, September 30, 2017 |
156,500,000 | $ | 157 | $ | (283,763 | ) | $ | (624,395 | ) | $ | (908,001 | ) | ||||||||
| Equity-based compensation |
— | — | 1,785 | — | 1,785 | |||||||||||||||
| Recovery of deemed distributions |
— | — | — | 141 | 141 | |||||||||||||||
| Net income |
— | — | — | 17,126 | 17,126 | |||||||||||||||
|
|
|
|
|
|
|
|
|
|
|
|||||||||||
| Balance, September 29, 2018 |
156,500,000 | $ | 157 | (281,978 | ) | (607,128 | ) | (888,949 | ) | |||||||||||
| Equity-based compensation |
— | — | 2,130 | — | 2,130 | |||||||||||||||
| Payment of dividend |
— | — | — | (1,240 | ) | (1,240 | ) | |||||||||||||
| Net income |
— | — | — | 702 | 702 | |||||||||||||||
|
|
|
|
|
|
|
|
|
|
|
|||||||||||
| Balance, September 28, 2019 |
156,500,000 | $ | 157 | $ | (279,848 | ) | $ | (607,666 | ) | $ | (887,357 | ) | ||||||||
| Impact of adoption of new accounting pronouncements |
— | — | — | 12 | 12 | |||||||||||||||
| Equity-based compensation |
— | — | 1,785 | — | 1,785 | |||||||||||||||
| Net income |
— | — | — | 58,561 | 58,561 | |||||||||||||||
|
|
|
|
|
|
|
|
|
|
|
|||||||||||
| Balance, October 3, 2020 |
156,500,000 | $ | 157 | $ | (278,063 | ) | $ | (549,093 | ) | $ | (826,999 | ) | ||||||||
|
|
|
|
|
|
|
|
|
|
|
|||||||||||
See accompanying notes which are an integral part of these consolidated financial statements.
F-5
CONSOLIDATED STATEMENTS OF CASH FLOWS
(Dollar Amounts in Thousands)
| Fiscal Year Ended |
October 3, 2020 |
September 28, 2019 |
September 29, 2018 |
|||||||||
| Operating activities |
||||||||||||
| Net income |
$ | 58,561 | $ | 702 | $ | 17,126 | ||||||
| Adjustments to reconcile net income to net cash provided by operating activities: |
||||||||||||
| Depreciation and amortization |
28,925 | 30,424 | 31,611 | |||||||||
| Equity-based compensation |
1,785 | 2,130 | 1,785 | |||||||||
| Amortization of deferred financing costs and debt discounts |
3,489 | 3,240 | 3,013 | |||||||||
| Provision for doubtful accounts |
577 | 463 | 259 | |||||||||
| Deferred income taxes |
(7,823 | ) | (754 | ) | 1,405 | |||||||
| Loss on disposition of assets |
785 | 1,751 | 1,057 | |||||||||
| Loss on extinguishment of debt |
— | — | 488 | |||||||||
| Changes in operating assets and liabilities: |
||||||||||||
| Accounts and other receivables |
1,813 | (5,632 | ) | (4,304 | ) | |||||||
| Inventories |
1,762 | (3,797 | ) | (4,920 | ) | |||||||
| Prepaid expenses and other current assets |
(26,912 | ) | (1,670 | ) | 289 | |||||||
| Other assets |
(1,070 | ) | 4,518 | (2,759 | ) | |||||||
| Accounts payable and accrued expenses |
39,336 | 23,832 | 2,039 | |||||||||
| Income taxes payable |
(4,856 | ) | 2,614 | (3,809 | ) | |||||||
| Operating lease assets and liabilities, net |
7,037 | — | — | |||||||||
|
|
|
|
|
|
|
|||||||
| Net cash provided by operating activities |
103,409 | 57,821 | 43,280 | |||||||||
|
|
|
|
|
|
|
|||||||
| Investing activities |
||||||||||||
| Purchases of property and equipment |
(20,630 | ) | (27,444 | ) | (28,786 | ) | ||||||
| Acquisitions, net of cash acquired |
(6,188 | ) | (9,616 | ) | (11,758 | ) | ||||||
| Proceeds from disposition of fixed assets |
7 | 64 | 325 | |||||||||
|
|
|
|
|
|
|
|||||||
| Net cash used in investing activities |
(26,811 | ) | (36,996 | ) | (40,219 | ) | ||||||
|
|
|
|
|
|
|
|||||||
| Financing activities |
||||||||||||
| Borrowings on revolving commitment |
238,750 | 190,900 | 148,400 | |||||||||
| Repayments to revolving commitment |
(238,750 | ) | (190,900 | ) | (148,400 | ) | ||||||
| Principal payments on Term Loan |
(10,425 | ) | (6,255 | ) | (23,662 | ) | ||||||
| Recovery of deemed distribution |
— | — | 141 | |||||||||
| Payment of dividend |
— | (1,240 | ) | — | ||||||||
| Payment of deferred financing costs |
— | — | (865 | ) | ||||||||
|
|
|
|
|
|
|
|||||||
| Net cash used in financing activities |
(10,425 | ) | (7,495 | ) | (24,386 | ) | ||||||
|
|
|
|
|
|
|
|||||||
| Net increase (decrease) in cash and cash equivalents |
66,173 | 13,330 | (21,325 | ) | ||||||||
| Cash and cash equivalents, beginning of period |
90,899 | 77,569 | 98,894 | |||||||||
|
|
|
|
|
|
|
|||||||
| Cash and cash equivalents, end of period |
$ | 157,072 | $ | 90,899 | $ | 77,569 | ||||||
|
|
|
|
|
|
|
|||||||
| Supplemental disclosure of cash payments for: |
||||||||||||
| Interest |
$ | 88,678 | $ | 90,478 | $ | 90,055 | ||||||
| Income taxes |
15,305 | 12,944 | 7,329 | |||||||||
|
|
|
|
|
|
|
|||||||
See accompanying notes which are an integral part of these consolidated financial statements.
F-6
NOTES TO CONSOLIDATED FINANCIAL STATEMENTS
Note 1—Business and Operations
Leslie’s, Inc. (“Leslie’s,” “we,” “our,” “us,” “its,” or the “Company”) is the leading direct-to-consumer pool and spa care brand. We market and sell pool and spa supplies and related products and services, which primarily consist of maintenance items such as chemicals, equipment and parts, cleaning accessories, as well as safety, recreational, and fitness-related products. We currently market our products through 936 company-operated locations in 37 states and e-commerce websites.
Note 2—Summary of Significant Accounting Policies
Basis of Presentation and Principles of Consolidation
We prepared the consolidated financial statements following U.S. generally accepted accounting principles (“GAAP”). The financial statements include all normal and recurring adjustments that are necessary for a fair presentation of our financial position and operating results. The consolidated financial statements include the accounts of Leslie’s, Inc. and our subsidiaries.
All significant intercompany accounts and transactions have been eliminated.
All share and per share information included in the accompanying consolidated financial statements has been retroactively adjusted to reflect a 156,500-for-1 stock split which was effected on October 23, 2020. The par value of the common stock was not adjusted as the result of the stock split.
Fiscal Periods
We operate on a fiscal calendar that results in a fiscal year consisting of a 52- or 53-week period ending on the Saturday closest to September 30th. In a 52-week fiscal year, each quarter contains 13 weeks of operations; in a 53-week fiscal year, each of the first, second and third quarters includes 13 weeks of operations and the fourth quarter includes 14 weeks of operations. References to fiscal 2020, fiscal 2019 and fiscal 2018 refer to the 53 weeks ended October 3, 2020, 52 weeks ended September 28, 2019 and 52 weeks ended September 29, 2018, respectively.
Use of Estimates in the Preparation of Financial Statements
To prepare financial statements that conform to GAAP, we make estimates and assumptions that affect the amounts reported in our financial statements and accompanying notes. Our most significant estimates relate to the allowance for doubtful accounts, inventory obsolescence reserves, vendor programs, income taxes, self-insurance, and goodwill impairment evaluations. We continually review our estimates and make adjustments as necessary, but actual results could be significantly different from what we expected when we made these estimates.
Cash and Cash Equivalents
Cash and cash equivalents include cash on hand, demand deposits, money market funds and credit and debit card transactions. Our cash balance at financial institutions may exceed the FDIC insurance coverage limit. We consider all investments with an original maturity of three months or less and money market funds to be cash equivalents. All credit card and debit card transactions that process in less than seven days are classified as cash and cash equivalents. The amounts due from financial intermediaries for these transactions classified as cash and cash equivalents totaled $157.1 million and $90.9 million at October 3, 2020 and September 28, 2019.
F-7
Fair Value Measurements
We measure certain financial instruments and other items at fair value.
To determine the fair value, we maximize the use of observable inputs and minimize the use of unobservable inputs by requiring that the most observable inputs be used when available. Observable inputs are inputs market participants would use to value an asset or liability and are developed based on market data obtained from independent sources. Unobservable inputs are inputs based on assumptions about the factors market participants would use to value an asset or liability.
The fair value hierarchy is as follows, of which the first two are considered observable and the last unobservable:
Level 1—Quoted prices in active markets for identical assets or liabilities.
Level 2—Inputs other than Level 1 that are observable for the asset or liability, either directly or indirectly, such as quoted prices for similar assets and liabilities in active markets; quoted prices for identical or similar assets or liabilities in markets that are not active; or other inputs that are observable or can be corroborated by observable market data by correlation or other means.
Level 3—Unobservable inputs that are supported by little or no market activity and that are significant to the fair value of the assets or liabilities. Value is determined using pricing models, discounted cash flow methodologies, or similar techniques and also includes instruments for which the determination of fair value requires significant judgment or estimation.
As of October 3, 2020 and September 28, 2019, we held zero and $85.5 million, respectively, in money market funds that are required to be measured at fair value on a recurring basis. These assets were determined to be Level 1 assets as they are actively traded and are classified as cash and cash equivalents.
Fair Value of Financial Instruments
We evaluate our financial assets and liabilities subject to fair value measurements on a recurring basis to determine the appropriate level of classification for each reporting period within the fair value hierarchy.
The fair value of the Term Loan due in 2023 (see Note 8), was determined to be $796.5 million at October 3, 2020 and $783.6 million at September 28, 2019. Fair value of the Senior Unsecured Notes (see Note 8) at October 3, 2020 and September 28, 2019 was estimated to be $390.0 million. These fair value estimates, determined to be Level 2, are subjective in nature and involve uncertainties and matters of judgment and therefore cannot be determined with precision. Changes in assumptions could significantly affect these estimates.
The fair value of the interest rate cap agreements (see Note 8), determined to be Level 2, and is included in other assets on the consolidated balance sheets as of October 3, 2020 and September 28, 2019. Changes in fair value of the interest rate cap are recorded in other expenses in the consolidated statement of operations.
The carrying amounts of cash and cash equivalents, accounts receivable, accounts payable, and accrued expenses approximate fair value due to the short-term maturity of these instruments.
There were no transfers between levels in the fair value hierarchy during the fiscal years ended October 3, 2020 and September 28, 2019 respectively.
F-8
Vendor Rebates
Many of our vendor arrangements provide for us to receive specified amounts of consideration when we achieve various measures. These measures generally relate to the volume level of purchases from our vendors. We generally account for vendor programs as a reduction of the prices of the vendor’s products and therefore a reduction of inventory until we sell the product, at which time we recognize such consideration as a reduction of cost of merchandise and services sold in our consolidated statement of operations. Certain programs offering advertising support are recorded as a reduction to selling, general and administrative expenses in the consolidated statement of operations. Accounts and other receivables include vendor rebate receivables of $15.9 million and $16.7 million as of October 3, 2020 and September 28, 2019, respectively.
Allowance for Doubtful Accounts
Allowance for doubtful accounts is calculated based on historical experience, counterparty credit risk, consumer credit risk and application of the specific identification method and was not material in fiscal 2020 or 2019.
Inventories, Net
Inventories are stated at the lower of cost or market. We value inventory using the weighted-average cost method. We evaluate inventory for excess and obsolescence and record necessary reserves. We provide provisions for losses related to inventories based on historical purchase cost, selling price, margin, and current business trends. When an inventory item is sold or disposed, the associated reserve is released at that time.
Property and Equipment, Net
Property and equipment are stated at cost, less accumulated depreciation and amortization. Costs of normal maintenance and repairs are charged to expense as incurred. Major replacements or improvements of property and equipment are capitalized. When items are sold or otherwise disposed of, the cost and related accumulated depreciation or amortization are removed from the accounts, and any resulting gain or loss is included in the consolidated statements of operations.
Depreciation and amortization are computed using the straight-line method. These charges are based on the following range of useful lives:
| Buildings and improvements | 5–39 years | |
| Vehicles, machinery, and equipment | 3–10 years | |
| Office furniture and equipment | 3–7 years | |
| Leasehold improvements | 5–10 years, not to exceed the lease life |
We evaluate events and changes in circumstances that could indicate carrying amounts of long-lived assets, including property and equipment, may not be recoverable. When such events or changes in circumstances occur, we assess the recoverability of long-lived assets by determining whether or not the carrying value of such assets will be recovered through undiscounted future cash flows derived from their use and eventual disposition. For purposes of this assessment, long-lived assets are grouped with other assets and liabilities at the lowest level for which identifiable cash flows are largely independent of the cash flows of other assets and liabilities. If the sum of the undiscounted future cash flows is less than the carrying amount of an asset, we record an impairment loss for the amount by which the carrying amount of the assets exceeds its fair value. We recorded an impairment charge of $0.2 million, $1.2 million and $0.7 million in fiscal 2020, 2019 and 2018, respectively. The impairment charge is recorded in selling, general and administrative expenses in the consolidated statements of operations.
F-9
Internal Use Software
Expenditures for software developed for internal use are capitalized and amortized over the estimated useful life of the asset. Our policy provides for the capitalization of external direct costs of materials and services associated with developing or obtaining internal use computer software. In addition, we also capitalize certain payroll and payroll-related costs for employees who are directly associated with internal use computer software development projects. The amount of payroll costs capitalized with respect to these employees is limited to the time directly spent on such projects. Costs associated with preliminary project stage activities, training, maintenance and all other post-implementation stage activities are expensed as incurred.
Capitalized software additions placed into service were $3.0 million and $4.0 million in fiscal 2020 and 2019, respectively. Capitalized software accumulated amortization totaled approximately $11.1 million and $8.7 million as of October 3, 2020 and September 28, 2019, respectively. Capitalized software and development costs remaining to be amortized were approximately $7.0 million and $6.4 million, as of October 3, 2020 and September 28, 2019, respectively.
Goodwill and Other Intangibles, net
Goodwill and intangible assets are recorded at cost or at their estimated fair values at the date of acquisition. We review goodwill and indefinite lived intangible assets for impairment annually (in the fourth quarter) or on an interim basis whenever events or changes in circumstances indicate the fair value of such assets may be below their carrying amount.
We may first make a qualitative assessment of whether it is more likely than not that a reporting unit’s fair value is less than its carrying value. The qualitative impairment assessment includes considering various factors including macroeconomic conditions, industry and market conditions, cost factors, a sustained share price or market capitalization decrease, and any reporting unit specific events. If it is determined through the qualitative assessment that a reporting unit’s fair value is more likely than not greater than its carrying value, the quantitative impairment assessment is not required. If the qualitative assessment indicates it is more likely than not that a reporting unit’s fair value is not greater than its carrying value, we must perform a quantitative impairment assessment. If it is determined a quantitative assessment is necessary, we would compare the fair value of the reporting unit to the respective carrying value, which includes goodwill. If the fair value of the reporting unit exceeds its carrying value, goodwill is not considered impaired. If the carrying value is higher than the fair value, the difference would be recognized as an impairment loss.
Similar to our test for impairment of goodwill, we may first make a qualitative assessment of whether it is more likely than not that an indefinite lived intangible assets’ fair value is less than its carrying value to determine whether it is necessary to perform a quantitative impairment assessment. If it is determined a quantitative assessment is necessary, we would compare their estimated fair values to their carrying values. We would recognize an impairment charge when the estimated fair value of the indefinite lived intangible asset is less than its carrying value. We annually evaluate whether the trade names continue to have an indefinite life.
Finite-lived intangible assets are amortized to reflect the pattern of economic benefits consumed. We evaluate amortizable intangible assets for potential impairment whenever events or changes in circumstances indicate that the carrying amounts of the assets may not be fully recoverable. Intangible assets useful lives are reviewed annually.
After we made our qualitative assessments it was determined that there were no impairment charges related to goodwill or other indefinite lived intangible assets during the years ended October 3, 2020 and September 28, 2019.
F-10
Income Taxes
We account for income taxes under the asset and liability method, which requires the recognition of deferred tax assets and liabilities for the future tax consequences attributable to differences between the financial statement carrying amounts and tax bases of existing assets and liabilities. Deferred tax assets, including the benefit of net operating loss and tax credit carryforwards, are evaluated based on the guidelines for realization and are reduced by a valuation allowance if it is deemed more likely than not that such assets will not be realized. We consider several factors in evaluating the realizability of our deferred tax assets, including the nature, frequency and severity of recent losses, the remaining years available for carryforwards, changes in tax laws, the future profitability of the operations in the jurisdiction, and tax planning strategies. Our judgments and estimates concerning realizability of deferred tax assets could change if any of the evaluation factors change, resulting in an increase or decrease to income tax expense in any period.
The ultimate realization of deferred tax assets can be dependent upon the generation of future taxable income during the periods in which the associated temporary differences became deductible. On a quarterly basis, we evaluate whether it is more likely than not that our deferred tax assets will be realized in the future and conclude whether a valuation allowance must be established.
We record a liability for uncertain tax positions to the extent a tax position taken or expected to be taken in a tax return does not meet certain recognition or measurement criteria. Considerable management judgment is necessary to assess the inherent uncertainties related to the interpretations of complex tax laws, regulations and taxing authority rulings, as well as to the expiration of statutes of limitations in the numerous and varied jurisdictions in which we operate. Our judgments and estimates may change as a result of the evaluation of new information, such as the outcome of tax audits or changes to or further interpretations of tax laws and regulations, resulting in an increase or decrease to income tax expense in any period. Interest and penalties accrued, if any, relating to uncertain tax positions will be recognized as a component of the income tax provision.
We determined there were no material uncertain tax positions as of October 3, 2020 and September 28, 2019.
Revenue Recognition
Revenue is recognized when control of the promised goods or services is transferred to our customer, in an amount that reflects the consideration the Company expects to be entitled to in exchange for such goods or services. Revenue from merchandise sales at retail locations is recognized at the point of sale, revenue from services are recognized when the services are rendered and revenue from e-commerce merchandise sales is generally recognized upon shipment of the merchandise. Revenue is recorded net of related discounts and sales tax. Payment from retail customers is generally at the point of sale and payment terms for commercial customers are based on the Company’s credit requirements and generally have terms of less than 60 days. When we receive payment from a consumer before the consumer has taken possession of the merchandise or the service has been performed, the amount received is recorded as deferred revenue or as a customer deposit until the sale or service is complete. We do not provide an estimated allowance for sales returns or chargebacks, as they have been determined to be immaterial. Shipping and handling are treated as costs to fulfill the contract and not a separate performance obligation. We include shipping and handling fees billed to customers as freight out income within net sales and those costs are charged to cost of merchandise and services sold.
The Company offers a customer loyalty program that provides customers with the ability to earn reward points based on their purchases. Loyalty rewards are accounted for as a separate performance obligation and deferred revenue is recorded in the amount of the transaction price allocated to the
F-11
rewards, inclusive of the impact of estimated breakage. The estimated breakage of loyalty rewards is based on historical redemption rates experienced under the loyalty program. Revenue is recognized when the rewards are redeemed, expire or based on estimated breakage. The amount of deferred revenue related to the loyalty program is included in accrued expenses and other current liabilities on the balance sheet and is not material. Prior to fiscal 2020, loyalty program revenue was recorded using the incremental cost method within cost of sales on the consolidated statements of income.
Cost of Merchandise and Services Sold
Cost of merchandise and services sold reflects the direct cost of purchased merchandise, costs to package certain chemical products, including direct materials and labor, costs to provide services, including labor and materials, as well as distribution and occupancy costs. Distribution costs include warehousing and transportation expenses, including costs associated with third-party fulfillment centers. Occupancy costs include the rent, common area maintenance, real estate taxes, and depreciation and amortization costs of all retail locations.
Selling, General and Administrative Expenses
Our selling, general and administrative expenses include selling and operating expenses at our retail locations and corporate-level general and administrative expenses. Selling and operating expenses at retail locations include payroll, bonus and benefit costs for personnel, supplies, and credit and debit card processing costs. Corporate expenses include payroll, bonus, and benefit costs for our corporate and field support functions, marketing and advertising, insurance, utilities, occupancy costs related to our corporate office facilities, professional services, and depreciation and amortization for all assets, except those related to our retail locations and distribution operations, which are included in cost of merchandise and services sold.
Advertising
We expense advertising costs as incurred. Advertising costs for fiscal 2020, 2019 and 2018 were approximately $19.4 million, $18.0 million and $21.9 million, respectively, and are shown net of cooperative advertising of $1.6 million, $1.6 million and $1.4 million for these periods, respectively.
Equity-Based Compensation
We recognize equity-based compensation expense based on the fair value of the awards at the grant date. We use the Black-Scholes model, which uses certain subjective assumptions in determining the fair value of the awards. Compensation cost is recognized ratably over the vesting period of the related equity-based compensation award. For performance based vesting awards, compensation cost is recognized taking into account the probability of our achievement of such performance targets. Forfeitures are accounted for as they occur.
Self-Insurance Reserves
We are self-insured for losses relating to workers’ compensation, general liability, and employee medical. Stop-loss coverage has been purchased to limit exposure to any material level of claims. Self-insured liabilities include our estimates of the aggregate ultimate losses and claims incurred but not reported using historical experience.
Business Combinations
We account for business combinations using the acquisition method of accounting. This method requires that the purchase price of the acquisition be allocated to the assets acquired and liabilities
F-12
assumed using the fair values determined by management as of the acquisition date. The excess of the purchase price over the amounts allocated to assets acquired and liabilities assumed is recorded as goodwill.
We use our best estimates and assumptions as part of the purchase price allocation process to accurately value assets acquired and liabilities assumed as of the acquisition date. Our estimates are inherently uncertain and subject to refinement. As a result, during the measurement period, which may be up to one year from the acquisition date, we record adjustments to the assets acquired and liabilities assumed, with the corresponding offset to goodwill to the extent we identify adjustments to the preliminary purchase price allocation. Upon the conclusion of the measurement period or final determination of the fair values of the assets acquired or liabilities assumed, whichever comes first, any subsequent adjustments are recorded in the consolidated statements of operations. Our consolidated financial statements include the results of operations from the date of acquisition for each business combination.
We expense all acquisition-related costs as incurred in selling, general and administrative expenses in the consolidated statements of operations.
Segment Reporting
Our Chief Operating Decision Maker is our Chief Executive Officer, who reviews financial information presented on a consolidated basis for purposes of allocating resources and assessing performance. We operate all of our locations in the United States and offer consumers similar products, services, and methods of distribution through our retail locations and e-commerce websites. As a result, we have a single reportable segment.
Net Income per Share
We calculate net income per share by dividing the net income or loss by the weighted average number of common shares outstanding. We had no potentially dilutive securities for any periods presented.
Recent Accounting Pronouncements
In March 2020, the Financial Accounting Standards Board (“FASB”) issued Accounting Standards Update (“ASU”) 2020-04, “Reference Rate Reform (Topic 848): Facilitation of the Effects of Reference Rate Reform on Financial Reporting” (“ASU 2020-04”). This ASU provides temporary optional expedients and exceptions to the GAAP guidance on contract modifications and hedge accounting to ease the financial reporting burdens related to the expected market transition from the London Interbank Offered Rate (LIBOR) and other interbank offered rates to alternative reference rates. This ASU is effective for all entities beginning as of its date of effectiveness, March 12, 2020. The guidance is temporary and can be applied through December 31, 2022. This ASU did not have a material impact on our consolidated financial statements.
In August 2018, the FASB issued ASU 2018-13, Fair Value Measurement (Topic 820): Disclosure Framework—Changes to the Disclosure Requirements for Fair Value Measurement. This ASU amends the Accounting Standards Codification (“ASC”) 820, Fair Value Measurement to add, remove, and modify fair value measurement disclosure requirements. The adoption of this ASU did not have a material impact on our consolidated financial statements.
In May 2017, the FASB issued ASU 2018-07, Compensation—Stock Compensation (Topic 718): Scope of Modification Accounting, which amends the scope of modification accounting for share-based payment arrangements. The adoption of this ASU did not have a material impact on our consolidated financial statements.
F-13
In June 2016, the FASB issued ASU 2016-13, Financial Instruments—Credit Losses (Topic 326): Measurement of Credit Losses on Financial Instruments, which will require entities to measure all expected credit losses for financial instruments held at the reporting date based on historical experience, current conditions and reasonable supportable forecasts. This replaces the existing incurred loss model and is applicable to the measurement of credit losses on financial instruments measured at amortized cost and also applies to some off-balance sheet credit exposures. The adoption of this ASU as of the first day of our fiscal year ending October 3, 2020 did not have a material impact on our consolidated financial statements.
In February 2016, the FASB issued ASU No. 2016-02, Leases (Topic 842). ASU No. 2016-02 requires that lessees recognize lease assets and lease liabilities on the balance sheet with an option to exclude short-term leases (leases with terms of 12 months or less). The guidance also requires disclosures about the amount, timing, and uncertainty of cash flows arising from leases.
As of the first day of our fiscal year 2020, we adopted ASU No. 2016-02 using the modified retrospective approach and elected the package of practical expedients to use in transition, which permitted us not to reassess, under the new standard, our prior conclusions about lease identification and lease classification. Additionally, we separate lease and non-lease components of contracts. The adoption resulted in the addition of $177.7 million of operating lease right-of-use assets and a corresponding $184.7 million of operating lease liabilities to our balance sheet, while eliminating deferred rent and tenant improvement allowances. The adoption but did not have a material impact on the Company’s Consolidated Statements of Operations, Consolidated Statements of Stockholders’ Deficit or Consolidated Statements of Cash Flows. See Note 9, “Leases” for additional information related to the Company’s leases.
In May 2014, the FASB issued ASU 2014-09, Revenue from Contracts with Customers (Topic 606). ASU 2014-09 is a comprehensive new revenue recognition model requiring a company to recognize revenue to depict the transfer of goods or services to a customer at an amount reflecting the consideration it expects to receive in exchange for those goods or services. In adopting ASU 2014-09 companies may use either a full retrospective or a modified retrospective approach. We adopted this ASU, under the modified retrospective approach, as of the first day of fiscal year 2020. The cumulative effect of adoption was primarily related to the change in accounting for the loyalty program, and was not material.
Note 3—Business Combinations
Fiscal 2020 Acquisition
In October 2019, we acquired the assets of a retailer of supplies and services for hot tubs, swim spas and saunas. The acquisition included six locations in the Portland area of Oregon and expanded our retail presence to 37 states. The acquisition did not have a material impact on our financial position or results of operations. Our consolidated financial statements include the results of operations of the acquisition from the date of acquisition. The goodwill resulting from the acquisition is deductible for income tax purposes. The purchase accounting for this acquisition is complete.
Fiscal 2019 Acquisition
In January 2019, we acquired a retailer of supplies and services for swimming pools, hot tubs, barbecues and fireplaces. The acquisition included nine locations in the Pacific Northwest and expanded our presence to 36 states. The acquisition did not have a material impact on our financial position or results of operations. Our consolidated financial statements include the results of operations of the acquisition from the date of acquisition. The goodwill resulting from the acquisition is deductible for income tax purposes. The purchase accounting for this acquisition is complete.
F-14
Fiscal 2018 Acquisitions
In January 2018, we completed the acquisition of a retailer of swimming pool and spa supplies, spas and above-ground pools, and related equipment. The acquisition included five locations in Pennsylvania and related warehouses and a corporate office. We also acquired the real estate related to two locations.
In May 2018, we acquired a pool and spa parts distributor in Arizona. The acquisition included inventory and assets at leased facilities located in Arizona and Tennessee.
The acquisitions did not have a material impact on our financial position or results of operations, either individually or in the aggregate. Our consolidated financial statements included the results of operations for the acquisitions from the date of each acquisition. The goodwill resulting from these acquisitions are deductible for income tax purposes. The purchase accounting for these acquisitions is complete.
Note 4—Goodwill and Other Intangibles, Net
Goodwill
The changes in the carrying amount of goodwill for fiscal 2020 and 2019 are as follows (in thousands):
| Balance, September 29, 2018 |
$ | 84,518 | ||
| Acquisitions |
4,283 | |||
| Other adjustments |
938 | |||
|
|
|
|||
| Balance, September 28, 2019 |
89,739 | |||
| Acquisitions |
3,556 | |||
|
|
|
|||
| Balance, October 3, 2020 |
$ | 93,295 | ||
|
|
|
Other Intangible Assets
Our other intangible assets are as follows as of October 3, 2020:
| Weighted Average Useful Life |
Gross Carrying Value |
Accumulated Amortization |
Net Carrying Amount |
|||||||||||||
| (In years) | (In thousands) | |||||||||||||||
| Trade name and trademarks (finite life) |
2.6 | $ | 5,540 | $ | (5,139 | ) | $ | 401 | ||||||||
| Trade name and trademarks (indefinite life) |
Indefinite | 17,750 | — | 17,750 | ||||||||||||
| Non-compete |
4.9 | 8,633 | (6,872 | ) | 1,761 | |||||||||||
| Consumer relationships |
3.8 | 17,200 | (10,118 | ) | 7,082 | |||||||||||
| Internally developed software |
2.9 | 4,000 | (3,434 | ) | 566 | |||||||||||
| Other |
1.6 | 1,000 | (958 | ) | 42 | |||||||||||
|
|
|
|
|
|
|
|||||||||||
| Total |
$ | 54,123 | $ | (26,521 | ) | $ | 27,602 | |||||||||
|
|
|
|
|
|
|
|||||||||||
Our other intangible assets are as follows as of September 28, 2019:
| Gross Carrying Value |
Accumulated Amortization |
Net Carrying Amount |
||||||||||
| (In thousands) | ||||||||||||
| Trade name and trademarks (finite life) |
$ | 5,540 | $ | (5,026 | ) | $ | 514 | |||||
| Trade name and trademarks (indefinite life) |
17,150 | — | 17,150 | |||||||||
| Non-compete |
7,733 | (6,181 | ) | 1,552 | ||||||||
| Consumer relationships |
16,200 | (8,655 | ) | 7,545 | ||||||||
| Internally developed software |
4,000 | (3,180 | ) | 820 | ||||||||
| Other |
1,000 | (925 | ) | 75 | ||||||||
|
|
|
|
|
|
|
|||||||
| Total |
$ | 51,623 | $ | (23,967 | ) | $ | 27,656 | |||||
|
|
|
|
|
|
|
|||||||
F-15
Other intangible assets amortization expense was $2.6 million, $2.5 million and $3.8 million in fiscal 2020, 2019 and 2018, respectively. Estimated future amortization of the other intangible assets for the next five years as of October 3, 2020 is as follows (in thousands):
| Fiscal Year Ended |
Amount | |||
| 2021 |
$ | 1,892 | ||
| 2022 |
1,936 | |||
| 2023 |
1,703 | |||
| 2024 |
1,065 | |||
| 2025 |
968 | |||
| Thereafter |
2,122 | |||
|
|
|
|||
| Total |
$ | 9,686 | ||
|
|
|
|||
Intangible assets also include costs associated with acquiring mailing lists for our proprietary database. As of October 3, 2020 and September 28, 2019 the gross amounts capitalized on the consolidated balance sheets for mailing lists were $1.6 million.
Note 5—Inventories, Net
| (In thousands) | ||||||||
| As of |
October 3, 2020 |
September 28, 2019 |
||||||
| Raw materials |
$ | 1,967 | $ | 1,768 | ||||
| Finished goods |
146,999 | 147,961 | ||||||
|
|
|
|
|
|||||
| Total inventories, net |
$ | 148,966 | $ | 149,729 | ||||
|
|
|
|
|
|||||
Changes in inventory excess and obsolescence reserves were as follows:
| Balance at Beginning of Period |
Additions | Deductions | Balance at End of Period |
|||||||||||||
| Charged to Costs and Expenses |
Sale or Disposal of Inventories |
|||||||||||||||
| (In Thousands) | ||||||||||||||||
| 2018 |
$ | 3,382 | $ | 1,019 | $ | (856 | ) | $ | 3,545 | |||||||
| 2019 |
$ | 3,545 | $ | 1,345 | $ | (1,268 | ) | $ | 3,622 | |||||||
| 2020 |
$ | 3,622 | $ | 2,659 | $ | (1,342 | ) | $ | 4,939 | |||||||
Note 6—Property and Equipment
Property and equipment consist of the following:
| (In thousands) | ||||||||
| As of |
October 3, 2020 |
September 28, 2019 |
||||||
| Land |
$ | 5,813 | $ | 5,813 | ||||
| Buildings and improvements |
16,148 | 15,976 | ||||||
| Vehicles, machinery, and equipment |
34,639 | 34,831 | ||||||
| Leasehold improvements |
164,501 | 166,640 | ||||||
| Office furniture, equipment, and other |
154,570 | 146,455 | ||||||
| Software and construction in process |
9,960 | 6,769 | ||||||
|
|
|
|
|
|||||
| 385,631 | 376,484 | |||||||
| Less: accumulated depreciation and amortization |
(319,240 | ) | (297,978 | ) | ||||
|
|
|
|
|
|||||
| Total |
$ | 66,391 | $ | 78,506 | ||||
|
|
|
|
|
|||||
Depreciation and amortization expense on property and equipment was $28.9 million, $27.9 million and $27.7 million in fiscal 2020, 2019 and 2018, respectively.
F-16
Software and construction in process is primarily composed of internal use software currently being developed and leasehold improvements related to new or remodeled locations where construction had not been completed by the end of the period.
Note 7—Accrued Expenses
Accrued expenses consist of the following (in thousands):
| As of |
October 3, 2020 |
September 28, 2019 |
||||||
| Accrued payroll and employee benefits |
$ | 32,420 | $ | 14,694 | ||||
| Occupancy expenses |
3,573 | 14,669 | ||||||
| Interest |
9,377 | 17,520 | ||||||
| Sales taxes |
11,164 | 9,045 | ||||||
| Self-insurance reserves |
6,518 | 6,242 | ||||||
| Customer deposits |
13,286 | 6,246 | ||||||
| All other current liabilities |
24,829 | 13,705 | ||||||
|
|
|
|
|
|||||
| Total accrued expenses |
$ | 101,167 | $ | 82,121 | ||||
|
|
|
|
|
|||||
Note 8—Long-Term Debt
The table below presents our debt obligations as of the periods presented (in thousands):
| As of |
Effective Interest Rate(1) |
October 3, 2020 |
September 28, 2019 |
|||||||||
| Term Loan—due on August 16, 2023 |
3.65 | %(2) | $ | 811,178 | $ | 821,605 | ||||||
| Senior Unsecured Notes—due on August 16, 2024 |
9.50 | %(3) | 390,000 | 390,000 | ||||||||
| ABL Credit Facility |
1.89 | %(4) | — | — | ||||||||
|
|
|
|
|
|
|
|||||||
| Total long-term debt |
1,201,178 | 1,211,605 | ||||||||||
| Less: current portion of long-term debt |
(8,341 | ) | (8,341 | ) | ||||||||
| Less: unamortized discount |
(9,348 | ) | (11,589 | ) | ||||||||
| Less: deferred financing charges |
(3,939 | ) | (5,182 | ) | ||||||||
|
|
|
|
|
|||||||||
| Long-term debt, net |
$ | 1,179,550 | $ | 1,186,493 | ||||||||
|
|
|
|
|
|||||||||
| (1) | Effective interest rates as of October 3, 2020. |
| (2) | Carries interest at a specified margin over LIBOR of 3.50% with a minimum rate of 0.00%. Prior to February 27, 2018, the Term Loan carried interest with a specified margin over LIBOR of 3.75% with a minimum rate of 1.00%. |
| (3) | Carries interest at a specified margin over LIBOR of 8.50% with a minimum rate of 1.00%. |
| (4) | Carries interest at a specific margin of 0.75% and 1.00% with respect to Base Rate loans and between 1.75% and 2.00% with respect to Eurodollar Rate loans. Prior to August 13, 2020, the ABL Credit Facility carried interest at a specific margin of 0.25% and 0.75% with respect to Base Rate loans and between 1.25% and 1.75% with respect to Eurodollar Rate loans. |
Loss on extinguishment/modification of debt—On February 27, 2018, we amended the Term Loan including the incremental term loan, which resulted in a $0.5 million loss on debt extinguishment related to the underlying loan tranches repaid in connection with the amendment.
We capitalize financing costs we incur related to implementing and in certain circumstances, amending our debt arrangements. We record any financing costs associated with our Term Loan and Senior Unsecured Notes as a reduction of long-term debt, net on our consolidated balance sheet and
F-17
amortize them over the contractual life of the related debt arrangements. The table below summarizes changes in deferred financing costs associated with our Term Loan and Senior Unsecured Notes for the periods presented (in thousands):
| As of |
October 3, 2020 |
September 28, 2019 |
||||||
| Deferred financing costs |
||||||||
| Balance, beginning of year |
$ | 5,182 | $ | 6,356 | ||||
| Financing costs deferred |
5 | 10 | ||||||
| Less: amortization expense |
(1,248 | ) | (1,184 | ) | ||||
|
|
|
|
|
|||||
| Deferred financing costs, net of accumulated amortization |
$ | 3,939 | $ | 5,182 | ||||
|
|
|
|
|
|||||
We record any financing costs associated with our ABL Credit Facility in other assets on our consolidated balance sheets and amortize them over the contractual life of the related debt arrangement.
Repayment of the Term Loan—We are required to make principal repayments equal to 0.25% of the Term Loan principal amount as stated in the third amendment executed February 27, 2018 on the last day of December, March, June, and September. We are also required to repay the term loan based on an annual calculation of excess cash flow, as defined in the agreement. As of October 3, 2020, no amount of excess cash flows was required to be repaid.
The Term Loan does not require us to comply with any financial covenants. The Term Loan contains customary events of default, including default upon the nonpayment of principal, interest, fees or other amounts, or the occurrence of a change of control. No event of default had occurred under the Term Loan as of October 3, 2020 or September 28, 2019.
Principal maturities for the Term Loan are as follows as of October 3, 2020 (in thousands):
| 2021 |
$ | 8,341 | ||
| 2022 |
8,341 | |||
| 2023 |
794,496 | |||
|
|
|
|||
| Total |
$ | 811,178 | ||
|
|
|
Repayment of the ABL Credit Facility—We are obligated to pay the lender a commitment fee of 0.375% per annum, payable quarterly in arrears. We are also obligated to pay a commission on all outstanding letters of credit as well as customary administrative, issuance, fronting, amendment, payment, and negotiation fees. No amounts are outstanding on the $200.0 million and $150.0 million ABL Credit Facility as of October 3, 2020 and September 28, 2019, respectively. The amount available is reduced by $11.6 million and $10.6 million of existing standby letters of credit as of October 3, 2020 and September 28, 2019, respectively.
The ABL Credit Facility does not require us to comply with any financial covenants. The ABL Credit Facility contains customary events of default, including default upon the nonpayment of principal, interest, fees or other amounts, or the occurrence of a change of control. No event of default had occurred under the ABL Credit Facility as of October 3, 2020 or September 28, 2019.
Repayment of the Senior Unsecured Notes—The Senior Unsecured Notes are guaranteed on a senior basis by us and all our present and future domestic wholly owned subsidiaries. Interest-only payments on the Senior Unsecured Notes are payable quarterly on January 10, April 10, July 10, and October 10 of each year. The Senior Unsecured Notes bear interest of 8.50% plus LIBOR, subject to a minimum rate of 1.00%. The Senior Unsecured Notes have restrictive covenants that limit the ability to, among other things, incur or guarantee additional indebtedness or issue preferred stock; pay dividends
F-18
and make other restricted payments; incur restrictions on the payment of dividends or other distributions; create or incur certain liens; make certain investments; transfer or sell assets; engage in transactions with affiliates; and merge or consolidate with other companies or transfer all or substantially all of our assets.
The entire maturity of the Senior Unsecured Notes is due in 2024.
Representations and covenants—The Term Loan, Senior Unsecured Notes, and ABL Credit Facility contain customary representations and warranties, covenants, and conditions to borrowing. No event of default had occurred as of October 3, 2020 or September 28, 2019.
Substantially all of our assets are pledged as collateral to secure our indebtedness under our long-term debt agreements.
Interest Rate Cap Agreements
In March 2017, we entered into interest rate cap agreements in order to manage the variability of cash flows related to a portion of our floating rate indebtedness. Pursuant to the agreements, we have capped LIBOR at 3.00% with respect to the aggregate notional amount of $750.0 million through the expiration of the agreements in March 2021. In the event LIBOR exceeds 3.00% we will pay interest at the capped rate plus the applicable margin. In the event LIBOR is less than 3.00%, we will pay interest at the prevailing LIBOR rate plus the applicable margin.
The fair value of the interest rate cap agreements was zero, zero and $4.3 million as of October 3, 2020, September 28, 2019 and September 29, 2018 respectively, and is recorded in other assets on the consolidated balance sheets. We recognized a (loss) gain related to the interest rate cap agreements of zero, $(4.3) million and $3.0 million in fiscal 2020, 2019 and 2018, respectively, which is recorded in other expenses in the consolidated statement of operations.
Note 9—Leases
The majority of our long-term operating lease agreements are for our corporate office, retail locations, and distribution centers, which expire in various years through 2031. The initial lease terms for these facilities range from 5-10 years with the exception of the lease for our corporate headquarters which is 13 years. The majority of our building leases also include options to extend, which are not factored into the recognition of their respective assets and liabilities based on management’s assessment of the probability that the options will be exercised as they are written in the lease. We sublease real estate for five locations to third parties. Many of our lease agreements include escalating rents over the lease terms which, under Topic 842, results in rent being expensed on a straight-line basis over the life of the lease that commences on the date we have the right to control the property. Our lease agreements do not contain any residual value guarantees or restrictive covenants that would reasonably be expected to have a material impact on our business.
When readily determinable, the rate implicit in the lease is used to discount lease payments to present value; however, substantially all of our leases do not provide a readily determinable implicit rate. If the rate implicit in the lease is not readily determinable, we use an estimate comparable to a secured incremental borrowing rate, determined on a collateralized basis, to discount lease payments based on information available at lease commencement.
The following table presents the weighted-average remaining lease term, and discount rate for operating leases as of October 3, 2020:
| Weighted-average remaining lease term |
4.2 years | |||
| Weighted-average discount rate |
5.9 | % |
F-19
Future annual minimum lease payments as of October 3, 2020, are as follows (in thousands):
| 2021 |
$ | 68,036 | ||
| 2022 |
59,097 | |||
| 2023 |
46,874 | |||
| 2024 |
33,956 | |||
| 2025 |
19,864 | |||
| Thereafter |
15,328 | |||
|
|
|
|||
| Total |
$ | 243,155 | ||
| Less: amount of lease payments representing imputed interest |
58,462 | |||
|
|
|
|||
| Present value of future minimum lease payments |
184,693 | |||
| Less: current operating lease liabilities |
54,459 | |||
|
|
|
|||
| Operating lease liabilities, noncurrent |
$ | 130,234 | ||
|
|
|
Operating lease expense totaled $66.6 million in fiscal 2020, and rent expense was $63.6 million and $59.9 million in fiscal 2019 and 2018, respectively.
Note 10—Income Taxes
The provision for income taxes comprises the following:
| (In thousands) | ||||||||||||
| Fiscal 2020 | Fiscal 2019 | Fiscal 2018 | ||||||||||
| Current: |
||||||||||||
| Federal |
$ | 8,188 | $ | 14,072 | $ | 966 | ||||||
| State |
(5,844 | ) | 1,537 | 2,555 | ||||||||
|
|
|
|
|
|
|
|||||||
| Total Current |
2,344 | 15,609 | 3,521 | |||||||||
|
|
|
|
|
|
|
|||||||
| Deferred: |
||||||||||||
| Federal |
2,260 | (418 | ) | 2,752 | ||||||||
| State |
(1,977 | ) | (336 | ) | (1,347 | ) | ||||||
|
|
|
|
|
|
|
|||||||
| Total Deferred |
283 | (754 | ) | 1,405 | ||||||||
|
|
|
|
|
|
|
|||||||
| Total income tax provision |
$ | 2,627 | $ | 14,855 | $ | 4,926 | ||||||
|
|
|
|
|
|
|
|||||||
A reconciliation of the provision for income taxes to the amount computed at the federal statutory rate is as follows:
| (In thousands) | ||||||||||||
| Fiscal 2020 |
Fiscal 2019 |
Fiscal 2018 |
||||||||||
| Federal income tax at statutory rate |
$ | 12,851 | $ | 3,198 | $ | (190 | ) | |||||
| Permanent differences |
464 | 286 | 27 | |||||||||
| Change in valuation allowance |
(11,373 | ) | 11,060 | 5,738 | ||||||||
| State taxes, net of federal benefit |
2,503 | 208 | 891 | |||||||||
| Federal rate change |
— | — | (1,540 | ) | ||||||||
| Other |
(1,818 | ) | 103 | — | ||||||||
|
|
|
|
|
|
|
|||||||
| Total income tax provision |
$ | 2,627 | $ | 14,855 | $ | 4,926 | ||||||
|
|
|
|
|
|
|
|||||||
F-20
Our effective rate for fiscal 2020 was 4.3%. The decrease in valuation allowance accounts for (18.6)% of the overall effective rate. This decrease is related to utilization of interest limitation carryforwards related to the impact of U.S. Tax Reform and the new provision of Internal Revenue Code Section 163(j). The Coronavirus Aid, Relief, and Economic Security (CARES) Act increased the interest limitation from 30% to 50% of adjusted taxable income which allowed for the utilization of interest deduction carryforwards during fiscal 2020. The tax effects of temporary differences that give rise to significant portions of the deferred tax assets and liabilities are summarized below.
| (In thousands) | ||||||||
| As of |
October 3, 2020 |
September 28, 2019 |
||||||
| Deferred tax assets: |
||||||||
| Compensation accruals |
$ | 5,433 | $ | 948 | ||||
| Deferred rent |
— | 1,228 | ||||||
| Inventory |
1,053 | 681 | ||||||
| Interest limitation |
6,919 | 17,886 | ||||||
| Lease liabilities |
46,644 | — | ||||||
| Property and equipment |
— | 590 | ||||||
| Reserves and other accruals |
354 | — | ||||||
|
|
|
|
|
|||||
| Total deferred tax assets |
60,403 | 21,333 | ||||||
| Deferred tax liabilities: |
||||||||
| Property, plant, and equipment |
(611 | ) | — | |||||
| Intangibles |
(3,258 | ) | (2,456 | ) | ||||
| Reserves and other accruals |
— | (2,673 | ) | |||||
| Leased assets |
(44,014 | ) | — | |||||
| Deferred financing cost |
(512 | ) | (646 | ) | ||||
|
|
|
|
|
|||||
| Total deferred tax liabilities |
(48,395 | ) | (5,775 | ) | ||||
| Valuation allowance |
(5,425 | ) | (16,798 | ) | ||||
|
|
|
|
|
|||||
| Deferred tax assets (liabilities), net |
$ | 6,583 | $ | (1,240 | ) | |||
|
|
|
|
|
|||||
Management assesses the available positive and negative evidence to estimate if sufficient future taxable income will be generated to utilize the existing deferred tax assets. We are projecting future taxable income, however, the interest expense limitation passed in the Act created a deferred tax asset for the years ended October 3, 2020 and September 28, 2019, that we do not anticipate realizing in the immediate future. As of October 3, 2020 and September 28, 2019, we recorded a valuation allowance of $5.4 million and $16.8 million, respectively, for our U.S. deferred tax asset related to our interest expense limitation only.
Valuation Allowance consists of the following:
| Balance at Beginning of Period |
Additions Charged to Costs and Expenses |
Deductions | Balance at End of Period |
|||||||||||||
| (In Thousands) | ||||||||||||||||
| 2018 |
$ | — | $ | 5,738 | $ | — | $ | 5,738 | ||||||||
| 2019 |
$ | 5,738 | $ | 11,060 | $ | — | $ | 16,798 | ||||||||
| 2020 |
$ | 16,798 | $ | — | $ | (11,373 | ) | $ | 5,425 | |||||||
We are subject to U.S. federal and state taxes in the normal course of business and our income tax returns are subject examination by the relevant tax authorities. With few exceptions, we are no longer subject to U.S. federal examinations by taxing authorities for calendar years before 2017 and no longer subject to state examinations for calendar years before 2016.
F-21
We have not identified any material uncertain tax positions.
Note 11—Commitments & Contingencies
Contingencies
We are defendants in lawsuits or potential claims encountered in the normal course of business. When the potential liability from a matter can be estimated and the loss is considered probable, we record the estimated loss. Due to uncertainties related to the resolution of lawsuits, investigations and claims, the ultimate outcome may differ from the estimates. We do not expect that the resolutions of any of these matters will have a material effect on our consolidated financial position or results of operations. We did not record any material loss contingencies as of October 3, 2020 or as of September 28, 2019.
Our workers’ compensation insurance program, general liability insurance program, and employee group medical plan have self-insurance retention features of $0.4 million per event as of October 3, 2020 and September 28, 2019, respectively. We had standby letters of credit outstanding in the amounts of $11.6 million and $10.6 million as of October 3, 2020 and September 28, 2019, respectively, for the purpose of securing such obligations under our workers’ compensation self-insurance programs.
Purchase Commitments
In addition to our lease obligations, we maintain future purchase commitments for inventory and other operational requirements.
Future minimum purchase commitments as of October 3, 2020 are as follows (in thousands):
| 2021 |
$ | 112,551 | ||
| 2022 |
70,888 | |||
| 2023 |
67,229 | |||
| 2024 |
50,196 | |||
| 2025 |
33,900 | |||
| Thereafter |
5,687 | |||
|
|
|
|||
| Total |
$ | 340,451 | ||
|
|
|
Note 12—401(K) Plan
We provide for the benefit of our employees a voluntary defined contribution retirement plan under Section 401(k) of the Internal Revenue Code. The plan covers all eligible employees and provides for a matching contribution by us of 50% of each participant’s contribution up to 4% of the individual’s compensation as defined. The expenses related to this plan were $1.1 million, $1.0 million and $1.1 million in fiscal 2020, 2019 and 2018, respectively.
Note 13—Related Party Transactions
In February 2017, we entered into a management services agreement with our private equity sponsors in connection with our acquisition in February 2017. The management services agreement provides that we will pay an annual fee for them to provide management and advisory services to us and our affiliates, including general management consulting services, support and analysis with respect to financing alternatives and strategic planning functions. During fiscal 2020, 2019 and 2018, we paid or accrued management fees in the amount of $4.9 million, $4.5 million and $3.2 million, respectively.
F-22
In March 2013, we entered into an operating lease for our corporate headquarters with DM Ventures I, LLC. The former Chairman of our Board of Directors is one of the principals of DM Ventures I, LLC and holds a significant ownership position in the lessor entity. Aggregate rents paid to DM Ventures I, LLC for Leslie’s corporate headquarters were $1.9 million, $1.6 million and $1.6 million in fiscal 2020, 2019 and 2018, respectively.
Note 14—Equity-Based Compensation
Incentive Unit Grant Agreements
Our Parent has granted profits interests to our employees through Incentive Unit Grant Agreements. The units have economic characteristics similar to stock options and have the right to share in the appreciation of the equity value of our Parent. The sole asset of our Parent is indirect ownership of Leslie’s, Inc. We concluded such units are classified as equity awards. The awards are spread over two tiers, a service-based (time) award tier and a performance-based award tier; the service-based awards vest over a four-year period at a rate of 25% annually on each anniversary of the date of grant. The performance-based awards vest based on performance conditions as defined in the Incentive Unit Grant Agreements. We recognized equity-based compensation on a straight-line basis for service-based awards.
The fair value of the awards is estimated on the date of grant using the Black-Scholes option pricing model, which treats the Incentive Unit Grant Agreements as implicit call options with exercise prices determined based on their respective rights to participate in distributions. The Black-Scholes option pricing model requires the use of a number of assumptions, including expected volatility, risk-free interest rate, expected dividends, and expected term. Expected volatility is based on the historic volatility of a basket of certain publicly traded comparable companies. The expected term of the awards is equal to the vesting term and represents the estimated period of time until liquidity. The risk-free interest rate is based on the U.S. Treasury yield curve in effect at the time of grant for the expected term of the unit. Our Parent does not intend to pay any dividends in the future to ultimate shareholders who hold the type of security subject to the unit arrangement. Due to the absence of a public market for our Parent’s equity, the fair value of the profit interests has historically been determined by the General Partner of our Parent on each grant date.
For fiscal 2020, 2019 and 2018, we recognized $1.8 million, $2.1 million and $1.8 million in compensation expense related to service-based Incentive Unit Grants. The performance-based Incentive Unit Grants were not deemed probable of achievement as of October 3, 2020, September 28, 2019 or September 29, 2018 and no expense has been recorded.
The fair value of Incentive Units granted was estimated at the date of grant using the Black-Scholes option pricing model with the following weighted-average assumptions. A summary of Incentive Unit activity and assumptions are as follows:
| Fiscal Year Ended |
October 3, 2020 |
September 28, 2019 |
September 29, 2018 |
|||||||||
| Expected volatility |
23.5 | % | 22.9 | % | 21.0 | % | ||||||
| Risk-free interest rate |
1.4 | % | 2.5 | % | 2.2 | % | ||||||
| Dividend yield |
0.0 | % | 0.0 | % | 0.0 | % | ||||||
| Expected term (in years) |
4.0 | 4.0 | 4.0 | |||||||||
| Weighted-average grant date fair value per Incentive Unit |
$ | 1.87 | $ | 1.69 | $ | 1.54 | ||||||
We granted 3,111,783 service-based Incentive Units and 2,868,892 performance-based Incentive Units during fiscal 2020. We granted 2,040,923 service-based Incentive Units and 1,360,615 performance-based Incentive Units during fiscal 2019. We granted 612,000 service-based Incentive Units and 408,000 performance-based Incentive Units during fiscal 2018.
F-23
A summary of Incentive Unit activity is as follows:
| Number of Incentive Units |
||||
| Outstanding, September 30, 2017 |
7,841,743 | |||
| Granted |
1,020,000 | |||
| Exercised |
— | |||
| Forfeited |
(915,750 | ) | ||
|
|
|
|||
| Outstanding, September 29, 2018 |
7,945,993 | |||
| Granted |
3,401,538 | |||
| Exercised |
— | |||
| Forfeited |
(1,084,750 | ) | ||
|
|
|
|||
| Outstanding, September 28, 2019 |
10,262,781 | |||
| Granted |
5,980,675 | |||
| Exercised |
— | |||
| Forfeited |
(2,976,250 | ) | ||
| Outstanding, October 3, 2020 |
13,267,206 | |||
|
|
|
|||
| Vested, September 29, 2018 |
1,163,512 | |||
| Vested, September 28, 2019 |
1,993,273 | |||
| Vested, October 3, 2020 |
3,196,606 | |||
The amount of unrecognized equity-based compensation for unvested service-based Incentive Units was $6.7 million as of October 3, 2020, which is expected to be recognized over approximately four years.
Note 15—Subsequent Events
On November 2, 2020, the Company closed its IPO, pursuant to which it issued and sold an aggregate of 30.0 million shares of common stock at the IPO Price of $17.00 per share. The aggregate gross proceeds to the Company were $510.0 million, and the net proceeds were $458.7 million after deducting underwriting discounts and commissions of $45.0 million and other IPO expenses of $6.3 million. The Company used the net proceeds from the sale of shares in the IPO to repay the entire outstanding amount of its $390 million senior unsecured floating rate notes due 2024. The remaining proceeds will be used for working capital and general corporate purposes.
In connection with its IPO, the Company issued 6.0 million restricted stock units and 4.6 million stock options exercisable at a price of $17.00 per share.
F-24
Shares
Leslie’s, Inc.
Common Stock
Prospectus
| Goldman Sachs & Co. LLC | Morgan Stanley | BofA Securities |
, 2021
Through and including , 2021 (the 25th day after the date of this prospectus), all dealers that buy, sell, or trade in our common stock, whether or not participating in this offering, may be required to deliver a prospectus. This is in addition to the dealers’ obligation to deliver a prospectus when acting as underwriters and with respect to their unsold allotments or subscriptions.
PART II
INFORMATION NOT REQUIRED IN PROSPECTUS
Item 13. Other Expenses of Issuance and Distribution.
The following table shows the costs and expenses, other than underwriting discounts and commissions, payable in connection with the sale and distribution of the securities being registered. Except as otherwise noted, we will pay all of these amounts. All amounts except the SEC registration fee and the FINRA fee are estimated.
| SEC registration fee |
$ | |||
| FINRA filing fee |
||||
| Legal fees and expenses |
||||
| Accounting fees and expenses |
||||
| Printing and engraving expenses |
||||
| Transfer agent and registrar fees |
||||
| Miscellaneous expenses |
||||
|
|
|
|||
| Total |
$ | |||
|
|
|
Item 14. Indemnification of Directors and Officers.
Limitation of Personal Liability of Directors and Indemnification
Section 102(b)(7) of the DGCL permits a corporation to provide in its certificate of incorporation that a director of the corporation shall not be personally liable to the corporation or its stockholders for monetary damages for breach of fiduciary duty as a director, except for liability (1) for any breach of the director’s duty of loyalty to the corporation or its stockholders, (2) for acts or omissions not in good faith or which involve intentional misconduct or a knowing violation of law, (3) under Section 174 of the DGCL (regarding, among other things, the payment of unlawful dividends or unlawful stock purchases or redemptions), or (4) for any transaction from which the director derived an improper personal benefit. Our fifth amended and restated certificate of incorporation provides for such limitation of liability.
Section 145(a) of the DGCL empowers a corporation to indemnify any director, officer, employee or agent, or former director, officer, employee or agent, who was or is a party or is threatened to be made a party to any threatened, pending or completed action, suit or proceeding, whether civil, criminal, administrative or investigative (other than an action by or in the right of the corporation), by reason of such person’s service as a director, officer, employee or agent of the corporation, or such person’s service, at the corporation’s request, as a director, officer, employee or agent of another corporation or enterprise, against expenses (including attorneys’ fees), judgments, fines, and amounts paid in settlement actually and reasonably incurred by such person in connection with such action, suit or proceeding; provided that such director or officer acted in good faith and in a manner reasonably believed to be in or not opposed to the best interests of the corporation and with respect to any criminal action or proceeding; and provided, further, that such director or officer had no reasonable cause to believe his conduct was unlawful.
Section 145(b) of the DGCL empowers a corporation to indemnify any person who was or is a party or is threatened to be made a party to any threatened, pending or completed action or suit by or in the right of the corporation to procure a judgment in its favor by reason of the fact that such person is or was a director, officer, employee, or agent of the corporation, or is or was serving at the request of the corporation as a director, officer, employee, or agent of another enterprise, against expenses (including attorneys’ fees) actually and reasonably incurred in connection with the defense or
II-1
settlement of such action or suit; provided that such director or officer acted in good faith and in a manner he or she reasonably believed to be in or not opposed to the best interests of the corporation, except that no indemnification may be made in respect of any claim, issue or matter as to which such director or officer shall have been adjudged to be liable to the corporation, unless and only to the extent that the Delaware Court of Chancery or the court in which such action or suit was brought shall determine upon application that, despite the adjudication of liability but in view of all the circumstances of the case, such director or officer is fairly and reasonably entitled to indemnity for such expenses that the court shall deem proper. Notwithstanding the preceding sentence, except as otherwise provided in our bylaws, we shall be required to indemnify any such person in connection with a proceeding (or part thereof) commenced by such person only if the commencement of such proceeding (or part thereof) by any such person was authorized by the board of directors.
In addition, our fifth amended and restated certificate of incorporation provides that we must indemnify our directors and officers to the fullest extent authorized by law. Under our bylaws, we are also expressly required to advance certain expenses to our directors and officers and we are permitted to, and currently intend to, carry directors’ and officers’ insurance providing indemnification for our directors and officers for some liabilities. We believe that these indemnification provisions and the directors’ and officers’ insurance are useful to attract and retain qualified directors and officers.
The proposed form of Underwriting Agreement filed as Exhibit 1.1 to this Registration Statement provides for indemnification of directors and officers of the Registrant by the underwriters against certain liabilities.
Item 15. Recent Sales of Unregistered Securities.
None.
Item 16. Exhibits and Financial Statement Schedules.
| (a) | Exhibits: The list of exhibits set forth under “Exhibit Index” at the end of this Registration Statement is incorporated herein by reference. |
Item 17. Undertakings.
| (a) | Insofar as indemnification for liabilities arising under the Securities Act of 1933 may be permitted to directors, officers and controlling persons of the registrant pursuant to the foregoing provisions, or otherwise, the registrant has been advised that in the opinion of the Securities and Exchange Commission such indemnification is against public policy as expressed in the Act and is, therefore, unenforceable. In the event that a claim for indemnification against such liabilities (other than the payment by the registrant of expenses incurred or paid by a director, officer or controlling person of the registrant in the successful defense of any action, suit or proceeding) is asserted by such director, officer or controlling person in connection with the securities being registered, the registrant will, unless in the opinion of its counsel the matter has been settled by controlling precedent, submit to a court of appropriate jurisdiction the question whether such indemnification by it is against public policy as expressed in the Act and will be governed by the final adjudication of such issue. |
| (b) | The undersigned registrant hereby undertakes that: |
| (i) | For purposes of determining any liability under the Securities Act of 1933, the information omitted from the form of prospectus filed as part of this registration statement in reliance upon Rule 430A and contained in a form of prospectus filed by the registrant pursuant to Rule 424(b)(1) or (4) or 497(h) under the Securities Act of |
II-2
| 1933 shall be deemed to be part of this registration statement as of the time it was declared effective. |
| (ii) | For the purpose of determining any liability under the Securities Act of 1933, each post-effective amendment that contains a form of prospectus shall be deemed to be a new registration statement relating to the securities offered therein, and the offering of such securities at that time shall be deemed to be the initial bona fide offering thereof. |
II-3
EXHIBIT INDEX
| Exhibit Number |
Description | |
| 1.1* | Form of Underwriting Agreement. | |
| 3.1 | Fifth Amended and Restated Certificate of Incorporation, effective as of November 2, 2020 (filed with the SEC as Exhibit 3.1 to the Company’s Form 8-K filed on November 2, 2020 and incorporated herein by reference) | |
| 3.2 | Amended and Restated Bylaws, effective as of November 2, 2020 (filed with the SEC as Exhibit 3.2 to the Company’s Form 8-K filed November 2, 2020 and incorporated herein by reference) | |
| 4.1 | Indenture, dated as of August 16, 2016, by and among Leslie’s Poolmart, Inc., Leslie’s Holdings, Inc., the other guarantors party thereto and U.S. Bank National Association, as Trustee (filed with the SEC as Exhibit 4.1 to the Company’s Form S-1/A filed October 22, 2020 and incorporated herein by reference) | |
| 4.2 | First Supplemental Indenture, dated as of October 26, 2016, by and among Leslie’s Poolmart, Inc., Leslie’s Holdings, Inc., the other guarantors party thereto and U.S. Bank National Association, as Trustee (filed with the SEC as Exhibit 4.2 to the Company’s Form S-1/A filed October 22, 2020 and incorporated herein by reference) | |
| 4.3 | Second Supplemental Indenture, dated as of February 3, 2017, by and among Leslie’s Poolmart, Inc., Leslie’s Holdings, Inc., the other guarantors party thereto and U.S. Bank National Association, as Trustee (filed with the SEC as Exhibit 4.3 to the Company’s Form S-1/A filed October 22, 2020 and incorporated herein by reference) | |
| 4.4 | Form of Registration Rights and Lock-up Agreement between Leslie’s, Inc., Bubbles Investor Aggregator, L.P., Explorer Investment Pte. Ltd. and certain other investors (executed as of November 2, 2020 and filed with the SEC as Exhibit 4.4 to the Company’s Form S-1/A filed October 28, 2020 and incorporated herein by reference) | |
| 4.5* | First Amendment to Registration Rights and Lock-up Agreement between Leslie’s, Inc. and Bubbles Investor Aggregator, L.P. | |
| 5.1* | Opinion of Gibson, Dunn & Crutcher LLP | |
| 10.1 | Form of Indemnification Agreement between Leslie’s, Inc. and its directors and officers (filed with the SEC as Exhibit 10.1 to the Company’s Form S-1/A filed October 26, 2020 and incorporated herein by reference) | |
| 10.2# | 2020 Omnibus Incentive Plan (filed with the SEC as Exhibit 10.2 to the Company’s Form S-1/A filed October 22, 2020 and incorporated herein by reference) | |
| 10.3# | Form of Stock Option Agreement pursuant to 2020 Omnibus Incentive Plan (filed with the SEC as Exhibit 10.3 to the Company’s Form S-1/A filed October 22, 2020 and incorporated herein by reference) | |
| 10.4# | Form of Restricted Stock Unit Agreement pursuant to 2020 Omnibus Incentive Plan (filed with the SEC as Exhibit 10.4 to the Company’s Form S-1/A filed October 22, 2020 and incorporated herein by reference) | |
| 10.5# | Amended and Restated Employment Agreement, dated as of October 19, 2020, by and between Leslie’s, Inc. and Michael R. Egeck (filed with the SEC as Exhibit 10.5 to the Company’s Form S-1/A filed October 22, 2020 and incorporated herein by reference) | |
II-4
II-5
| * | To be filed by amendment. |
| # | Indicates management contract or compensatory plan. |
II-6
SIGNATURES
Pursuant to the requirements of the Securities Act of 1933, the Registrant has duly caused this Registration Statement to be signed on its behalf by the undersigned, thereunto duly authorized in Phoenix, Arizona, on , 2021.
| LESLIE’S, INC. | ||
| By: |
| |
| Name: Michael R. Egeck Title: Chief Executive Officer | ||
KNOW ALL MEN BY THESE PRESENTS, that each person whose signature appears below constitutes and appoints Steven M. Weddell and Brad A. Gazaway, and each of them, his or her true and lawful attorneys-in-fact and agents, each with full power of substitution and resubstitution, for him and in his name, place and stead, in any and all capacities, to sign any and all amendments, including post-effective amendments, to this Registration Statement, and any registration statement relating to the offering covered by this Registration Statement and filed pursuant to Rule 462 under the Securities Act of 1933, as amended, and to file the same, with exhibits thereto and other documents in connection therewith, with the Securities and Exchange Commission, granting unto said attorneys-in-fact and agents, and each of them, full power and authority to do and perform each and every act and thing requisite and necessary to be done, as fully to all intents and purposes as he might or could do in person, hereby ratifying and confirming all that each of said attorneys-in-fact and agents or their substitute or substitutes may lawfully so or cause to be done by virtue hereof.
Pursuant to the requirements of the Securities Act of 1933, as amended, the following persons have signed this Registration Statement in the capacities and on the date indicated.
| Signature |
Title |
Date | ||
|
Steven L. Ortega |
Chairman | , 2021 | ||
|
Michael R. Egeck |
Chief Executive Officer (Principal Executive Officer) and Director | , 2021 | ||
|
Steven M. Weddell |
Executive Vice President and Chief Financial Officer (Principal Financial Officer and Principal Accounting Officer) | , 2021 | ||
|
Yolanda Daniel |
Director | , 2021 | ||
|
Jodeen Kozlak |
Director | , 2021 | ||
|
Marc Magliacano |
Director | , 2021 | ||
|
Matthew Lischick |
Director | , 2021 | ||
| Signature |
Title |
Date | ||
|
Eric Kufel |
Director | , 2021 | ||
|
Susan O’Farrell |
Director | , 2021 | ||
|
John Strain |
Director | , 2021 | ||