UNITED STATES
SECURITIES AND EXCHANGE COMMISSION
Washington, D.C. 20549
FORM
(Mark One)
ANNUAL REPORT PURSUANT TO SECTION 13 OR 15(d) OF THE SECURITIES EXCHANGE ACT OF 1934 |
For the fiscal year ended
OR
TRANSITION REPORT PURSUANT TO SECTION 13 OR 15(d) OF THE SECURITIES EXCHANGE ACT OF 1934 FOR THE TRANSITION PERIOD FROM TO |
Commission File Number
(Exact name of Registrant as specified in its Charter)
(State or other jurisdiction of incorporation or organization) |
(I.R.S. Employer Identification No.) |
(Address of principal executive offices) |
(Zip Code) |
Registrant’s telephone number, including area code: (
Securities registered pursuant to Section 12(b) of the Act:
Title of each class |
|
Trading Symbol(s) |
|
Name of each exchange on which registered |
|
|
Securities registered pursuant to Section 12(g) of the Act: None
Indicate by check mark if the Registrant is a well-known seasoned issuer, as defined in Rule 405 of the Securities Act. Yes ☐
Indicate by check mark if the Registrant is not required to file reports pursuant to Section 13 or 15(d) of the Act. Yes ☐
Indicate by check mark whether the Registrant: (1) has filed all reports required to be filed by Section 13 or 15(d) of the Securities Exchange Act of 1934 during the preceding 12 months (or for such shorter period that the Registrant was required to file such reports), and (2) has been subject to such filing requirements for the past 90 days.
Indicate by check mark whether the Registrant has submitted electronically every Interactive Data File required to be submitted pursuant to Rule 405 of Regulation S-T (§ 232.405 of this chapter) during the preceding 12 months (or for such shorter period that the Registrant was required to submit such files).
Indicate by check mark whether the Registrant is a large accelerated filer, an accelerated filer, a non-accelerated filer, a smaller reporting company, or an emerging growth company. See the definitions of “large accelerated filer,” “accelerated filer,” “smaller reporting company,” and “emerging growth company” in Rule 12b-2 of the Exchange Act.
Large accelerated filer |
|
☐ |
|
Accelerated filer |
|
☐ |
|
|
|
|
|||
|
☒ |
|
Smaller reporting company |
|
||
|
|
|
|
|
|
|
Emerging growth company |
|
|
|
|
|
|
If an emerging growth company, indicate by check mark if the Registrant has elected not to use the extended transition period for complying with any new or revised financial accounting standards provided pursuant to Section 13(a) of the Exchange Act. ☐
Indicate by check mark whether the Registrant has filed a report on and attestation to its management’s assessment of the effectiveness of its internal control over financial reporting under Section 404(b) of the Sarbanes-Oxley Act (15 U.S.C. 7262(b)) by the registered public accounting firm that prepared or issued its audit report.
Indicate by check mark whether the Registrant is a shell company (as defined in Rule 12b-2 of the Exchange Act). Yes ☐ No
The aggregate market value of the Common Stock held by non-affiliates of the Registrant, based on the closing price of the Common Stock on The Nasdaq Global Select Market on April 3, 2021, the last business day of the Registrant’s most recently completed second fiscal quarter was approximately $
The number of shares of Registrant’s Common Stock outstanding as of December 6, 2021 was
DOCUMENTS INCORPORATED BY REFERENCE
The information required by Part III of this Report, to the extent not set forth herein, is incorporated herein by reference from the Registrant’s definitive proxy statement relating to the Annual Meeting of Shareholders to be held in 2022, which definitive proxy statement shall be filed with the Securities and Exchange Commission within 120 days after the end of the fiscal year to which this Annual Report on Form 10-K relates.
Table of Contents
|
|
Page |
PART I |
|
|
Item 1. |
2 |
|
Item 1A. |
10 |
|
Item 1B. |
27 |
|
Item 2. |
27 |
|
Item 3. |
28 |
|
Item 4. |
28 |
|
|
|
|
PART II |
|
|
Item 5. |
29 |
|
Item 6. |
30 |
|
Item 7. |
Management’s Discussion and Analysis of Financial Condition and Results of Operations |
31 |
Item 7A. |
44 |
|
Item 8. |
45 |
|
Item 9. |
Changes in and Disagreements With Accountants on Accounting and Financial Disclosure |
70 |
Item 9A. |
70 |
|
Item 9B. |
70 |
|
Item 9C. |
Disclosure Regarding Foreign Jurisdictions that Prevent Inspections |
70 |
|
|
|
PART III |
|
|
Item 10. |
71 |
|
Item 11. |
71 |
|
Item 12. |
Security Ownership of Certain Beneficial Owners and Management and Related Stockholder Matters |
71 |
Item 13. |
Certain Relationships and Related Transactions, and Director Independence |
71 |
Item 14. |
71 |
|
|
|
|
PART IV |
|
|
Item 15. |
72 |
|
Item 16 |
74 |
|
|
|
|
|
|
i
CAUTIONARY NOTE REGARDING FORWARD-LOOKING STATEMENTS
This Annual Report on Form 10-K contains forward-looking statements about us and our industry that involve substantial risks and uncertainties. All statements other than statements of historical fact contained in this Annual Report on Form 10-K, including statements regarding our future results of operations or financial condition, business strategy and plans and objectives of management for future operations, are forward-looking statements. In some cases, you can identify forward-looking statements because they contain words such as “anticipate,” “believe,” “contemplate,” “continue,” “could,” “estimate,” “expect,” “intend,” “may,” “plan,” “potential,” “predict,” “project,” “should,” “target,” “will,” or “would” or the negative of these words or other similar terms or expressions. Our actual results could differ materially from those indicated in these forward-looking statements for a variety of reasons, including, among others:
You should not rely on forward-looking statements as predictions of future events. We have based the forward-looking statements contained in this Annual Report on Form 10-K primarily on our current expectations and projections about future events and trends that we believe may affect our business, financial condition, and operating results. The outcome of the events described in these forward-looking statements is subject to risks, uncertainties, and other factors described in the section titled “Risk Factors” and elsewhere in this Annual Report on Form 10-K. Moreover, we operate in a very competitive and rapidly changing environment. New risks and uncertainties emerge from time to time, and it is not possible for us to predict all risks and uncertainties that could have an impact on the forward-looking statements contained in this Annual Report on Form 10-K. The results, events, and circumstances reflected in the forward-looking statements may not be achieved or occur, and actual results, events, or circumstances could differ materially from those described in the forward-looking statements.
In addition, statements that “we believe” and similar statements reflect our beliefs and opinions on the relevant subject. These statements are based on information available to us as of the date of this Annual Report on Form 10-K and while we believe that information provides a reasonable basis for these statements, that information may be limited or incomplete. Our statements should not be read to indicate that we have conducted an exhaustive inquiry into, or review of, all relevant information. These statements are inherently uncertain, and investors are cautioned not to unduly rely on these statements.
The forward-looking statements made in this Annual Report on Form 10-K are based on events or circumstances as of the date on which the statements are made. We undertake no obligation to update any forward-looking statements made in this Annual Report on Form 10-K to reflect events or circumstances after the date of this Annual Report on Form 10-K or to reflect new information or the occurrence of unanticipated events, except as required by law. We may not actually achieve the plans, intentions, or expectations disclosed in our forward-looking statements, and you should not place undue reliance on our forward-looking statements. Our forward-looking statements do not reflect the potential impact of any future acquisitions, mergers, dispositions, joint ventures, or investments.
1
PART I
Item 1. Business.
In this Annual Report on Form 10-K, unless otherwise indicated or the context otherwise requires, all references to “we,” “our,” “us,” “Leslie’s,” “the Company,” and “our Company” refer to Leslie’s, Inc. and its consolidated subsidiaries.
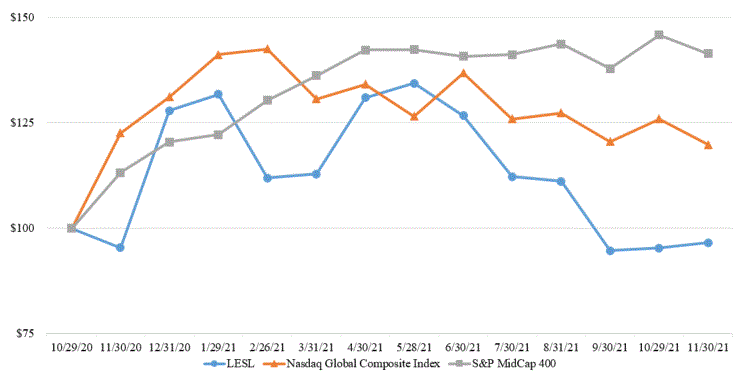
We filed a registration statement on Form S-1, as amended, with the Securities and Exchange Commission (“SEC”) which was declared effective on October 28, 2020. On October 29, 2020, our common stock began “regular-way” trading on The Nasdaq Global Select Market (“Nasdaq”) under the “LESL” symbol. On November 2, 2020, we completed our initial public offering (“IPO”).
Our Company
We are the largest and most trusted direct-to-consumer brand in the $11 billion United States pool and spa care industry, serving residential and professional consumers. Founded in 1963, we are the only direct-to-consumer pool and spa care brand with national scale, operating an integrated marketing and distribution ecosystem powered by a physical network of 952 branded locations and a robust digital platform. We have a market-leading share of approximately 15% of residential aftermarket product spend as of 2021, which represents an increase of approximately 1,000 basis points since 2010, our physical network is larger than the sum of our twenty largest competitors, and our digital sales are estimated to be greater than five times as large as that of our largest digital competitor. We offer an extensive assortment of professional-grade products, the majority of which are exclusive to Leslie’s, as well as certified installation and repair services, all of which are essential to the ongoing maintenance of pools and spas. Our dedicated team of associates, pool and spa care experts, and experienced service technicians are passionate about empowering our consumers with the knowledge, products, and solutions necessary to confidently maintain and enjoy their pools and spas. Over the last five fiscal years, we have spent more than $90 million in foundational investments across new technologies and capabilities focused on transforming our consumer experience and advancing our industry leadership. The unprecedented scale of our integrated marketing and distribution ecosystem, which is powered by our direct-to-consumer network, uniquely enables us to efficiently reach and service every pool and spa in the continental United States capabilities no competitor can match.
We operate primarily in the pool and spa aftermarket industry which is one of the most fundamentally attractive consumer categories given its scale, predictability, and growth outlook. We have a highly predictable, recurring revenue model, as evidenced by our 58 consecutive years of sales growth. Approximately 80% of our assortment is comprised of non-discretionary products essential to the care of residential and commercial pools and spas. Our assortment includes chemicals, equipment and parts, cleaning and maintenance equipment, and safety, recreational, and fitness-related products. We also offer important essential services, such as equipment installation and repair for residential consumers and professional pool operators. Consumers receive the benefit of extended vendor warranties on products purchased through our locations and on on-site installations or repairs by our certified in-field technicians. We offer complimentary, commercial-grade in-store water testing and analysis via our proprietary AccuBlue® system, which increases consumer engagement, conversion, basket size, and loyalty, resulting in higher lifetime value. Our water treatment expertise is powered by data and intelligence accumulated from the millions of water tests we have performed over the years, positioning us as the most trusted water treatment service provider in the industry. Due to the non-discretionary nature of our products and services, our business has historically delivered strong, uninterrupted growth, and profitability in all market environments, including through the Great Recession and the COVID-19 pandemic.
We have a legacy of leadership and disruptive innovation. Since our founding in 1963, we have been the leading innovator in our category and have provided our consumers with the most advanced pool and spa care available. As we have scaled, we have leveraged our competitive advantages to strategically reinvest in our business and intellectual property to develop new value-added capabilities. We have pioneered complimentary in-store water testing, offered complimentary in-store equipment repair services, introduced the industry’s first loyalty program, and developed an expansive platform of owned and exclusive brands. These differentiated capabilities allow us to meet the needs of any pool and spa owner, whether they care for their pool or spa themselves or rely on a professional, whenever, wherever, and however they choose to engage with us.
2
Our Competitive Strengths
We believe that the following competitive strengths have been key drivers of our success to date, and strategically position us for continued success.
Undisputed direct-to-consumer market leader in the aftermarket pool and spa care industry.
For 58 years, we have been dedicated to addressing our consumers’ pool needs so they can spend less time maintaining and more time enjoying their pools. We are the only direct-to-consumer pool and spa care brand with a nationwide physical presence and an integrated digital platform, consisting of individually merchandised e-commerce websites, a mobile app with transaction capabilities, and online marketplace operations, designed to address the needs of all pool and spa consumers. The remainder of the industry is highly fragmented across both offline and online providers.
Direct relationships with more than 12 million pool and spa owners and professionals, generating durable, annuity-like economics.
We are the largest national pool and spa care brand with a direct relationship with pool and spa owners and the professionals who serve them. Across our integrated platform, we have more than 12 million consumers who rely on us for their ongoing pool and spa care needs. Through our team of highly trained pool and spa experts, we offer sophisticated product recommendations and other expert advice, which cultivates long-standing relationships with our consumers. The comprehensive nature of our product and service offering eliminates the need for consumers to leave the Leslie’s ecosystem, driving exceptional retention with annuity-like economics. We define “direct relationships” as the number of unique customers for whom we have a mailing address, a phone number, or an email address.
Consumer-centric connected ecosystem for all pool and spa owners and the professionals who serve them using proprietary, leading brands across all channels.
We have built the most extensive and geographically diverse pool and spa care network in the United States. Our locations are strategically located in densely populated areas mainly throughout the Sunbelt, including California, Arizona, Texas, and Florida. Across our physical network, we employ a team of approximately 3,700 associates, including pool and spa care experts and service technicians, who act as solution providers to all of our consumers, including both do-it-yourself (“DIY”) and do-it-for-me (“DIFM”) pool owners as well as pool professionals.
As the world has become more digitally focused, we have focused on architecting an industry-leading integrated digital platform of proprietary e-commerce websites designed to serve our residential and professional consumers. Our proprietary e-commerce websites serve digital consumers through curated pricing and targeted merchandising strategies. In addition to our owned e-commerce websites, we also offer our products through online marketplaces such as Amazon, eBay, and Walmart. As a result of our strategic investments in digital, we are uniquely positioned to serve our consumers with cross-channel capabilities and capture incremental online demand from new consumers while growing the total profitability of the network.
Comprehensive assortment of proprietary brands with recurring, essential, superior product formulations, and trusted, solution-based services for all consumers.
We offer a comprehensive product assortment, consisting of more than 30,000 products across chemicals, equipment and parts, cleaning and maintenance equipment, and safety, recreational, and fitness-related categories. Approximately 80% of our product sales are non-discretionary and recurring in nature. In addition, approximately 55% of our total sales and 85% of our chemical sales are derived from proprietary brands and custom-formulated products, which allows us to create an entrenched consumer relationship, optimize our supply chain, and capture attractive margins. Consumers choose our exclusive, proprietary brands and custom-formulated products for their efficacy and value, a combination that we believe cannot be found elsewhere.
We pair our comprehensive product assortment with differentiated in-store and on-site service offerings. We pioneered the complimentary in-store water test and resulting pool or spa water prescription, which has driven consumer traffic and loyalty, and has created a “pharmacist-like” relationship with our consumers. We recently developed and introduced significant upgrades to our water testing capabilities with the launch of our AccuBlue® platform. The AccuBlue® testing device screens for nine distinct water quality criteria. Our in-store experts leverage our proprietary AccuBlue® water diagnostics software engine to offer our consumers a customized prescription and treatment plan using our comprehensive range of exclusive products, walking them through product use sequencing step-by-step. These detailed and sophisticated treatment algorithms are supported by our differentiated water treatment expertise built over decades. Historically, we have found that consumers who test their water with us regularly spend more with us per year than those who do not, underscoring the importance of this acquisition and retention vehicle. We also employ the industry’s largest network of
3
in-field technicians who perform on-site evaluations, installation, and repair services for residential consumers and professional pool operators.
Attractive financial profile characterized by consistent, profitable growth, and strong cash flow conversion offering multiple levers to drive shareholder value.
We have delivered 58 consecutive years of sales growth, demonstrating our ability to deliver strong financial results through all economic cycles. Our growth has been broad-based across residential pool, residential spa and professional pool consumers and has been driven by strong retention and profitable acquisition of sticky, long-term consumer relationships. Due to our scale, vertical integration, and operational excellence, we maintain high profitability. Due to our low maintenance capital intensity, we generate strong cash flows. As a result of our attractive financial profile, we have significant flexibility with respect to capital allocation, giving us the ability to drive long-term shareholder value through various operating and financial strategies.
Highly experienced and visionary management team that combines deep industry expertise and advanced direct-to-consumer capabilities.
Our strategic vision and culture are directed by our executive management team under the leadership of our Chief Executive Officer, Michael R. Egeck, and our Executive Vice President and Chief Financial Officer, Steven M. Weddell. Our well-balanced executive management team is comprised of leaders with decades of experience in the pool and spa care industry as well as recently hired executives who bring new expertise and capabilities to Leslie’s from outside industries. Our management team is uniquely capable of executing upon our strategic vision and successfully continuing to create long-term shareholder value.
Our Growth Strategies
We believe we are well positioned to drive sustainable growth and profitability over the long-term by executing on the following strategies:
Grow our consumer file.
We believe we have significant opportunity to acquire new residential consumers and reactivate lapsed residential consumers, which we plan to do by executing on the following strategies:
Increase share of wallet among existing consumers.
We believe we have a significant opportunity to increase spend from existing consumers and drive higher lifetime value. We plan to do this by executing on the following strategies:
4
Grow additional share in the professional market.
We believe we have a significant opportunity to grow our sales with pool care professionals, who individually spend more than 25x as much as residential consumers on pool supplies and equipment.
Our research suggests that small and mid-size pool professionals value convenience and referrals, both of which we are uniquely positioned to offer given our 950+ locations and industry’s largest consumer file. We plan to expand our physical network of PRO locations, which specifically cater to pool professionals, by opening new locations and selectively remodeling existing residential locations. We believe there is significant whitespace opportunity to operate more than 200 total PRO locations across the United States. We have begun to assemble an affiliated network of qualified pool professionals through our PRO Partner program, extending the Leslie’s name into water maintenance. To further benefit pool care professionals, we launched our Leslie’s PRO e-commerce website in June 2021. This website provides all of the online tools needed for professionals to serve their respective communities and grow their pool care businesses. We believe that this initiative represents a natural adjacency and will resonate with existing residential consumers as well as help attract new residential consumers.
Utilize strategic M&A to consolidate share and further enhance capabilities.
The aftermarket pool and spa industry remains highly fragmented, which offers attractive opportunities to utilize strategic M&A to drive consolidation. We have historically used, and plan to continue to use, strategic acquisitions to obtain consumers and capabilities in both new and existing markets. We completed three bolt-on acquisitions during fiscal 2021 and continue to look for opportunities that will strategically benefit our business. We believe that we are the consolidator of choice in the industry, and we will continue to focus on acquiring high quality, market-leading businesses with teams, capabilities, and technologies that uniquely position us to create value by applying best practices across our entire physical and digital network to better serve new and existing consumer types.
Addressing underserved residential whitespace.
We have identified more than 700 underserved residential pool and spa care markets in the continental United States. With our omni-channel capabilities, successful track record of new location openings, and targeted digital marketing tactics, we believe we are well positioned to capitalize on this meaningful whitespace opportunity. We plan to assess each market independently and determine the most capital efficient way to serve these trade areas using a mix of digital assets and locations.
Continue to introduce disruptive innovation.
Leslie’s has a legacy of disruptive innovation in the pool and spa care industry. We plan to continue that legacy by continuously developing and introducing capabilities that create value for our consumers. Present areas of focus include water testing, maintenance prescriptions, new product offerings, and our product distribution ecosystem.
As the Internet of Things wave continues, we believe consumers will seek the convenience of “smart” home functionality in more facets of their daily lives. We perceive this as an opportunity to introduce a full service, connected home solution that effectively automates pool maintenance, including actively monitoring our consumers’ water, diagnosing, developing, and prescribing a treatment plan, and delivering to their home the assortment of products needed to maintain a clear, safe, beautiful pool.
Accordingly, in fiscal 2021 we successfully launched a pilot of our AccuBlue HomeTM program, a subscription based offering that enables pool and spa owners to confidently test and treat their pools and spas without ever having to leave their backyard. Using the new, industry-leading AccuBlue HomeTM connected device and the Leslie’s mobile app, program members can test all critical aspects of their water chemistry with ease and generate a custom treatment plan tailored to the specifications of their pool or spa. Within the Leslie’s mobile app, consumers can review their prescription, order the products they need, and have them delivered right to their door or arrange for a same-day pick-up at their local Leslie’s location. We plan to introduce enhancements and expand the program.
Our Industry
We operate in the aftermarket pool and spa care industry, which is broadly comprised of: (i) chemicals; (ii) equipment, parts, and accessories; and (iii) services. The United States market consists of millions of installed pools and spas, which require routine maintenance throughout their lifetime. We estimate the average in-ground pool owner spends $800 each year on the chemicals, equipment, parts, and accessories needed to maintain their pool. Neglecting pool maintenance is not a viable option, as it can result in equipment failure, structural damage, or other costly issues. This drives an annuity-like stream of demand for the chemicals and products necessary to properly maintain a pool or spa.
5
While we benefit from the growth in the installed base, our business is not dependent on new pool construction activity and can generate strong growth from a fixed installed base through increased pool usage, more frequent sanitization, and recurring maintenance needs.
Seasonality
Our business is highly seasonal. In general, sales and earnings are highest during our third and fourth fiscal quarters, which include April through September and represent the peak months of swimming pool use. Sales are substantially lower during our first and second fiscal quarters.
Our Consumers
We strategically serve all consumers within the aftermarket pool and spa care industry including Residential Pool, Residential Spa, and Professional Pool consumers.
Our Product and Service Offering
We offer a comprehensive assortment of more than 30,000 products across chemicals, equipment and parts, cleaning and maintenance equipment, and safety, recreational, and fitness related products. Historically, approximately 80% of our assortment has been comprised of essential and non-discretionary products that are needed by residential and professional consumers to care for pools and spas. The vast majority of our assortment features non-discretionary products that are shelf-stable and generally not prone to either obsolescence or shrinkage, which could occur from changing technology or consumer buying habits. As the trusted one-stop destination for all aftermarket pool and spa needs, we provide an extensive and highly differentiated product offering. We aim to fulfill the needs of our residential and professional consumers with our comprehensive assortment, in-stock inventory, and product selection across a broad range of premium third-party and proprietary brands.
Since our inception in 1963, we have offered a portfolio of owned and exclusive brands. We continue to expand our selection of exclusive offerings through innovation, most recently with the launch of the Jacuzzi® and our RightFit® brands in 2016. Our exclusive brands and products account for approximately 55% of total sales and 85% of chemical sales. These proprietary brands and custom-formulated products are only available through our integrated platform and offer professional-grade quality to our consumers, while allowing us to achieve higher gross margins relative to sales of third-party products.
In addition to our comprehensive product assortment, we offer critical services, such as complimentary water testing and in-store equipment repair. We also employ a large in-field service network of pool and spa care service professionals who have the expertise to provide essential on-site equipment installation and repair services for residential consumers and professional pool operators throughout the continental United States.
6
Our Integrated Platform
We operate an integrated platform consisting of locations, distribution centers, and proprietary e-commerce websites.
Our Vertically Integrated Model
We operate a vertically integrated supply chain, packaging, and distribution model, which represents a significant competitive advantage.
Our vertically integrated supply chain enables us to produce and package products at our company-operated packaging plants and third-party contract packaging facilities. Our strategy is to identify, produce, and package high volume items that do not require sophisticated or capital-intensive production or packaging equipment, but allow us to offer our consumers a premium product while offering us a significant cost advantage. We source a variety of raw materials and chemicals directly from a diversified supplier base; we maintain strong relationships with these suppliers. During fiscal 2021, we made strategic investments in inventory and two suppliers each represented more than 10% of our annual purchases. Using these raw materials, we manufacture and package a wide selection of final SKUs, including, but not limited to, chlorine products, pH adjusters, and filter cleaners. A significant portion of our total mix is comprised of products that we manufacture or package through vertical integration, which offers economies of scale that has resulted in higher quality products and a structurally advantaged margin profile.
We also operate a vertically integrated distribution and delivery model. In addition to operating two manufacturing plants, we operate a national network of Company-operated distribution centers as well as third-party distribution centers. Our Company-operated distribution centers have the capacity to carry a broad breadth of our products in significant quantities and are capable of replenishing inventory throughout our physical network. From these facilities, we self-distribute to our physical network through an owned fleet of tractors and trailers, which helps ensure optimal in-stock levels throughout the year. Our third-party distribution centers are strategically located to complement our company-operated distribution centers and primarily fulfill online orders.
Our Marketing Strategy
We believe there is significant potential to drive increased share of wallet among our existing consumers through strategic initiatives such as our loyalty membership program and dynamic promotions.
Due to the highly recurring, replenishment nature of our product mix and long-term consumer relationships, we believe that our investments in consumer acquisition marketing generate highly attractive returns. However, we have not traditionally invested
7
significant dollars in new consumer acquisition. Historically, the vast majority of this spend has been directed toward retention rather than new consumer acquisition.
We are now profitably growing our investment in new consumer acquisition. We know the location of pools and spas throughout the United States, and by leveraging this information, we have the ability to allocate our advertising dollars in a highly targeted manner. Additionally, we have added experienced marketing talent with significant expertise in analytics and performance marketing to grow our consumer file. Through these strategies, we plan to increase brand awareness and continue profitably acquiring new consumers.
Our Competition
The United States aftermarket pool and spa care industry is fragmented and competitive. We compete against a wide range of manufacturers, retailers, distributors, and service providers in the residential and professional pool and spa care market. This includes original equipment manufacturers, regional and local retailers, home improvement retailers, mass-market retailers, and specialty e-commerce operators. Key competitive groups include:
Our competitors offer pool care products and services of varied quality and across a wide range of retail price points. We experience greater brick and mortar competition in the states with the largest installed pool bases, including California, Texas, Florida, and Arizona. While some of our competitors also market and sell online, there are various challenges to serving consumers in the aftermarket pool and spa care industry via e-commerce. These challenges include regulatory restrictions on shipping hazardous materials, the need for professional installation of equipment at point of delivery, and the need for regular water testing, expert advice, and customized prescriptions and solutions related to the sale of chemicals. In addition, due to the seasonality of the aftermarket pool and spa care industry, several competitors only stock related products during the summer months, and their product assortment tends to be limited to basic offerings.
Human Capital Resources
As of October 2, 2021 we employed approximately 3,700 employees. Of these employees, approximately 2,650 work in our physical network, approximately 250 work as in-field service technicians, approximately 450 work in corporate, infrastructure, or e-commerce, and approximately 325 work in our distribution centers. We believe that we have good relations with our employees. None of our employees are currently covered under any collective bargaining agreements.
We consider our employees to be the foundation for our growth and success. As such, our future success depends in large part on our ability to attract, train, retain, and motivate qualified personnel. The growth and development of our workforce is an integral part of our success. We place a priority on promoting from within. Over the last three years, approximately 70% of our retail and corporate management openings have been filled by existing employees.
We are also committed to developing and fostering a culture of diversity and inclusion and know that a company’s ultimate success is directly linked to its ability to identify and hire talented individuals from all backgrounds and perspectives.
Trademarks and Other Intellectual Property
In the course of our business, we employ various trademarks, trade names and service marks, including Leslie’s®, AccuBlue®, AccuBlue HomeTM, MyLife®, and our logo, in packaging and advertising our products. We have registered trademarks and trade names for several of our major products on the Principal Register of the United States Patent and Trademark Office. We distinguish the products produced in our chemical repackaging operation or by third-party repackagers at our direction through the use of the Leslie’s brand
8
name and logo and the trademarks and trade names of the individual items, none of which is patented, licensed, or otherwise restricted to or by us. We believe the strength of our trademarks and trade names has been beneficial to our business and we intend to continue to protect and promote our trademarks in appropriate circumstances.
Leslie’s®, AccuBlue®, AccuBlue HomeTM, MyLife®, and other trademarks, trade names or service marks of Leslie’s, Inc. appearing in this Annual Report on Form 10-K are the property of Leslie’s, Inc. All other trademarks, trade names, and service marks appearing in this Annual Report on Form 10-K are the property of their respective owners.
Available Information
Our web site address is www.lesliespool.com. Information contained on our website or connected thereto does not constitute a part of this Annual Report on Form 10-K or any other filing we make with the SEC. We make available on this web site under the “Investor Relations” section, free of charge, our annual reports on Form 10-K, quarterly reports on Form 10-Q and current reports on Form 8-K, and amendments to those reports, as soon as reasonably practicable after we electronically file those materials with, or furnish them, to the SEC. The SEC also maintains a web site that contains reports, proxy and information statements, and other information regarding issuers that file electronically with the SEC at www.sec.gov.
Note Regarding Third-Party Information
This Annual Report on Form 10-K includes market data and certain other statistical information and estimates that are based on reports and other publications from industry analysts, market research firms, and other independent sources, as well as management’s own good faith estimates and analyses. We believe these third-party reports to be reputable, but have not independently verified the underlying data sources, methodologies, or assumptions. Information that is based on estimates, forecasts, projections, market research, or similar methodologies is inherently subject to uncertainties, and actual events or circumstances may differ materially from events and circumstances reflected in this information.
9
Item 1A. Risk Factors.
Investing in our common stock involves a high degree of risk. You should carefully consider the risks described below in addition to the other information set forth in this Annual Report on Form 10-K, including the Management’s Discussion and Analysis of Financial Condition and Results of Operations section and the combined financial statements and related notes, before making an investment decision. The risks described below are not the only ones we face. The occurrence of any of the following risks or additional risks and uncertainties not presently known to us or that we currently believe to be immaterial could materially and adversely affect our business, financial condition, prospects or results of operations. In such case, the trading price of our common stock could decline, and you may lose all or part of your original investment. Our actual results could differ materially from those anticipated in the forward-looking statements as a result of specific factors, including the risks and uncertainties described below.
Additionally, the COVID-19 pandemic may amplify many of the risks discussed below to which we are subject and, given the unpredictable, unprecedented and fluid nature of the pandemic, it may materially and adversely affect us in ways that are not anticipated by or known to us or that we do not consider to present significant risk. Therefore, we are unable to estimate the extent to which the pandemic and its related impacts will adversely affect our business, financial condition and results of operations.
Summary of Risk Factors
The following summarizes the risks facing our business, all of which are more fully described below. This summary should be read in conjunction with Risk Factors below and should not be relied upon as an exhaustive summary of the material risks facing our business. The order of presentation is not necessarily indicative of the level of risk that each factor poses to us.
Risks Related to the Nature of Our Business:
Risks Related to Our Industry and the Broader Economy
Technology and Privacy Related Risks
10
Risks Related to Our Business Strategy
Risks Related to the Manufacturing, Processing, and Supply of Our Products
Risks Related to Commercialization of Our Products
Risks Related to Government Regulation
Risks Related to Intellectual Property Matters
Risks Related to Our Indebtedness
11
Risks Related to Ownership of Our Common Stock
Risks Related to the Nature of Our Business
Our success depends on our ability to maintain or increase comparable sales, and if we are unable to achieve comparable sales growth, our profitability and performance could be materially adversely impacted.
Our success depends on increasing comparable sales through our merchandising strategy and ability to increase sales and profits. To increase sales and profits, and therefore comparable sales growth, we focus on delivering value and generating consumer excitement by staffing our locations with pool and spa experts, developing compelling products, optimizing inventory management, maintaining strong location conditions, and effectively marketing current products and new product offerings. If these efforts become less successful, we may not be able to maintain or improve the levels of comparable sales that we have experienced in the past, which could adversely impact our profitability and overall business results. In addition, competition and pricing pressures from competitors may also materially adversely impact our operating margins. Our comparable sales growth could be lower than our historical average or our future target for many reasons, including general economic conditions, operational performance, price inflation or deflation, industry competition, new competitive entrants near our locations, price changes in response to competitive factors, the impact of new locations entering the comparable base, cycling against any year or quarter of above-average sales results, unfavorable weather conditions, supply shortages or other operational disruptions, the number and dollar amount of consumer transactions in our locations, our ability to provide product or service offerings that generate new and repeat visits to our locations, and the level of consumer engagement that we provide in our locations. Opening new locations in our established markets may result in inadvertent oversaturation, temporary or permanent diversion of consumers and sales from our existing locations to new locations and reduced comparable sales, thus adversely affecting our overall financial performance. These factors may cause our comparable sales results to be materially lower than in recent periods, which could harm our profitability and business.
Past growth may not be indicative of future growth.
Historically, we have experienced substantial sales growth through organic market share gains, new location openings and acquisitions that have increased our size, scope, and geographic footprint. Our various business strategies and initiatives, including our growth initiatives, are subject to business, economic and competitive uncertainties and contingencies, many of which are beyond our control. While we contemplate continued growth through internal expansion and acquisitions, we may not be able to:
12
If we do not manage these factors successfully, our operating results could be adversely affected.
We may not be able to successfully manage our inventory to match consumer demand, which could have a material adverse effect on our business, financial condition, and results of operations.
We base our inventory purchases, in part, on our sales forecasts. If our sales forecasts overestimate consumer demand, we may experience higher inventory levels, which could result in the need to sell products at lower than anticipated prices, leading to decreased profit margins. Conversely, if our sales forecasts underestimate consumer demand, we may have insufficient inventory to meet demand, leading to lost sales, either of which could materially adversely affect our financial performance.
Loss of key members of management or failure to attract, develop, and retain highly qualified personnel could adversely affect our business.
Our future success depends on the continued efforts of the members of our executive management team. If one or more of our executives or other key personnel are unable or unwilling to continue in their present positions, or if we are unable to attract and retain high-quality executives or key personnel in the future, our business may be adversely affected.
We consider our employees to be the foundation for our growth and success. As such, our future success depends in large part on our ability to attract, train, retain, and motivate qualified personnel. During the height of our seasonal activities, we hire additional employees, including seasonal and part-time employees who generally are not employed during the off-season. If we are unable to attract and hire additional personnel during these seasons, our operating results could be adversely affected.
We are subject to, and may in the future be subject to, legal or other proceedings that could have a material adverse effect on us.
From time to time, we are a party to legal proceedings, including matters involving personnel and employment issues, personal injury, antitrust claims, intellectual property claims, and other proceedings arising in or outside of the ordinary course of business. In addition, there are an increasing number of cases being filed against companies generally, including class-action allegations under federal and state wage and hour laws. We could be exposed to legal proceedings arising out of the COVID-19 pandemic, including wrongful death actions brought on behalf of employees who contracted COVID-19 while performing their employment-related duties. We estimate our exposure to these legal proceedings and establish reserves for the probable and reasonably estimated liabilities. Assessing and predicting the outcome of these matters involves substantial uncertainties. Although not currently anticipated by management, unexpected outcomes in these legal proceedings or changes in management’s forecast assumptions or predictions could have a material adverse impact on our results of operations.
Disruptions from natural or man-made disasters or extreme weather, public safety issues, geopolitical events and security issues, labor or trade disputes, and similar events could have a material adverse effect on our business.
Natural or man-made disasters or extreme weather (including as a result of climate change), public safety issues, geopolitical events and security issues (including terrorist attacks and armed hostilities), labor or trade disputes, and similar events can lead to uncertainty and have a negative impact on demand for our products, in addition to causing disruptions to our supply chain. Discretionary spending on chemicals, equipment and parts, cleaning and maintenance equipment, and safety, recreational, and fitness-related products, such as ours, is generally adversely affected during times of economic, social, or political uncertainty. The potential for natural or man-made disasters or extreme weather, geopolitical events and security issues, labor or trade disputes, and similar events could create these types of uncertainties and negatively impact our business for the short- or long-term in ways that cannot presently be predicted.
13
Risks Related to Our Industry and the Broader Economy
We face competition by manufacturers, retailers, distributors, and service providers in the residential and professional pool and spa care market.
Within our industry, competition is highly fragmented. We compete against a wide range of manufacturers, retailers, distributors, and service providers in the residential and professional pool and spa care market. This includes original equipment manufacturers, regional and local retailers, home improvement retailers, mass-market retailers, and specialty e-commerce operators.
Most of our competition comes from regional and local independent retailers. National home improvement and retailers, such as Home Depot, Lowe’s, and local and regional hardware stores, compete with us mainly on a seasonal basis during the spring and summer months, but experience significantly higher foot traffic than our retail locations. We also face competition from mass-market retail competitors, such as Walmart, and Costco, who devote shelf space to merchandise and products targeted to our consumers, as well as online mass-market retailers such as Amazon who devote online categories to merchandise and products targeted to our consumers. Historically, mass-market retailers have generally expanded by adding new stores and product breadth, but their product offering of pool-related products has remained relatively constant. If pool and spa owners are attracted by the convenience afforded by any of our competitors, they may be less inclined to purchase products and/or services from us.
In addition, new competitors may emerge as there are no proprietary technologies or other significant barriers to prevent other firms from entering the swimming pool and spa supply retail market in the future. Should store and internet-based mass-market retailers increase their focus on the pool and spa industry, or increase the breadth of their pool, spa, and related product offerings, they may become a more significant competitor for our industry, which could have an adverse impact on our business. We may face additional competitive pressures if large pool supply retailers look to expand their consumer base. Given the density and demand for pool and spa products, some geographic markets that we serve also tend to have a higher concentration of competitors than others, particularly Arizona, California, Florida, and Texas. These states encompass our largest markets and entry of significant new competitors into them could have a substantial impact on our total sales.
The demand for our swimming pool and spa related products and services may be adversely affected by unfavorable economic conditions.
Consumer discretionary spending affects our sales and is impacted by factors outside of our control, including general economic conditions, the residential housing market, unemployment rates and wage levels, interest rate fluctuations, inflation, disposable income levels, consumer confidence, and access to credit. In economic downturns, the demand for swimming pool and spa related products and services may decline, often corresponding with declines in discretionary consumer spending, the growth rate of pool-eligible households, and swimming pool construction. A weak economy may also cause consumers to defer discretionary replacement and refurbishment activity. Even in generally favorable economic conditions, severe and/or prolonged downturns in the housing market could have a material adverse impact on our financial performance. Similarly, slow growth in the number of pool-eligible households can have a lasting negative impact by limiting the potential for future growth of the pool and spa maintenance market.
We believe that homeowners’ access to consumer credit is a critical factor enabling the purchase of new pools, spas and related products. Unfavorable economic conditions and downturn in the housing market can result in significant tightening of credit markets, which limit the ability of consumers to access financing for new swimming pools, spas, and related supplies, and consequently, replacement, repair and maintenance of equipment. Tightening consumer credit could prevent consumers from obtaining financing for pool and spa projects, which could negatively impact our sales of products and services.
The outbreak of COVID-19 and associated responses could adversely impact our business and results of operations.
The COVID-19 pandemic has significantly impacted economic activity and markets throughout the world. In response, governmental authorities have imposed, and others in the future may impose, stay-at-home orders, shelter-in-place orders, quarantines, executive orders, and similar government orders and restrictions to control the spread of COVID-19. Such orders or restrictions have resulted in temporary location closures, limitation of location hours, limitations on the number of people in locations or in warehouses, enhanced requirements on sanitation, social distancing practices, and travel restrictions, among other effects. We currently operate as an essential business under substantially all relevant state and local regulations and if this changes, it will adversely impact our financial condition and operating results. Recently, there have been reports of increasing numbers of new COVID-19 cases in certain of our markets, resulting in some governments extending or re-imposing restrictions. Accordingly, COVID-19 may have negative impacts on our business in the future, and any future adverse impacts on our business may be worse than we anticipate. The ultimate impact will depend on the severity and duration of the current COVID-19 pandemic and future resurgences and actions taken by governmental
14
authorities and other third parties in response, each of which is uncertain, rapidly changing, and difficult to predict. Our recent growth rates amid the COVID-19 pandemic may not be sustainable and may not be indicative of future growth.
The demand for pool chemicals may be affected by consumer attitudes towards products for environmental or safety reasons.
We could be adversely affected if consumers lose confidence in the safety and quality of our products. The demand for the pool chemicals sold by us may also be affected by changes in consumer attitudes toward pool chemical products for environmental or safety reasons. To the extent more environmentally-friendly alternative pool and spa water treatment methods emerge, we may not be successful in adopting them in a timely manner.
Our results of operations may fluctuate from quarter to quarter for many reasons, including seasonality.
Our sales are highly seasonal and we experience fluctuations in quarterly results as a result of many factors. We have historically generated a greater percentage of our revenues during the warm weather months of April through September. Timing of consumer purchases will vary each year and sales can be expected to shift from one quarter to another. As a result, management believes that period-to-period comparisons of results of operations are not necessarily meaningful and should not be relied upon as any indication of future performance or results expected for the fiscal year. In addition, because our revenues are concentrated to a limited number of months, our business is more susceptible to adverse events occurring in those months than other businesses that have consistent levels of revenue throughout the year.
We are susceptible to adverse weather conditions.
Given the nature of our business, weather is one of the principal external factors affecting our business. Unseasonably cool weather or significant amounts of rainfall during the peak sales season can reduce chemical consumption in pools and spas and decrease consumer purchases of our products and services. In addition, unseasonably early or late warming trends can increase or decrease the length of the pool season and impact timing around pool openings and closings and, therefore, our total sales and timing of our sales. While warmer weather conditions favorably impact our sales, global warming trends and other significant climate changes can create more variability in the short-term or lead to other unfavorable weather conditions that could adversely impact our sales or operations. Drought conditions or water management initiatives may lead to municipal ordinances related to water use restrictions. Such restrictions could result in decreased pool installations, which could negatively impact our sales.
Certain extreme weather events, such as hurricanes and tropical storms, may impact demand for our products and services, our ability to deliver our products, provide services, continue to keep our facilities open and operational, or cause damage to our facilities. As a consequence of these or other catastrophic or uncharacteristic events, we may experience interruption to our operations, increased costs or loss of property, equipment or inventory, which would adversely affect our revenue and profitability.
Technology and Privacy Related Risks
If the technology-based systems that give our consumers the ability to shop with us online do not function effectively, our operating results, as well as our ability to grow our e-commerce business globally, could be materially adversely affected.
Many of our consumers shop with us through our physical network and digital platform, which includes our proprietary mobile app and e-commerce websites. Increasingly, consumers are using tablets and smart phones to shop online with us and with our competitors and to do comparison shopping. We are increasingly using social media and our proprietary mobile app to interact with our consumers and as a means to enhance their shopping experience. Any failure on our part to provide an attractive, effective, reliable, and user-friendly digital platform that offers a wide assortment of merchandise with rapid delivery options and that continually meets the changing expectations of online shoppers could place us at a competitive disadvantage, result in the loss of e-commerce and other sales, harm our reputation with consumers, have a material adverse impact on the growth of our e-commerce business globally, and could have a material adverse impact on our business and results of operations.
Our e-commerce operation faces distinct risks, such as the failure to make and implement changes to our e-commerce websites and mobile app, the failure to maintain a relevant consumer experience in understanding and interacting with our e-commerce websites and mobile app, telecommunications disruptions, reliance on third-party software technologies, and rapid changes in technology, among others. If not managed effectively, these risks could adversely impact our operating results.
15
A significant portion of our digital sales take place through online marketplaces and online retailers and any limitation or restriction, temporarily or otherwise, to sell on these online platforms could harm our profitability and results of operation.
Marketplace storefronts complement our platform of branded proprietary e-commerce websites. A significant portion of our digital sales take place through online marketplaces and online retailers and are subject to their terms of service and their various other policies. While we endeavor to materially comply with the terms of service and other policies of each online marketplace and online retailer through which we sell our products, these online marketplaces or online retailers may not have the same determination with respect to our compliance. These online marketplaces and online retailers may, in certain circumstances, refuse to continue hosting us or selling our products or temporarily suspend or discontinue our access to their online platform and any limitation or restriction (whether temporary or otherwise) on our ability to sell our products through these online platforms could harm our profitability and results of operations.
We rely on information technology systems to support our business operations. A significant disturbance or breach of our technological infrastructure could adversely affect our financial condition and results of operations. Additionally, failure to maintain the security of confidential information could damage our reputation and expose us to litigation.
Information technology (“IT”) supports several aspects of our business, including, among others, product sourcing, pricing, consumer service, transaction processing, financial reporting, collections, and cost management. Our ability to operate effectively on a day-to-day basis and accurately report our results depends on a solid technological infrastructure, which may be susceptible to internal and external threats. We are vulnerable to interruption by fire, natural disaster, power loss, telecommunication failures, internet failures, security breaches, catastrophic events, and other significant disruptions. Exposure to various types of cyberattacks such as malware, computer viruses, worms, or other malicious acts, as well as human error and technological malfunction, could also potentially disrupt our operations or result in a significant interruption in the delivery of our goods and services.
We also may experience occasional system interruptions and delays, as a result of routine maintenance, periodic updates, or other factors, that make our information systems unavailable or slow to respond, including the interaction of our information systems with those of third parties. A lack of sophistication or reliability of our information systems could adversely impact our operations and consumer service and could require major repairs or replacements, resulting in significant costs and foregone revenue.
Our numerous procedures and protocols designed to mitigate cybersecurity risks (including processes for timely notification of appropriate personnel, for assessment and resolution of cybersecurity incidents, and for company-wide training programs, our investments in information technology security and our updates to our business continuity plan) may not prevent or effectively mitigate adverse consequences from cybersecurity risks. Any failure by us to maintain or protect our information technology systems and data integrity, including from cyberattacks, intrusions or other breaches, could result in the unauthorized access to consumer data, credit card information, and personally identifiable information, theft of intellectual property or other misappropriation of assets, or otherwise compromise our confidential or proprietary information and disrupt our operations, putting us at a competitive disadvantage. Such a breach could result in damage to our reputation and subject us to potential litigation, liability, fines, and penalties, resulting in a possible material adverse impact on our financial condition and results of operations.
Improper activities by third parties, exploitation of encryption technology, new data-hacking tools and discoveries, and other events or developments may result in future intrusions into or compromise of our networks, payment card terminals or other payment systems.
We may not be able to anticipate the frequently changing techniques used to obtain unauthorized access to sensitive data or implement adequate preventive measures for all of them. Any unauthorized access into our consumers’ sensitive information, or data belonging to us or our suppliers, even if we are compliant with industry security standards, could put us at a competitive disadvantage, result in deterioration of our consumers’ confidence in us, and subject us to potential litigation, liability, fines, penalties, and consent decrees, resulting in a possible material adverse impact on our financial condition and results of operations.
As a merchant that accepts debit and credit cards for payment, we are subject to the Payment Card Industry Data Security Standard (“PCI DSS”) issued by the PCI Council and to the American National Standards Institute (“ANSI”) data encryption standards and payment network security operating guidelines, as well as the Fair and Accurate Credit Transactions Act (“FACTA”). Failure to comply with these guidelines or standard may result in the imposition of financial penalties or the allocation by debit and credit card companies of the costs of fraudulent charges to us. Despite our efforts to comply with these or other payment card standards and other information security measures, we cannot be certain that all of our IT systems will be able to prevent, contain, or detect all cyberattacks or intrusions from known malware or malware that may be developed in the future. To the extent that any disruption results in the loss, damage, or misappropriation of information, we may be adversely affected by claims from consumers, financial institutions, regulatory authorities, payment card associations, and others. In addition, privacy and information security laws and standards continue to evolve and could
16
expose us to further regulatory burdens. The cost of complying with stricter laws and standards, including PCI DSS, ANSI, and FACTA data encryption standards and the California Consumer Privacy Act, which took effect in January 2020, and the California Privacy Rights Acts, which is expected to take effect on January 1, 2023, could be significant.
Risks Related to Our Business Strategy
We may acquire other companies or technologies, which could fail to result in a commercial product or sales, divert our management’s attention, result in additional dilution to our stockholders, and otherwise disrupt our business.
We may in the future seek to acquire or invest in businesses or technologies that we believe could complement or expand our portfolio, enhance our technical capabilities, or otherwise offer growth opportunities. We may not be able to successfully complete any acquisition we choose to pursue and we may not be able to successfully integrate any acquired business, product or technology in a cost-effective and non-disruptive manner. The pursuit of potential acquisitions may divert the attention of management and cause us to incur various costs and expenses in identifying, investigating, and pursuing suitable acquisitions, whether or not they are consummated. We may not be able to identify desirable acquisition targets or be successful in entering into an agreement with any particular target or obtain the expected benefits of any acquisition or investment. Similarly, we may not be able to successfully identify and acquire new technologies in a timely manner or at all. Acquisitions could also result in dilutive issuances of equity securities, the use of our available cash, or the incurrence of debt, which could harm our operating results. In addition, if an acquired business fails to meet our expectations, our business, financial condition, and results of operations may be negatively affected.
Our operating results will be harmed if we are unable to effectively manage and sustain our future growth or scale our operations.
We may not be able to manage our growth or future growth efficiently or profitably. Our revenue and operating margins, or revenue and margin growth, may be less than expected. If we are unable to scale our operations efficiently or maintain pricing without significant discounting, we may fail to achieve expected operating margins, which would have a material and adverse effect on our operating results. Growth may also stress our ability to adequately manage our operations, quality of products, safety, and regulatory compliance. If growth significantly decreases, it will negatively impact our cash reserves, and it may be necessary to obtain additional financing, which may increase indebtedness or result in dilution to shareholders. Further, we may not be able to obtain additional financing on acceptable terms, if at all.
Risks Related to the Manufacturing, Processing, and Supply of Our Products
Our business includes the packaging and storage of chemicals and an accident related to these chemicals could subject us to liability and increased costs.
We operate chemical repackaging facilities and we store chemicals in our locations and in our distribution facilities. Because some of the chemicals we repackage and store are hazardous materials, we must comply with various fire and safety ordinances. However, a release at a location or a fire at one of our facilities could give rise to liability claims against us and potential environmental liability. In addition, if an incident involves a repackaging or distribution facility, we might be required temporarily to use alternate sources of supply that could increase our cost of sales.
We cannot guarantee that our insurance coverage will be adequate to cover future claims that may arise or that we will be able to maintain adequate insurance in the future at rates we consider reasonable. Successful claims for which we are not fully insured may adversely affect our working capital and profitability. In addition, changes in the insurance industry have generally led to higher insurance costs and decreased availability of coverage.
Notwithstanding our internal training curriculum and compliance programs, we cannot guarantee that our employees will follow the applicable operating procedures and regulations, or that no accidents or incidents will arise that could expose us to liability and have a negative impact on our operations and results.
Product supply disruptions may have an adverse effect on our profitability and operating results.
We rely on various suppliers and vendors to provide and deliver product inventory on a continuous basis, some of which are located outside of the United States. These suppliers (and those they depend upon for materials and services) are subject to risks, including from natural or man-made disasters or extreme weather (including as a result of climate change), public safety issues, geopolitical events and security issues (including terrorist attacks and armed hostilities), power outages, labor or trade disputes, union organizing activities, financial liquidity problems, and similar events, as well as supply constraints and general economic, social, and political conditions that can limit their ability to provide us (or our suppliers) with quality products and services in a timely manner. The occurrence of these or other unexpected events can cause us to suffer significant product inventory losses and significant lost revenue.
17
For example, due to the COVID-19 pandemic and the resulting disruption of workplaces and the economy, the ability of certain vendors to supply required products has been impaired as a result of the illness or absenteeism of their workforces, government mandated shutdown orders, impaired financial conditions, or for other reasons. The supply of these products may not return to pre-COVID-19 levels, or products may return to pre-COVID levels at different times, and our efforts to ensure in-stock positions for all of the products that our consumers require may not be successful.
The cost of raw materials could increase our cost of goods sold and cause our results of operations and financial condition to suffer.
Our principal chemical raw materials are granular chlorine compounds, which are commodity materials. The prices of granular chlorine compounds are a function of, among other things, manufacturing capacity and demand. We have generally passed through chlorine price increases to our consumers. The price of granular chlorine compounds may increase in the future and we may not be able to pass on any such increase to our consumers. We purchase granular chlorine compounds primarily from the nation’s largest suppliers. The alternate sources of supply we currently view as reliable may ultimately be unable to supply us with all of our raw materials and finished goods, including chlorine products. Additionally, significant price fluctuations or shortages in raw materials needed for our products may increase our cost of goods sold and cause our results of operations and financial condition to suffer.
Risks Related to Commercialization of Our Products
Even if we are able to attain significant market acceptance of our planned or future products or services, the commercial success of our planned or future products is not guaranteed.
Our future financial success will depend substantially on our ability to effectively and profitably market and sell our planned and future products and services on a sustained basis, which ability is dependent on a number of additional and/or unpredictable factors. Successful growth of our sales and marketing efforts will depend on the strength of our marketing infrastructure and the effectiveness of our sales and marketing strategies. Our ability to satisfy product demand driven by our sales and marketing efforts will be largely dependent on the ability to maintain a commercially viable manufacturing process that is compliant with regulatory standards. If we fail to market and sell our planned or future products or services successfully, we will not be able to achieve profitability, which could have a material adverse effect on our business, financial condition, and results of operations.
We may implement a product recall or voluntary market withdrawal, which could significantly increase our costs, damage our reputation, and disrupt our business.
The manufacturing, packaging, marketing, and processing of our products involves an inherent risk that our processes do not meet applicable quality standards and requirements. In that event, we may voluntarily implement a recall or market withdrawal or may be required to do so by a regulatory authority. A recall or market withdrawal of one of our products would be costly and would divert management resources. A recall or withdrawal of one of our products, or a similar product processed by another entity, also could impair sales of our products because of confusion concerning the scope of the recall or withdrawal, or because of the damage to our reputation for quality and safety.
If we do not manage product inventory in an effective and efficient manner, it could adversely affect profitability.
Many factors affect the efficient use and planning of product inventory, such as effectiveness of predicting demand, preparing manufacturing to meet demand, meeting product mix and product demand requirements, and managing product expiration. We may be unable to manage our inventory efficiently, keep inventory within expected budget goals, keep our work-in-process inventory on hand or manage it efficiently, control expired product, or keep sufficient product on hand to meet demand. We may not be able to keep inventory costs within our target levels. Failure to do so may harm our long-term growth prospects.
If we do not continue to obtain favorable purchase terms with manufacturers, it could adversely affect our operating results.
Most raw materials and those products not repackaged by us are purchased directly from manufacturers. It is common in the swimming pool supply industry for certain manufacturers to offer extended payment terms on certain products to quantity purchasers such as us. These payment terms typically include favorable pricing and are available to us for pre-season or early season purchases. If we do not continue to maintain such favorable purchase terms with manufacturers, it could adversely affect our operating results.
18
Risks Related to Government Regulation
The nature of our business subjects us to compliance with employment, environmental, health, transportation, safety, and other governmental regulations.
We are subject to federal, state, and local laws and regulations relating to matters such as product labeling, weights and measures, zoning, land use, environmental protection, local fire codes, and workplace safety, including regulation by the Environmental Protection Agency, the Consumer Product Safety Commission, the Department of Transportation, the Occupational Safety and Health Administration, and the National Fire Protection Agency and corresponding state and local authorities. Most of these requirements govern the packaging, labeling, handling, transportation, storage, disposal, and sale of chemicals. We store certain types of chemicals at each of our locations and the storage of these items is strictly regulated by local fire codes. In addition, we sell algaecides and related products that are regulated under the Federal Insecticide, Fungicide and Rodenticide Act, and various state pesticide laws. These laws primarily relate to labeling, annual registration, and licensing. Compliance with applicable data privacy and security laws and regulations (including applicable industry standards) may also increase our costs of doing business.
Management has processes in place to facilitate and support our compliance with these requirements. However, failure to comply with these laws and regulations may result in investigations, the assessment of administrative, civil and criminal fines, damages, seizures, disgorgements, penalties, or the imposition of injunctive relief. Moreover, compliance with such laws and regulations in the future could prove to be costly. Although we presently do not expect to incur any capital or other expenditures relating to regulatory matters in amounts that may be material to us, we may be required to make such expenditures in the future. These laws and regulations have changed substantially and rapidly in recent years, and we anticipate that there will be continuing changes.
The clear trend in environmental, health, transportation, and safety regulations is to place more restrictions and limitations on activities that impact the environment, such as the use and handling of chemicals. Increasingly, strict restrictions and limitations have resulted in higher operating costs for us and it is possible that the costs of compliance with such laws and regulations will continue to increase. Our attempts to anticipate future regulatory requirements that might be imposed and our plans to remain in compliance with changing regulations and to minimize the costs of such compliance may not be as effective as we anticipate.
We depend on a network of suppliers to source our products, including our own branded products. Product quality, warranty claims or safety concerns could negatively impact our sales and expose us to litigation.
We rely on manufacturers and other suppliers to provide us with the products we sell. As we increase the number of branded products we sell, our exposure to potential liability claims may increase. Product and service quality issues could negatively impact consumer confidence in our brands and our business. If our product and service offerings do not meet applicable safety standards or our consumers’ expectations regarding safety or quality, we could experience lost sales and increased costs and be exposed to legal, financial, and reputational risks, as well as governmental enforcement actions. Actual, potential or perceived product safety concerns, including health-related concerns, could expose us to litigation, as well as government enforcement actions, and result in costly product recalls and other liabilities.
In addition, if our products are defectively designed, manufactured or labeled, contain defective components or are misused, we may become subject to costly litigation initiated by consumers. Product liability claims could harm our reputation, divert management’s attention from our core business, be expensive to defend, and may result in sizable damage awards against us. Although we maintain product liability insurance, we may not have sufficient insurance coverage for future product liability claims. We may not be able to obtain insurance in amounts or scope sufficient to provide us with adequate coverage against all potential liabilities. Any product liability claims brought against us, with or without merit, could increase our product liability insurance rates or prevent us from securing continuing coverage, harm our reputation, significantly increase our expenses, and reduce product sales. Product liability claims could cause us to incur significant legal fees and deductibles and claims in excess of our insurance coverage would be paid out of cash reserves, harming our financial condition and operating results. In addition, successful product liability claims made against one of our competitors could cause claims to be made against us or expose us to a perception that we are vulnerable to similar claims. Claims against us, regardless of their merit or potential outcome, may also hurt our ability to obtain acceptance of our products or to expand our business.
Risks Related to Intellectual Property Matters
If we are unable to adequately protect our intellectual property rights, our competitive position could be harmed, we may not be able to build name recognition in our markets of interest, or we could be required to incur significant expenses to enforce or defend our rights.
In the course of our business, we employ various trademarks, trade names, and service marks as well as our logo in packaging and advertising of our products. Our commercial success depends in part on our success in obtaining and maintaining issued trademarks,
19
trade names, and service marks in the United States and protecting our proprietary technology. If we do not adequately protect our intellectual property and proprietary technology, competitors may be able to use our technologies or the goodwill we have acquired in the marketplace and erode or negate any competitive advantage we may have, which could harm our business and ability to achieve profitability.
Our ability to enforce our intellectual property rights depends on our ability to detect infringement. It may be difficult to detect infringers who do not advertise the components that are used in their products. Moreover, it may be difficult or impossible to obtain evidence of infringement in a competitor’s or potential competitor’s product. We may not prevail in any lawsuits that we initiate and the damages or other remedies awarded if we were to prevail may not be commercially meaningful.
If our trademarks and trade names are not adequately protected, we may not be able to build name recognition in our target markets and our business may be adversely affected. At times, competitors may adopt trade names or trademarks similar to ours, thereby impeding our ability to build brand identity, possibly leading to market confusion and potentially requiring us to pursue legal action. In addition, there could be potential trade name or trademark infringement claims brought by owners of other registered trademarks or trademarks that incorporate variations of our unregistered trademarks or trade names. If we are unable to successfully register our trademarks and trade names and establish name recognition based on our trademarks and trade names, then we may not be able to compete effectively and our business may be adversely affected. Our efforts to enforce or protect our proprietary rights related to trademarks, domain names, copyrights, or other intellectual property may be ineffective and could result in substantial costs and diversion of resources and could adversely impact our financial condition or results of operations.
Our success depends in part on our ability to operate without infringing on or misappropriating the proprietary rights of others, and if we are unable to do so we may be liable for damages.
We cannot be certain that United States or foreign patents or patent applications of other companies do not exist or will not be issued that would prevent us from commercializing our products. Third parties may sue us for infringing or misappropriating their patent or other intellectual property rights. Intellectual property litigation is costly. If we do not prevail in litigation, in addition to any damages we might have to pay, we could be required to cease the infringing activity or obtain a license requiring us to make royalty payments. It is possible that a required license may not be available to us on commercially acceptable terms, if at all. In addition, a required license may be non-exclusive, and therefore our competitors may have access to the same technology licensed to us. If we fail to obtain a required license or are unable to design around another company’s patent, we may be unable to make use of some of the affected products, which would reduce our revenues.
The defense costs and settlements for patent infringement lawsuits are not covered by insurance. Patent infringement lawsuits can take years to settle. If we are not successful in our defense of or are not successful in obtaining dismissals of any such lawsuit, legal fees or settlement costs could have a material adverse effect on our results of operations and financial position.
Risks Related to Our Indebtedness
Our substantial indebtedness could materially adversely affect our financial condition and our ability to operate our business, react to changes in the economy or industry or pay our debts and meet our obligations under our debt agreements, and could divert our cash flow from operations to debt payments.
We have a substantial amount of indebtedness. As of December 6, 2021, our total borrowings under our amended and restated term loan credit agreement (the “Term Loan”) and our credit facility, amended from time to time, among Leslie’s Poolmart, Inc., the subsidiary borrowers from time to time party hereto, Leslie’s, Inc., each lender from time to time party hereto, Bank of America, N.A., as Administrative Agent, and U.S. Bank National Association, as Co-Collateral Agent (the “ABL Credit Facility”), and together, the “Credit Facilities” was $806.0 million. Subject to restrictions in the agreements governing our debt, we may incur additional debt.
Our substantial debt could have important consequences to our stockholders, including the following:
20
Furthermore, all of our debt under our Credit Facilities bears interest at variable rates. If these rates were to increase significantly, our ability to borrow additional funds may be reduced and the risks related to our substantial debt would intensify.
Servicing our debt requires a significant amount of cash. Our ability to generate sufficient cash depends on numerous factors beyond our control, and we may be unable to generate sufficient cash flow to service our debt obligations.
Our business may not generate sufficient cash flow from operating activities to service our debt obligations. Our ability to make payments on and to refinance our debt and to fund planned capital expenditures depends on our ability to generate cash in the future. To some extent, this is subject to general economic, financial, competitive, legislative, regulatory, and other factors that are beyond our control.
If we are unable to generate sufficient cash flow from operations to service our debt and meet our other commitments, we may need to refinance all or a portion of our debt, sell material assets or operations, delay capital expenditures, or raise additional debt or equity capital. We may not be able to effect any of these actions on a timely basis, on commercially reasonable terms or at all, and these actions may not be sufficient to meet our capital requirements. In addition, the terms of our existing or future debt agreements may restrict us from pursuing any of these alternatives.
Restrictive covenants in the agreements governing our Credit Facilities may restrict our ability to pursue our business strategies, and failure to comply with any of these restrictions could result in acceleration of our debt.
The operating and financial restrictions and covenants in the agreements governing our Credit Facilities may materially adversely affect our ability to finance future operations or capital needs or to engage in other business activities. Such agreements limit our ability, among other things, to:
A breach of any of these covenants could result in an event of default under our Credit Facilities. Upon the occurrence of an event of default under any of our Credit Facilities, the lenders could elect to declare all amounts outstanding under our Credit Facilities to be immediately due and payable and terminate all commitments to extend further credit. If we were unable to repay those amounts, the lenders under our Credit Facilities could proceed against the collateral granted to them to secure the debt under the Credit Facilities. We have pledged substantially all of our assets as collateral to secure our Credit Facilities. Our future operating results may not be sufficient to enable compliance with our Credit Facilities, and we may not have sufficient assets to repay amounts outstanding under our Credit Facilities. In addition, in the event of an acceleration of our debt upon an event of default, we may not have or be able to obtain sufficient funds to make any accelerated payments.
21
Furthermore, the terms of any future debt we may incur could have further additional restrictive covenants. We may not be able to maintain compliance with these covenants in the future, and in the event that we are not able to maintain compliance, we cannot assure you that we will be able to obtain waivers from the lenders or amend the covenants.
Despite current debt levels, we and our subsidiaries may still be able to incur substantially more debt. This could further exacerbate the risks associated with our substantial leverage.
We and our subsidiaries may be able to incur substantial additional debt in the future. Although the agreements governing our Credit Facilities contain restrictions on the incurrence of additional debt, these restrictions are subject to a number of qualifications and exceptions, and the debt incurred in compliance with these restrictions could be substantial. Additionally, we may successfully obtain waivers of these restrictions. If we incur additional debt above the levels currently in effect, the risks associated with our leverage, including those described above, would increase.
The phase-out of the London Interbank Offered Rate (LIBOR), or the replacement of LIBOR with a different reference rate, may adversely affect interest rates.
On July 27, 2017, the United Kingdom’s Financial Conduct Authority, which regulates LIBOR, announced that it intends to phase out LIBOR by the end of 2021. It is unclear if LIBOR will cease to exist at that time or if new methods of calculating LIBOR will be established such that it continues to exist after 2021. On November 30, 2020, ICE Benchmark Administration (“IBA”), the administrator of LIBOR, with the support of the United States Federal Reserve and the United Kingdom’s Financial Conduct Authority, announced plans to consult on ceasing publication of USD LIBOR on December 31, 2021 for only the one week and two month USD LIBOR tenors, and on June 30, 2023 for all other USD Libor tenors. While this announcement extends the transition period to June 2023, the United States Federal Reserve concurrently issued a statement advising banks to stop new USD LIBOR issuances by the end of 2021. In light of these recent announcements, the future of LIBOR at this time is uncertain and any changes in the methods by which LIBOR is determined or regulatory activity related to LIBOR’s phase-out could cause LIBOR to perform differently than in the past or cease to exist. Although regulators and IBA have made clear that the recent announcements should not be read to say that LIBOR has ceased or will cease, in the event LIBOR does cease to exist, we may need to renegotiate our credit agreements and related agreements, which may result in interest rates and/or payments that do not correlate over time with the interest rates and/or payments that would have been made on our obligations if LIBOR was available in its current form. Changes in the method of calculating LIBOR, or the replacement of LIBOR with an alternative rate or benchmark, may adversely affect interest rates and result in higher borrowing costs. This could materially and adversely affect our results of operations, cash flow and liquidity.
Risks Related to Ownership of Our Common Stock
Our stock price may be volatile or may decline regardless of our operating performance, resulting in substantial losses for investors.
The market price of our common stock may fluctuate significantly in response to numerous factors, many of which are beyond our control, including:
22
An Active trading market for our common stock may not be sustained.
Although our common stock is traded on the Nasdaq under the symbol “LESL”, there is a limited trading history on an active trading market for our common stock, which may not be sustained. Accordingly, no assurance can be given as to the following:
If an active market for our common stock with meaningful trading volume is not maintained, the market price of our common stock may decline materially. Consequently, you may not be able to sell our common stock at prices equal to or greater than the price you paid.
Future sales of common stock by existing stockholders could cause our stock price to decline.
If our existing stockholders sell, or indicate an intention to sell, substantial amounts of our common stock in the public market the trading price of our common stock could be adversely impacted. As of December 6, 2021, we had 189,978,541 shares of common stock outstanding. All such shares are eligible for resale in the public market, subject to applicable securities laws, including the Exchange Act. The trading price of our common stock could be adversely impacted if any of these certain significant stockholders sell, or indicate an intention to sell, substantial amounts of our common stock in the public market.
Stockholders’ ability to influence corporate matters may be limited because a small number of stockholders beneficially own a substantial amount of our common stock and continue to have substantial control over us.
As of December 6, 2021, our officers, directors, and principal stockholders (greater than 5% stockholders) collectively beneficially own approximately 29.8% of our issued and outstanding common stock. As a result, these stockholders will be able to exert influence over all matters requiring stockholder approval, including the election of directors and approval of significant corporate transactions, such as a merger or other sale of our Company or its assets, and may have interests that are different from our other stockholders’ and may vote in a way with which other stockholders disagree and which may be adverse to the interests of our other stockholders. In addition, this concentration of ownership may have the effect of preventing, discouraging, or deferring a change of control, which could depress the market price of our common stock.
Transactions engaged in by our principal stockholders, our officers or directors involving our common stock may have an adverse effect on the price of our stock.
As described above, our officers, directors, and principal stockholders (greater than 5% stockholders) collectively control approximately 29.8% of our issued and outstanding common stock as of December 6, 2021. Subsequent sales of our shares by these stockholders could have the effect of lowering our stock price. The perceived risk associated with the possible sale of a large number of shares by these stockholders, or the adoption of significant short positions by hedge funds or other significant investors, could cause some of our stockholders to sell their stock, thus causing the price of our stock to decline. In addition, actual or anticipated downward pressure on our stock price due to actual or anticipated sales of stock by our directors or officers could cause other institutions or individuals to engage in short sales of our common stock, which may further cause the price of our stock to decline.
From time to time, our directors and executive officers may sell shares of our common stock on the open market. These sales will be publicly disclosed in filings made with the SEC. In the future, our directors and executive officers may sell a significant number of shares for a variety of reasons unrelated to the performance of our business. Our stockholders may perceive these sales as a reflection
23
on management’s view of the business and result in some stockholders selling their shares of our common stock. These sales could cause the price of our stock to drop.
Certain of our stockholders have the right to engage or invest in the same or similar businesses as us.
L Catterton engages in other investments and business activities in addition to its ownership of us. Under our fifth amended and restated certificate of incorporation, L Catterton has the right, and has no duty to abstain from exercising such right, to engage or invest in the same or similar businesses as us, do business with any of our customers or vendors, or employ or otherwise engage any of our officers, directors or employees. If L Catterton, or any of their respective officers, directors or employees acquire knowledge of a potential transaction that could be a corporate opportunity, they have no duty, to the fullest extent permitted by law, to offer such corporate opportunity to us, our stockholders or our affiliates.
In the event that any of our directors and officers who is also a director, officer or employee of L Catterton acquires knowledge of a corporate opportunity or is offered a corporate opportunity, provided that this knowledge was not acquired solely in such person’s capacity as our director or officer and such person acts in good faith to the fullest extent permitted by law, then even if L Catterton pursue or acquire the corporate opportunity or if L Catterton does not present the corporate opportunity to us, such person is deemed to have fully satisfied such person’s fiduciary duties owed to us and is not liable to us.
We do not intend to pay dividends for the foreseeable future.
We currently intend to retain any future earnings to finance the operation and expansion of our business and we do not expect to declare or pay any dividends in the foreseeable future. As a result, stockholders must rely on sales of their common stock after price appreciation as the only way to realize any future gains on their investment.
Anti-takeover provisions in our charter documents and under Delaware law could make an acquisition of us more difficult, limit attempts by our stockholders to replace or remove our current management, and limit the market price of our common stock.
Provisions in our certificate of incorporation and bylaws may have the effect of delaying or preventing a change of control or changes in our management. Our amended and restated certificate of incorporation and amended and restated bylaws include provisions that:
24
These provisions may frustrate or prevent any attempts by our stockholders to replace or remove our current management by making it more difficult for stockholders to replace members of our board of directors, which is responsible for appointing the members of our management. As a result, these provisions may adversely affect the market price and market for our common stock if they are viewed as limiting the liquidity of our stock or as discouraging takeover attempts in the future.
The provision of our fifth amended and restated certificate of incorporation, requiring exclusive forum in certain courts in the State of Delaware or the federal district court for the District of Delaware for certain types of lawsuits, may have the effect of discouraging lawsuits against our directors and officers.
Our fifth amended and restated certificate of incorporation requires, to the fullest extent permitted by law, that (i) any derivative action or proceeding brought on our behalf, (ii) any action asserting a claim of breach of a fiduciary duty owed by any of our directors, officers, or other employees or stockholders to us or our stockholders, creditors or other constituents, or a claim of aiding and abetting any such breach of fiduciary duty, (iii) any action asserting a claim against us or our directors or officers arising pursuant to any provision of the Delaware General Corporation Law (“DGCL”) or our fifth amended and restated certificate of incorporation or our amended and restated bylaws or as to which the DGCL confers jurisdiction on the Court of Chancery of the State of Delaware, (iv) any action to interpret, apply, enforce or determine the validity of our fifth amended and restated certificate of incorporation or amended and restated bylaws, (v) any action asserting a claim against us or our directors or officers governed by the internal affairs doctrine or (vi) any action asserting an “internal corporate claim” as that term is defined in Section 115 of the DGCL will have to be brought only in the Court of Chancery of the State of Delaware (or if the Court of Chancery of the State of Delaware lacks subject matter jurisdiction, any other state court of the State of Delaware, or if no state court of the State of Delaware has subject matter jurisdiction, the federal district court for the District of Delaware), unless we consent in writing to the selection of an alternative forum. The foregoing provision will not apply to claims arising under the Exchange Act or the Securities Exchange Act of 1934, as amended (the “Exchange Act”). Unless we consent in writing to the selection of an alternative forum, the federal district court for the District of Delaware shall be, to the fullest extent permitted by law, the exclusive forum for the resolution of any complaint asserting a cause of action arising under the Exchange Act against us or any of our directors or officers. Although we believe these exclusive forum provisions benefit us by providing increased consistency in the application of Delaware law and federal securities laws in the types of lawsuits to which each applies, the exclusive forum provisions may limit a stockholder’s ability to bring a claim in a judicial forum that it finds favorable for disputes with us or any of our directors, officers, or stockholders, which may discourage lawsuits with respect to such claims. Our stockholders will not be deemed to have waived our compliance with the federal securities laws and the rules and regulations thereunder as a result of our exclusive forum provisions. Further, in the event a court finds either exclusive forum provision contained in our fifth amended and restated certificate of incorporation to be unenforceable or inapplicable in an action, we may incur additional costs associated with resolving such action in other jurisdictions, which could harm our business, operating results, and financial condition.
We will continue to incur increased costs as a result of being a public company, and our management will continue to be required to devote substantial time to compliance with our public company responsibilities and corporate governance practices.
As a company with publicly-traded securities, we incur greater costs associated with corporate governance requirements that are applicable to us as a public company, including rules and regulations of the SEC, under the Sarbanes-Oxley Act of 2002 (“Sarbanes-Oxley Act”), the Dodd-Frank Wall Street Reform and Consumer Protection Act of 2010, the Exchange Act, as well as the Nasdaq listing requirements. These rules and regulations significantly increase our accounting, legal, and financial compliance costs and make some activities more time-consuming. These rules and regulations make it more expensive for us to maintain directors’ and officers’ liability insurance. As a result, it may be more difficult for us to attract and retain qualified persons to serve on our board of directors or as executive officers. Furthermore, these rules and regulations will continue to increase our legal and financial compliance costs and will make some activities more time-consuming and costly. We cannot predict or estimate the amount of additional costs we will continue to incur as a public company or the timing of such costs. Accordingly, increases in costs incurred as a result of being a publicly traded company may adversely affect our business, financial condition, and results of operations.
If we are unable to effectively implement or maintain a system of internal control over financial reporting, we may not be able to accurately or timely report our financial results and our stock price could be adversely affected.
As a result of being a public company, we are required by Section 404 of the Sarbanes-Oxley Act to evaluate the effectiveness of our internal control over financial reporting as of the end of each fiscal year and include a management report assessing the effectiveness of our internal control over financial reporting, beginning with this Annual Report on Form 10-K for the year ending October 2, 2021. In the following year, we must include a report issued by our independent registered public accounting firm based on their audit of our
25
internal controls over financial reporting. In each case, we may identify weaknesses or deficiencies that we may be unable to remedy before the requisite deadline for those reports or we may be unable to complete our assessment in a timely manner.
Any failure to maintain internal control over financial reporting could severely inhibit our ability to accurately report our financial condition or results of operations. The effectiveness of our controls and procedures may be limited by a variety of factors, including:
Our ability to comply with the annual internal control report requirements will depend on the effectiveness of our financial reporting and data systems and controls across our Company. We expect these systems and controls to involve significant expenditures and to become increasingly complex as our business grows. To effectively manage this complexity, we will need to continue to improve our operational, financial, and management controls, and our reporting systems and procedures. Any weaknesses or deficiencies or any failure to implement required new or improved controls, or difficulties encountered in the implementation or operation of these controls, could harm our operating results and cause us to fail to meet our financial reporting obligations or result in material misstatements in our financial statements, which could limit our ability to access the capital markets, adversely affect our business and investor confidence in us, and reduce our stock price.
26
Item 1B. Unresolved Staff Comments.
None.
Item 2. Properties.
Properties
As of October 2, 2021, we had 952 locations, two manufacturing facilities, eight Company-operated distribution centers, and five third-party distribution centers in 38 states. Most of our locations operate on five-year leases which offer significant flexibility as they can be located in a variety of venues, including strip centers, lifestyle centers, and shopping centers. Our current physical network is summarized in the chart below:
State |
|
Number of |
|
|
Alabama |
|
|
9 |
|
Arizona |
|
|
91 |
|
Arkansas |
|
|
3 |
|
California |
|
|
170 |
|
Colorado |
|
|
4 |
|
Connecticut |
|
|
16 |
|
Delaware |
|
|
3 |
|
Florida |
|
|
88 |
|
Georgia |
|
|
35 |
|
Illinois |
|
|
10 |
|
Indiana |
|
|
12 |
|
Iowa |
|
|
1 |
|
Kansas |
|
|
6 |
|
Kentucky |
|
|
6 |
|
Louisiana |
|
|
14 |
|
Maryland |
|
|
11 |
|
Massachusetts |
|
|
11 |
|
Michigan |
|
|
5 |
|
Mississippi |
|
|
4 |
|
Missouri |
|
|
13 |
|
Nebraska |
|
|
2 |
|
Nevada |
|
|
25 |
|
New Hampshire |
|
|
3 |
|
New Jersey |
|
|
33 |
|
New Mexico |
|
|
3 |
|
New York |
|
|
32 |
|
North Carolina |
|
|
13 |
|
Ohio |
|
|
16 |
|
Oklahoma |
|
|
21 |
|
Oregon |
|
|
7 |
|
Pennsylvania |
|
|
34 |
|
Rhode Island |
|
|
1 |
|
South Carolina |
|
|
9 |
|
Tennessee |
|
|
13 |
|
Texas |
|
|
198 |
|
Utah |
|
|
3 |
|
Virginia |
|
|
16 |
|
Washington |
|
|
11 |
|
Total Locations |
|
|
952 |
|
Our corporate offices are located in Phoenix, Arizona. The 92,669 square foot office building has a current lease term through February 28, 2027, with our ability to exercise two five-year renewal options.
27
Item 3. Legal Proceedings.
We are subject to litigations, claims and other proceedings that arise from time to time in the ordinary course of business. We believe these actions are routine and incidental to the business. As of October 2, 2021, we had established reserves for claims that are probable and estimable and such reserves were not significant. While we cannot feasibly predict the outcome of these matters with certainty, we believe, based on examination of these matters, experience to date and discussions with counsel, that the ultimate liability, individually or in the aggregate, will not have a material adverse effect on our business, financial position, results of operations or cash flows.
Item 4. Mine Safety Disclosures.
Not applicable.
28
PART II
Item 5. Market for Registrant’s Common Equity, Related Stockholder Matters and Issuer Purchases of Equity Securities.
Our common stock is listed on The Nasdaq Global Select Market under the “LESL” symbol and began “regular way” trading on The Nasdaq Global Select Market on October 29, 2020. Prior to that date, there was no public trading market for our common stock.
As of December 6, 2021, there were 10 stockholders of record, although there is a much larger number of beneficial holders. The actual number of stockholders is greater than the number of record holders stated above, and includes stockholders who are beneficial owners, but whose shares are held in “street name” by brokers and other nominees.
Stock Performance Chart
This performance graph shall not be deemed “filed” with the SEC for purposes of Section 18 of the Exchange Act or incorporated by reference into any filing of Leslie’s, Inc. under the Securities Act or the Exchange Act.
The graph below presents our cumulative total shareholder returns on our common stock relative to the performance of the Nasdaq Global Composite Index and the S&P MidCap 400 Index. The graph assumes $100 was invested at the market close on October 29, 2020, which was the first day our common stock began trading and its relative performance is tracked through November 30, 2021. Data for the Nasdaq Global Composite Index, S&P 500 Index, and S&P MidCap 400 Index assume reinvestment of dividends. The graph uses the closing market price on October 29, 2020 of $21.70 per share as the initial value of our common stock. The comparisons in the graph below are based upon historical data and are not indicative of, nor intended to forecast, future performance of our common stock.
Dividends
We have never declared nor paid any cash dividends on our common stock. We currently do not expect to pay any dividends on our common stock in the foreseeable future. Any future determination relating to our dividend policy will be made by our board of directors and will depend on a number of factors, including: our actual and projected financial condition, liquidity, and results of operations; our capital levels and needs; tax considerations; any acquisitions or potential acquisitions that we may examine; statutory and regulatory prohibitions and other limitations; the terms of any credit agreements or other borrowing arrangements that restrict the amount of cash dividends that we can pay; general economic conditions; and other factors deemed relevant by our board of directors. We are not obligated to pay dividends on our common stock.
29
Use of Proceeds
On November 2, 2020, we completed our IPO, pursuant to which we issued and sold an aggregate of 30,000,000 shares of common stock at the IPO price of $17.00 per share. The selling shareholders in our IPO sold 16,000,000 shares of common stock (inclusive of 6,000,000 shares pursuant to the underwriters’ overallotment option) at the IPO price of $17.00 per share. The aggregate gross proceeds from our IPO to the Company were $510.0 million, and the net proceeds were $458.7 million after deducting underwriting discounts and commissions of $45.0 million and other IPO expenses of $6.3 million. Net proceeds to the selling stockholders were $272.0 million. The offer and sale of the shares of common stock in the IPO were registered pursuant to a registration statement on Form S-1 (File No. 333-249372), which the SEC declared effective on October 28, 2020. The managing underwriters for our IPO were Goldman Sachs & Co. LLC, Morgan Stanley & Co. LLC, and BofA Securities, Inc.
Recent Sales of Unregistered Securities
None.
Repurchase of Equity Securities
None.
Item 6. [Reserved].
30
Item 7. Management’s Discussion and Analysis of Financial Condition and Results of Operations.
The following discussion and analysis of our financial condition and results of operations should be read together with our consolidated financial statements and related notes, which are included elsewhere in this Annual Report on Form 10-K. This discussion may contain forward-looking statements based upon current expectations that involve risks and uncertainties. Our actual results may differ materially from those anticipated in these forward-looking statements as a result of various factors, including those set forth under “Risk Factors” or in other sections of this Annual Report on Form 10-K.
We operate on a fiscal calendar that results in a fiscal year consisting of a 52- or 53-week period ending on the Saturday closest to September 30th. In a 52-week fiscal year, each quarter contains 13 weeks of operations; in a 53-week fiscal year, each of the first, second and third quarters includes 13 weeks of operations and the fourth quarter includes 14 weeks of operations. References to fiscal 2021, 2020 and 2019 refer to the fiscal years ended October 2, 2021, October 3, 2020 and September 28, 2019, respectively. Fiscal 2021 and 2019 included 52 weeks of operations. Fiscal 2020 included 53 weeks of operations.
Our Company
We are the largest and most trusted direct-to-consumer brand in the $11 billion United States pool and spa care industry, serving residential and professional consumers. Founded in 1963, we are the only direct-to-consumer pool and spa care brand with national scale, operating an integrated marketing and distribution ecosystem powered by a physical network of 952 branded locations and a robust digital platform. We offer an extensive assortment of professional-grade products, the majority of which are exclusive to Leslie’s, as well as certified installation and repair services, all of which are essential to the ongoing maintenance of pools and spas. Our dedicated team of associates, pool and spa care experts, and experienced service technicians are passionate about empowering our consumers with the knowledge, products, and solutions necessary to confidently maintain and enjoy their pools and spas. The considerable scale of our integrated marketing and distribution ecosystem, which is powered by our direct-to-consumer network, uniquely enables us to efficiently reach and service every pool and spa in the continental United States.
We operate primarily in the pool and spa aftermarket industry which is one of the most fundamentally attractive consumer categories given its scale, predictability, and growth outlook. We have a highly predictable, recurring revenue model, as evidenced by our 58 consecutive years of sales growth. Approximately 80% of our assortment is comprised of non-discretionary products essential to the care of residential and commercial pools and spas. Our assortment includes chemicals, equipment and parts, cleaning and maintenance equipment, and safety, recreational, and fitness-related products. We also offer important essential services, such as equipment installation and repair for residential consumers and professional pool operators. Consumers receive the benefit of extended vendor warranties on purchased products from our locations and on installations or repairs from our certified in-field technicians. We offer complimentary, commercial-grade in-store water testing and analysis via our proprietary AccuBlue® system, which increases consumer engagement, conversion, basket size, and loyalty, resulting in higher lifetime value. Our water treatment expertise is powered by data and intelligence accumulated from the millions of water tests we have performed over the years, positioning us as the most trusted water treatment service provider in the industry. Due to the non-discretionary nature of our products and services, our business has historically delivered strong, uninterrupted growth and profitability in all market environments, including through the Great Recession and the COVID-19 pandemic.
We have a legacy of leadership and disruptive innovation. Since our founding in 1963, we have been the leading innovator in our category and have provided our consumers with the most advanced pool and spa care available. As we have scaled, we have leveraged our competitive advantages to strategically reinvest in our business and intellectual property to develop new value-added capabilities. Over the course of our history, we have pioneered complimentary in-store water testing, offered complimentary in-store equipment repair services, introduced the industry’s first loyalty program, and developed an expansive platform of owned and exclusive brands. These differentiated capabilities allow us to meet the needs of any pool and spa owner, whether they care for their pool or spa themselves or rely on a professional, whenever, wherever, and however they choose to engage with us.
Key Factors and Measures We Use to Evaluate Our Business
We consider a variety of financial and operating measures in assessing the performance of our business. The key measures we use under United States generally accepted accounting principles (“GAAP”) are sales, gross profit and gross margin, selling, general and administrative expenses (“SG&A”), and operating income. The key non-GAAP measures and other operating measures we use are comparable sales, comparable sales growth, Adjusted EBITDA, Adjusted net income, and Adjusted earnings per share.
Sales
We offer a broad range of products that consists of regularly purchased, non-discretionary pool and spa maintenance items such as chemicals, equipment, cleaning accessories and parts, as well as installation and repair services for pool and spa equipment. Our offering of proprietary, owned and third-party brands across diverse product categories drives sales growth by attracting new consumers and encouraging repeat visits from our existing consumers. Revenue from merchandise sales at retail locations is recognized at the point of sale, revenue from services are recognized when the services are rendered and revenue from e-commerce merchandise sales is
31
generally recognized upon shipment of the merchandise. Revenue is recorded net of related discounts and sales tax. Payment from retail customers is generally at the point of sale and payment terms for professional pool operator customers are based on our credit requirements and generally have terms of less than 60 days. When we receive payment from a consumer before the consumer has taken possession of the merchandise or the service has been performed, the amount received is recorded as deferred revenue or as a customer deposit until the sale or service is complete. Sales are impacted by product mix and availability, as well as promotional and competitive activities and the spending habits of our consumers. Growth of our sales is primarily driven by comparable sales growth and expansion of our locations in existing and new markets.
Comparable Sales and Comparable Sales Growth
We measure comparable sales growth as the increase or decrease in sales recorded by the comparable base in any reporting period, compared to sales recorded by the comparable base in the prior reporting period. The comparable base includes sales through our locations and through our e-commerce websites and third-party marketplaces. Comparable sales is a key measure used by management and our board of directors to assess our financial performance.
We consider a new or acquired location comparable in the first full month after it has completed 52 weeks of sales. Closed locations become non-comparable during their last partial month of operation. Locations that are relocated are considered comparable at the time the relocation is complete. Comparable sales are not calculated in the same manner by all companies, and accordingly, are not necessarily comparable to similarly titled measures of other companies and may not be an appropriate measure for performance relative to other companies.
The number of new locations reflects the number of locations opened during a particular reporting period. New locations require an initial capital investment in location build-outs, fixtures, and equipment, which we amortize over time as well as cash required for inventory.
As of October 2, 2021, we operated 952 retail locations in 38 states across the United States. We owned 27 locations and leased the remainder of our locations. Our initial lease terms are typically five years with options to renew for multiple successive five-year periods. We evaluate new opportunities in new and existing markets based on the number of pools and spas in the market, competition, our existing locations, availability and cost of real estate, and distribution and operating costs of our locations. We review performance of our locations on a regular basis and evaluate opportunities to strategically close locations to improve our profitability. Our limited investment costs in individual locations and our ability to transfer sales to our extensive network of remaining locations and e-commerce websites allows us to improve profitability as a result of any strategic closures.
Gross Profit and Gross Margin
Gross profit is equal to our sales less our cost of merchandise and services sold. Cost of merchandise and services sold reflects the direct cost of purchased merchandise, costs to package certain chemical products, including direct materials and labor, costs to provide services, including labor and materials, as well as distribution and occupancy costs. The direct cost of purchased merchandise includes vendor rebates, which are generally treated as a reduction of merchandise costs. We recognize such vendor rebates at the time the obligations to purchase products or perform services have been completed, and the related inventory has been sold. Distribution costs include warehousing and transportation expenses, including costs associated with third-party fulfillment centers used to ship merchandise to our e-commerce consumers. Occupancy costs include the rent, common area maintenance, real estate taxes, and depreciation and amortization costs of all retail locations. These costs are significant and are expected to continue increase proportionate to our growth.
Gross margin is gross profit as a percentage of our sales. Gross margin is impacted by merchandise costs, pricing and promotions, product mix and availability, inflation, and service costs, which can vary. Our proprietary brands, custom-formulated products, and vertical integration provide us with cost savings, as well as greater control over product availability and quality as compared to other companies in the industry. Gross margin is also impacted by the costs of distribution and occupancy costs, which can vary.
Our gross profit is variable in nature and generally follows changes in sales. The components of our cost of merchandise and services sold may not be comparable to the components of cost of sales or similar measures of other companies. As a result, our gross profit and gross margin may not be comparable to similar data made available by other companies.
Selling, General and Administrative Expenses
Our SG&A includes selling and operating expenses at our retail locations and corporate-level general and administrative expenses. Selling and operating expenses at retail locations include payroll, bonus and benefit costs for personnel, supplies, and credit and debit card processing costs. Corporate expenses include payroll, bonus, and benefit costs for our corporate and field support functions, equity-based compensation, marketing and advertising, insurance, utilities, occupancy costs related to our corporate office facilities,
32
professional services, and depreciation and amortization for all assets, except those related to our retail locations and distribution operations, which are included in cost of merchandise and services sold. Selling and operating expenses generally vary proportionately with sales and the change in the number of locations. In contrast, general and administrative expenses are generally not directly proportional to sales and the change in the number of locations, but are expected to increase over time to support our growth and public company obligations. The components of our SG&A may not be comparable to the components of similar measures of other companies.
Operating Income
Operating income is gross profit less SG&A. Operating income excludes interest expense, loss on debt extinguishment, income tax expense, and other expenses, net. We use operating income as an indicator of the productivity of our business and our ability to manage expenses.
Adjusted EBITDA
Adjusted EBITDA is defined as earnings before interest (including amortization of debt issuance costs), taxes, depreciation and amortization, management fees, equity-based compensation expense, loss on debt extinguishment, costs related to equity offerings, executive transition costs, loss (gain) on disposition of assets, mark-to-market on interest rate cap and other non-recurring, non-cash or discrete items. Adjusted EBITDA is a key measure used by management and our board of directors to assess our financial performance. Adjusted EBITDA is also frequently used by analysts, investors and other interested parties to evaluate companies in our industry, when considered alongside other GAAP measures. We use Adjusted EBITDA to supplement GAAP measures of performance to evaluate the effectiveness of our business strategies, to make budgeting decisions and to compare our performance against that of other companies using similar measures.
Adjusted EBITDA is not a recognized measure of financial performance under GAAP but is used by some investors to determine a company’s ability to service or incur indebtedness. Adjusted EBITDA is not calculated in the same manner by all companies, and accordingly, is not necessarily comparable to similarly entitled measures of other companies and may not be an appropriate measure for performance relative to other companies. Adjusted EBITDA should not be construed as an indicator of a company’s operating performance in isolation from, or as a substitute for, net income (loss), cash flows from operations or cash flow data, all of which are prepared in accordance with GAAP. We have presented Adjusted EBITDA solely as supplemental disclosure because we believe it allows for a more complete analysis of results of operations. Adjusted EBITDA is not intended to represent, and should not be considered more meaningful than, or as an alternative to, measures of operating performance as determined in accordance with GAAP. In the future, we may incur expenses or charges such as those added back to calculate Adjusted EBITDA. Our presentation of Adjusted EBITDA should not be construed as an inference that our future results will be unaffected by these items.
Adjusted Net Income and Adjusted Earnings per Share
Adjusted net income and adjusted earnings per share are additional key measures used by management and our board of directors to assess our financial performance. Adjusted net income and adjusted earnings per share are also frequently used by analysts, investors, and other interested parties to evaluate companies in our industry, when considered alongside other GAAP measures.
Adjusted net income is defined as net income adjusted to exclude management fees, equity-based compensation expense, loss on debt extinguishment, costs related to equity offerings, executive transition costs, loss (gain) on disposition of assets, mark-to-market on interest rate cap, and other non-recurring, non-cash or discrete items. Adjusted diluted earnings per share is defined as adjusted net income divided by the diluted weighted average number of common shares outstanding.
Factors Affecting the Comparability of our Results of Operations
Our reported results have been affected by, among other events, the following events, which must be understood in order to assess the comparability of our period-to-period financial performance and condition.
Impact of COVID-19
We continue to closely monitor the ongoing impact of COVID-19 on all aspects of our business and in all of our locations. As of October 2, 2021, we operated 952 locations in 38 states and all locations are currently open. During the 13- and 52- weeks ended October 2, 2021, we maintained operations as an ‘essential’ business, as substantially defined by various federal, state, and local authorities, we provide essential products and services that maintain the safety and sanitization of homes and businesses. From time to time, certain of our locations may be temporarily closed or restricted to curbside service only. Closures and restrictions did not have a material impact on our performance during the 13- and 52- weeks ended October 2, 2021. We remain committed to supporting federal, state, and local mandates to prevent the spread of COVID-19 while we operate our business and to do our part in protecting public health.
33
We help keep our communities safe from serious public health risks by providing essential products and services. Water that is not properly maintained can serve as a breeding ground for potentially fatal bacteria and viruses.
As a business, the health and safety of our consumers, communities, and associates remain our highest priority, and we continue to take all precautions recommended by the Centers for Disease Control and Prevention to ensure their safety and well-being. We have proactively implemented extensive measures in response to COVID-19 throughout our business operations, including:
We have also closely coordinated with our vendor partners to minimize the impact of supply disruptions and maintain the flow of essential products to meet the elevated demand from consumers in the current environment. The full impact of COVID-19 on our financial and operating performance depends significantly on the duration and severity of the pandemic, the actions taken to contain or mitigate its impact, and any changes in consumer behaviors. It is not possible to predict the likelihood, timing, or severity of the aforementioned direct and indirect impacts of COVID-19 on our business. Restrictions on the operation of our locations and distribution facilities could have a material impact on our sales and earnings. COVID-19 could also lead to significant disruption to our supply chain for products we sell and could have a material impact on our sales and earnings.
Business Acquisitions
Our business acquisitions did not have a material impact on our financial position or results of operations. See Note 3 – Business Combinations to our consolidated financial statements included elsewhere in this Annual Report on Form 10-K for information regarding our business acquisitions.
Incremental Public Company Expenses
As a newly public company we will incur significant expenses on an ongoing basis that we did not incur as a private company. Those costs include additional director and officer liability insurance expenses, as well as third-party and internal resources related to accounting, auditing, Sarbanes-Oxley Act compliance, legal, and investor and public relations expenses. These costs will generally be included in SG&A in our consolidated statements of operations.
34
Results of Operations
We derived our consolidated statements of operations for fiscal 2021, 2020 and 2019 from our consolidated financial statements. Our historical results are not necessarily indicative of the results that may be expected in the future. The following table summarizes key components of our results of operations for the periods indicated, both in dollars and as a percentage of our sales (in thousands, except per share amounts).
|
|
Year Ended |
|
|||||||||
Statements of Operations data: |
|
October 2, 2021 |
|
|
October 3, 2020 |
|
|
September 28, 2019 |
|
|||
Sales |
|
$ |
1,342,917 |
|
|
$ |
1,112,229 |
|
|
$ |
928,203 |
|
Cost of merchandise and services sold |
|
|
747,757 |
|
|
|
651,516 |
|
|
|
548,463 |
|
Gross profit |
|
|
595,160 |
|
|
|
460,713 |
|
|
|
379,740 |
|
Selling, general and administrative expenses |
|
|
386,075 |
|
|
|
314,338 |
|
|
|
258,152 |
|
Operating income |
|
|
209,085 |
|
|
|
146,375 |
|
|
|
121,588 |
|
Other expense: |
|
|
|
|
|
|
|
|
|
|||
Interest expense |
|
|
34,410 |
|
|
|
84,098 |
|
|
|
98,578 |
|
Loss on debt extinguishment |
|
|
9,169 |
|
|
|
— |
|
|
|
— |
|
Other expenses, net |
|
|
2,377 |
|
|
|
1,089 |
|
|
|
7,453 |
|
Total other expense |
|
|
45,956 |
|
|
|
85,187 |
|
|
|
106,031 |
|
Income before taxes |
|
|
163,129 |
|
|
|
61,188 |
|
|
|
15,557 |
|
Income tax expense (benefit) |
|
|
36,495 |
|
|
|
2,627 |
|
|
|
14,855 |
|
Net income |
|
$ |
126,634 |
|
|
$ |
58,561 |
|
|
$ |
702 |
|
Net income per share |
|
|
|
|
|
|
|
|
|
|||
Basic |
|
$ |
0.68 |
|
|
$ |
0.37 |
|
|
$ |
0.00 |
|
Diluted |
|
$ |
0.67 |
|
|
$ |
0.37 |
|
|
$ |
0.00 |
|
Weighted average shares outstanding |
|
|
|
|
|
|
|
|
|
|||
Basic |
|
|
185,412 |
|
|
|
156,500 |
|
|
|
156,500 |
|
Diluted |
|
|
190,009 |
|
|
|
156,500 |
|
|
|
156,500 |
|
|
|
|
|
|
|
|
|
|
|
|||
Percentage of Sales(1) |
|
(%) |
|
|
(%) |
|
|
(%) |
|
|||
Sales |
|
|
100.0 |
|
|
|
100.0 |
|
|
|
100.0 |
|
Cost of merchandise and services sold |
|
|
55.7 |
|
|
|
58.6 |
|
|
|
59.1 |
|
Gross margin |
|
|
44.3 |
|
|
|
41.4 |
|
|
|
40.9 |
|
Selling, general and administrative expenses |
|
|
28.7 |
|
|
|
28.3 |
|
|
|
27.8 |
|
Operating income |
|
|
15.6 |
|
|
|
13.2 |
|
|
|
13.1 |
|
Other expense: |
|
|
|
|
|
|
|
|
|
|||
Interest expense |
|
|
2.6 |
|
|
|
7.6 |
|
|
|
10.6 |
|
Loss on debt extinguishment |
|
|
0.7 |
|
|
|
— |
|
|
|
— |
|
Other expenses, net |
|
|
0.2 |
|
|
|
0.1 |
|
|
|
0.8 |
|
Total other expense |
|
|
3.4 |
|
|
|
7.7 |
|
|
|
11.4 |
|
Income before taxes |
|
|
12.1 |
|
|
|
5.5 |
|
|
|
1.7 |
|
Income tax expense (benefit) |
|
|
2.7 |
|
|
|
0.2 |
|
|
|
1.6 |
|
Net income |
|
|
9.4 |
|
|
|
5.3 |
|
|
|
0.1 |
|
Other Financial and Operations data: |
|
|
|
|
|
|
|
|
|
|||
Number of new and acquired locations |
|
|
17 |
|
|
|
10 |
|
|
|
28 |
|
Number of locations open at end of period |
|
|
952 |
|
|
|
936 |
|
|
|
952 |
|
Comparable sales growth(2) |
|
|
21.5 |
% |
|
|
18.0 |
% |
|
|
0.4 |
% |
Adjusted EBITDA(3) |
|
$ |
270,613 |
|
|
$ |
182,770 |
|
|
$ |
160,003 |
|
Adjusted EBITDA as a percentage of sales(3) |
|
|
20.2 |
% |
|
|
16.4 |
% |
|
|
17.2 |
% |
Adjusted net income(3) |
|
$ |
161,478 |
|
|
$ |
64,973 |
|
|
$ |
12,765 |
|
Adjusted diluted earnings per share |
|
$ |
0.85 |
|
|
$ |
0.42 |
|
|
$ |
0.08 |
|
35
|
|
Year Ended |
|
|||||||||
|
|
October 2, 2021 |
|
|
October 3, 2020 |
|
|
September 28, 2019 |
|
|||
Net income |
|
$ |
126,634 |
|
|
$ |
58,561 |
|
|
$ |
702 |
|
Interest expense |
|
|
34,410 |
|
|
|
84,098 |
|
|
|
98,578 |
|
Income tax expense (benefit) |
|
|
36,495 |
|
|
|
2,627 |
|
|
|
14,855 |
|
Depreciation and amortization expense(1) |
|
|
26,553 |
|
|
|
28,925 |
|
|
|
30,424 |
|
Management fees(2) |
|
|
382 |
|
|
|
4,900 |
|
|
|
4,533 |
|
Equity-based compensation expense(3) |
|
|
25,621 |
|
|
|
1,785 |
|
|
|
2,130 |
|
Loss on debt extinguishment(4) |
|
|
9,169 |
|
|
|
— |
|
|
|
— |
|
Costs related to equity offerings(5) |
|
|
10,444 |
|
|
|
— |
|
|
|
— |
|
Executive transition costs and other(6) |
|
|
905 |
|
|
|
1,874 |
|
|
|
8,781 |
|
Adjusted EBITDA |
|
$ |
270,613 |
|
|
$ |
182,770 |
|
|
$ |
160,003 |
|
|
|
Year Ended |
|
|||||||||
|
|
October 2, 2021 |
|
|
October 3, 2020 |
|
|
September 28, 2019 |
|
|||
Net income |
|
$ |
126,634 |
|
|
$ |
58,561 |
|
|
$ |
702 |
|
Management fees(2) |
|
|
382 |
|
|
|
4,900 |
|
|
|
4,533 |
|
Equity-based compensation expense(3) |
|
|
25,621 |
|
|
|
1,785 |
|
|
|
2,130 |
|
Loss on debt extinguishment(4) |
|
|
9,169 |
|
|
|
— |
|
|
|
— |
|
Costs related to equity offerings(5) |
|
|
10,444 |
|
|
|
— |
|
|
|
— |
|
Executive transition costs and other(6) |
|
|
905 |
|
|
|
1,874 |
|
|
|
8,781 |
|
Tax effects of these adjustments(7) |
|
|
(11,677 |
) |
|
|
(2,147 |
) |
|
|
(3,381 |
) |
Adjusted net income |
|
$ |
161,478 |
|
|
$ |
64,973 |
|
|
$ |
12,765 |
|
36
Comparison of Fiscal 2021 and 2020
Impact of 53rd week
Fiscal 2020 included a 53rd week, which added approximately $18.0 million in sales, $1.5 million in net income, and $3.0 million in Adjusted EBITDA.
Sales
Sales increased to $1,342.9 million in fiscal 2021 from $1,112.2 million in fiscal 2020, an increase of $230.7 million or 20.7%. The increase was primarily the result of an increase in comparable sales on a reported basis of 21.5% or $235.2 million, driven by an increase in consumer demand and elevated retail price inflation in the core sanitizer and equipment product categories.
We believe that COVID-19 has accelerated secular trends in consumer behavior and has favorably impacted our sales. While the duration and effects of the COVID-19 pandemic are uncertain, we anticipate that the changes in consumer behavior will continue for the foreseeable future.
Gross Profit and Gross Margin
Gross profit increased to $595.2 million in fiscal 2021 from $460.7 million in fiscal 2020, an increase of $134.5 million or 29.2%. Gross profit increased to 44.3% compared to 41.4% in fiscal 2020, an increase of 290 basis points. The increase in gross profit was primarily due to product margin improvements and occupancy leverage, partially offset by business mix.
Selling, General and Administrative Expenses
SG&A increased to $386.1 million in fiscal 2021 from $314.3 million in fiscal 2020, an increase of $71.8 million or 22.8%. As a percentage of sales, SG&A increased to 28.7% in fiscal 2021 compared to 28.3% in fiscal 2020, an increase of 40 basis points. The increase in SG&A in fiscal 2021, was primarily due to $55.2 million attributable to the increase in overall sales and our continued investments to support Company growth, $23.8 million related to non-cash equity-based compensation charges for the conversion of performance-based equity units and other equity awards granted at the time of IPO, and $8.2 million of one-time contractual amounts incurred in connection with the IPO, partially offset by lower costs of $6.4 million associated with COVID-19, a reduction in sponsor management fees of $4.5 million due to the termination of our sponsor management agreement at the time of our IPO, lower physical location closure costs of $3.6 million related to the strategic consolidation of certain locations during the first quarter of fiscal 2020 and lower executive transition and other costs of $0.9 million.
Total Other Expense
Total other expenses decreased to $46.0 million in fiscal 2021 from $85.2 million in fiscal 2020, a decrease of $39.2 million. This decrease was primarily due to lower interest expense of $49.7 million, due to a reduction in interest rates and the repayment of our senior unsecured notes with the proceeds of our IPO in November 2020, partially offset by a $9.2 million non-cash loss on debt extinguishment related to the repayment of our senior unsecured notes and amendment to the Term Loan during fiscal 2021.
Income Taxes
Income tax expense increased to $36.5 million in fiscal 2021 from $2.6 million in fiscal 2020, an increase of $33.9 million. This increase was primarily attributable to higher income before taxes.
Our effective tax rate was 22.4% in fiscal 2021 and reflects the reversal of a valuation allowance for our interest limitation carryforward as a result of our IPO and subsequent paydown of debt, as well as income tax benefits attributable to equity-based compensation awards. Our effective tax rate was 4.3% in fiscal 2020, reflecting a decrease in the valuation allowance for our interest limitation carryforward due to favorable provisions of the Coronavirus Aid, Relief, and Economic Security Act (“CARES Act”), which increased the interest limitation from 30% to 50% of adjusted taxable income and allowed for the utilization of interest deduction carryforwards during fiscal 2020.
37
Net Income and Earnings per Share
Net income increased to $126.6 million in fiscal 2021 from $58.6 million in fiscal 2020, an increase of $68.0 million. Diluted earnings per share increased to $0.67 in fiscal 2021 from $0.37 in fiscal 2020.
Adjusted net income increased to $161.5 million in fiscal 2021 from $65.0 million in fiscal 2020, an increase of $96.5 million. Adjusted diluted earnings per share increased to $0.85 in fiscal 2021 compared to $0.42 in fiscal 2020.
Adjusted EBITDA
Adjusted EBITDA increased to $270.6 million fiscal 2021 from $182.8 million in fiscal 2020, an increase of $87.8 million or 48.0%. This increase was due primarily to our increase in comparable sales, an improvement in gross margin, and cost leverage.
Comparison of Fiscal 2020 and 2019
Impact of 53rd week
Fiscal 2020 included a 53rd week, which added approximately $18.0 million in sales, $1.5 million in net income, and $3.0 million in Adjusted EBITDA.
Sales
Sales increased to $1,112.2 million in fiscal 2020 from $928.2 million in fiscal 2019, an increase of $184.0 million or 19.8%. The increase was the result of an increase in comparable sales of 18.0% and non-comparable sales growth primarily attributable to acquisitions and the 53rd week. The comparable sales increase of $163.3 million in fiscal 2020 was driven by an increase in consumer demand across all product categories due to higher use of residential pools and spas.
We believe that COVID-19 has accelerated secular trends in consumer behavior and has favorably impacted our sales. While the duration and effects of the COVID-19 pandemic are uncertain, we anticipate that the changes in consumer behavior will continue for the foreseeable future.
Gross Profit and Gross Margin
Gross profit increased to $460.7 million in fiscal 2020 from $379.7 million in fiscal 2019, an increase of $81.0 million or 21.3%. Gross profit increased by $72.4 million due to higher comparable sales and by $8.8 million due to higher non-comparable sales, and was partially offset by $0.2 million due to higher occupancy expenses. Gross margin increased to 41.4% in fiscal 2020 compared to 40.9% in fiscal 2019, an increase of 51 basis points.
Selling, General and Administrative Expenses
SG&A increased to $314.3 million in fiscal 2020 from $258.2 million in fiscal 2019, an increase of $56.1 million or 21.7%. As a percentage of sales, SG&A increased to 28.3% in fiscal 2020 compared to 27.8% in fiscal 2019, an increase of 45 basis points. The increase in SG&A was primarily driven by increased costs related to higher sales volume of $20.6 million, higher compensation expense of $10.9 million, expenses associated with COVID-19 of $8.6 million for temporary wage increases and personal protective equipment, expenses related to strategic consolidations of certain locations of $3.5 million, one-time bonus incentive accruals of $2.9 million, and higher general and administrative expenses of $9.7 million partially driven by higher spend related to information systems.
Total Other Expense
Total other expense decreased to $85.2 million in fiscal 2020 from $106.0 million in fiscal 2019, a decrease of $20.8 million. The decrease in fiscal 2020 was primarily driven by lower interest expense on our floating rate debt of $14.5 million, a reduction in fair market valuation adjustments related to our interest rate cap agreements of $4.3 million, and a reduction of other expenses of $2.0 million.
Income Taxes
Income tax expense decreased to $2.6 million in fiscal 2020 compared to $14.9 million in fiscal 2019, a decrease of $12.3 million. The decrease in income tax expense was the result of higher income before taxes during fiscal 2020, which was more than offset by the impact of limitations on interest expense deductibility in accordance with section 163(j) of the Tax Cuts and Jobs Act of 2017.
38
Net Income and Earnings per Share
Net income increased to $58.6 million in fiscal 2020 from $0.7 million in fiscal 2019, an increase of $57.9 million. Diluted earnings per share increased to $0.37 in fiscal 2020 from $0.00 in fiscal 2019.
Adjusted net income increased to $65.0 million in fiscal 2020 from an Adjusted net income of $12.8 million in fiscal 2019, an increase of $52.2 million. Adjusted diluted earnings per share increased to $0.42 in fiscal 2020 compared to $0.08 in fiscal 2019.
Adjusted EBITDA
Adjusted EBITDA increased to $182.8 million in fiscal 2020 from $160.0 million in fiscal 2019, an increase of $22.8 million or 14.3%. The increase was due primarily to our increase in comparable sales and an improvement in gross margin. Adjusted EBITDA as a percentage of sales decreased to 16.4% in fiscal 2020 compared to 17.2% in fiscal 2019, a decrease of 80 basis points.
Seasonality and Quarterly Fluctuations
Our business is highly seasonal. In general, sales and earnings are highest during the third and fourth fiscal quarters, which include April through September and represent the peak months of swimming pool use. In fiscal 2021, we generated 75% of our sales and 97% of our Adjusted EBITDA in the third and fourth quarters of our fiscal year. Sales are substantially lower during our first and second fiscal quarters. We have a long track record of investing in our business throughout the year, including in operating expenses, working capital, and capital expenditures related to new locations and other growth initiatives. While these investments drive performance during the primary selling season in our third and fourth fiscal quarters, they have a negative impact during our first and second fiscal quarters.
We experience a build-up of inventory and accounts payable during the first and second fiscal quarters in anticipation of the peak swimming pool supply selling season. We negotiate extended payment terms with certain of our primary suppliers as we receive merchandise in December through March and we pay for merchandise in April through July.
The principal external factor affecting our business is weather. Hot weather can increase purchases of chemicals and other non-discretionary products and purchases of discretionary products, and can drive increased purchases of installation and repair services. Unseasonably cool weather or significant amounts of rainfall during the peak sales season can reduce chemical consumption in pools and spas and decrease consumer purchases of our products and services. In addition, unseasonably early or late warming trends can increase or decrease the length of the pool season and impact timing around pool openings and closings and, therefore, our total sales and timing of our sales.
We generally open new locations before our peak selling season begins and we close locations after our peak selling season ends. We expect that our quarterly results of operations will fluctuate depending on the timing and amount of sales contributed by new locations.
Liquidity and Capital Resources
Overview
Our primary sources of liquidity are net cash provided by operating activities and borrowing availability under our ABL Credit Facility. Historically, we have funded working capital requirements, capital expenditures, payments related to acquisitions and debt service requirements with internally generated cash on hand and through our ABL Credit Facility.
Cash and cash equivalents consist primarily of cash on deposit with banks. Cash and cash equivalents totaled $345.1 million, $157.1 million and $90.9 million as of October 2, 2021, October 3, 2020 and September 28, 2019, respectively. As of October 2, 2021, October 3, 2020, and September 28, 2019, we did not have any outstanding borrowings under our ABL Credit Facility. On April 12, 2021, we entered into an agreement to the $200.0 million ABL Credit Facility. See Note 10 - Long-Term Debt to our consolidated financial statements included elsewhere in this Annual Report on Form 10-K for more detail.
Our primary working capital requirements are for the purchase of inventory, payroll, rent, other facility costs, distribution costs, and general and administrative costs. Our working capital requirements fluctuate during the year, driven primarily by seasonality and the timing of inventory purchases.
Our capital expenditures are primarily related to infrastructure-related investments, including investments related to upgrading and maintaining our information technology systems, ongoing location improvements, expenditures related to our distribution centers, and new location openings. We expect to fund capital expenditures from net cash provided by operating activities.
39
Based on our growth plans, we believe our cash and cash equivalents position, net cash provided by operating activities and borrowing availability under our ABL Credit Facility will be adequate to finance our working capital requirements, planned capital expenditures, and debt service over the next 12 months. In the future, we may also allocate capital toward additional strategic acquisitions. If cash provided by operating activities and borrowings under our ABL Credit Facility are not sufficient or available to meet our capital requirements, then we may need to obtain additional equity or debt financing. There can be no assurance that equity or debt financing will be available to us if we need it or, if available, whether the terms will be satisfactory to us.
As of October 2, 2021, outstanding standby letters of credit totaled $9.2 million and, after considering borrowing base restrictions, we had $190.8 million of available borrowing capacity under the terms of the ABL Credit Facility. As of October 2, 2021, we were in compliance with the covenants under the ABL Credit Facility and our Term Loan agreements.
Summary of Cash Flows
A summary of our cash flows from operating, investing, and financing activities is presented in the following table (in thousands):
|
|
Year Ended |
|
|||||||||
|
|
October 2, 2021 |
|
|
October 3, 2020 |
|
|
September 28, 2019 |
|
|||
Net cash provided by operating activities |
|
$ |
169,560 |
|
|
$ |
103,409 |
|
|
$ |
57,821 |
|
Net cash used in investing activities |
|
|
(35,355 |
) |
|
|
(26,811 |
) |
|
|
(36,996 |
) |
Net cash provided by (used in) financing activities |
|
|
53,780 |
|
|
|
(10,425 |
) |
|
|
(7,495 |
) |
Net increase in cash and cash equivalents |
|
$ |
187,985 |
|
|
$ |
66,173 |
|
|
$ |
13,330 |
|
Cash Provided by Operating Activities
Net cash provided by operating activities increased to $169.6 million in fiscal 2021 from $103.4 million in fiscal 2020, an increase of $66.2 million or 64.0%. This increase was primarily driven by the increase in net income related to our sales growth, partially offset by changes in working capital related to the strategic investment in product inventories to meet heightened customer demand across product categories.
Net cash provided by operating activities increased to $103.4 million in fiscal 2020 from $57.8 million in fiscal 2019, an increase of $45.6 million or 78.9%. This increase in cash flows was primarily driven by the increase in net income related to our sales growth, partially offset by an increase in prepaid expenses and a reduction in income taxes payable.
Cash Used in Investing Activities
Net cash used in investing activities increased to $35.4 million in fiscal 2021 from $26.8 million in fiscal 2020, an increase of $8.6 million. This increase was primarily driven by an increase in investments in information technology initiatives.
Net cash used in investing activities decreased to $26.8 million in fiscal 2020 from $37.0 million in fiscal 2019, a decrease of $10.2 million. The decrease was primarily due to the opening of fewer new locations and a reduction in acquisition-related investments.
Cash Provided by (Used in) Financing Activities
Net cash provided by financing activities in fiscal 2021 of $53.8 million, was primarily related to net proceeds raised during our IPO in November 2020 of $458.6 million, partially offset by a $396.1 million repayment of long term debt. Net cash used in financing activities in fiscal 2020 of $10.4 million, relates to the net paydown of long term debt. Net cash used in financing activities in fiscal 2019 of $7.5 million was primarily related to mandatory payments on our Term Loan and declared dividends.
40
Contractual Obligations and Other Commitments
The following table summarizes our contractual cash obligations as of October 2, 2021 (in thousands):
|
|
Payments Due By Period |
|
|||||||||||||||||||||||||
|
|
Total |
|
|
2022 |
|
|
2023 |
|
|
2024 |
|
|
2025 |
|
|
2026 |
|
|
Thereafter |
|
|||||||
ABL Credit Facility (1) |
|
$ |
— |
|
|
$ |
— |
|
|
$ |
— |
|
|
$ |
— |
|
|
$ |
— |
|
|
$ |
— |
|
|
$ |
— |
|
Term Loan |
|
|
805,950 |
|
|
|
8,100 |
|
|
|
8,100 |
|
|
|
6,075 |
|
|
|
10,125 |
|
|
|
8,100 |
|
|
|
765,450 |
|
Letters of credit |
|
|
9,171 |
|
|
|
9,171 |
|
|
|
— |
|
|
|
— |
|
|
|
— |
|
|
|
— |
|
|
|
— |
|
Purchase commitments (2) |
|
|
138,035 |
|
|
|
32,478 |
|
|
|
32,482 |
|
|
|
32,479 |
|
|
|
32,477 |
|
|
|
8,119 |
|
|
|
— |
|
Operating lease obligations (3) |
|
|
245,030 |
|
|
|
75,997 |
|
|
|
55,028 |
|
|
|
47,619 |
|
|
|
32,832 |
|
|
|
22,178 |
|
|
|
11,376 |
|
Total |
|
$ |
1,198,186 |
|
|
$ |
125,746 |
|
|
$ |
95,610 |
|
|
$ |
86,173 |
|
|
$ |
75,434 |
|
|
$ |
38,397 |
|
|
$ |
776,826 |
|
Critical Accounting Policies and Estimates
Our consolidated financial statements have been prepared in accordance with GAAP. The preparation of our consolidated financial statements and notes to our consolidated financial statements requires us to make estimates that affect the reported amounts of assets, liabilities, sales and expenses, and related disclosures of contingent assets and liabilities. We base these estimates on historical results and various other assumptions we believe to be reasonable, all of which form the basis for making estimates concerning the carrying values of assets and liabilities that are not readily available from other sources. Actual results may differ from these estimates.
Our significant accounting policies are described in Note 2 - Summary of Significant Accounting Policies to our consolidated financial statements included elsewhere in this Annual Report on Form 10-K. We believe that the following critical accounting policies affect the most significant estimates and management judgments used in preparing our consolidated financial statements.
Vendor Rebates
Many of our vendor arrangements provide for us to receive specified amounts of consideration when we achieve various measures. These measures generally relate to the volume level of purchases from our vendors. We generally account for vendor programs as a reduction of the prices of the vendor’s products and therefore a reduction of inventory until we sell the product, at which time we recognize such consideration as a reduction of cost of merchandise and services sold in our consolidated statements of operations.
Inventories, Net
Inventories are stated at the lower of cost or market or net realizable value. We value inventory using the weighted-average cost method. We evaluate inventory for excess and obsolescence and record necessary reserves. We provide provisions for losses related to inventories based on historical purchase cost, selling price, margin, and current business trends. When an inventory item is sold or disposed, the associated reserve is released at that time.
Goodwill and Other Intangibles
Goodwill and intangible assets are recorded at their estimated fair values at the date of acquisition. We review goodwill and indefinite lived intangible assets for impairment annually (in the fourth quarter) or on an interim basis whenever events or changes in circumstances indicate the fair value of such assets may be below their carrying amount. The Company’s impairment evaluation of goodwill consists of a qualitative assessment to determine if it is more likely than not that the fair value of its single reporting unit is less than its carrying amount. The Company’s qualitative assessment considered factors including changes macroeconomic conditions, industry and market conditions, cost factors, a sustained share price or market capitalization decrease, and any reporting unit specific events. If this qualitative assessment indicates it is more likely than not that the estimated fair value of a reporting unit exceeds its
41
carrying value, no further analysis is required and goodwill is not impaired. Otherwise, we compare the estimated fair value of the asset to its carrying amount with an impairment loss recognized for the amount, if any, by which carrying value exceeds estimated fair value.
The impairment evaluation for the Company’s indefinite-lived intangible assets consists of a qualitative assessment similar to that for goodwill, for each indefinite-lived intangible asset. If the qualitative assessment indicates it is more likely than not that the estimated fair value of an indefinite-lived intangible asset exceeds its carrying value, no further analysis is required and the asset is not impaired. Otherwise, the Company compares the estimated fair value of the asset to its carrying amount with an impairment loss recognized for the amount, if any, by which carrying value exceeds estimated fair value. We evaluate whether certain trade names continue to have an indefinite life annually.
Finite-lived intangible assets are amortized to reflect the pattern of economic benefits consumed. We evaluate amortizable intangible assets for potential impairment whenever events or changes in circumstances indicate that the carrying amounts of the assets may not be fully recoverable. Intangible assets useful lives are reviewed annually.
Leases
We enter into contractual arrangements for the utilization of certain non-owned assets which are evaluated as finance or operating leases upon commencement, and are accounted for accordingly. Specifically, a contract is or contains a lease when (1) the contract contains an explicitly or implicitly identified asset and (2) we obtain substantially all of the economic benefits from the use of that underlying asset and direct how and for what purpose the asset is used during the term of the contract in exchange for consideration. We assess whether an arrangement is or contains a lease at inception of the contract.
We lease certain retail locations, warehouse and distribution space, office space, equipment, and vehicles. A substantial majority of our leases have an initial lease term of five years, typically with the option to extend the lease for at least one additional five-year term. Some of our leases may include the option to terminate in less than five years. The lease term used to calculate the right-of-use asset and lease liability at commencement includes the impacts of options to extend or terminate the lease when it is reasonably certain that we will exercise that option. When determining whether it is reasonably certain that we will exercise an option at commencement, we consider various existing economic factors, including market conditions, real estate strategies, the nature, length, and terms of the agreement, as well as the uncertainty of the condition of leased equipment at the end of the lease term. Based on these considerations, we generally conclude that the exercise of renewal options would not be reasonably certain in calculating our operating lease liability at commencement. The discount rate used to calculate the present value of lease payments is the rate implicit in the lease, when readily determinable. As the rate implicit in the lease is rarely readily determinable, we use a secured incremental borrowing rate, which is updated on a periodic basis as the discount rate for the present value of lease payments. Real estate taxes, insurance, maintenance, and operating expenses applicable to the leased property are generally our obligations under our lease agreements. In instances where these payments are fixed, they are included in the measurement of our lease liabilities, and when variable, are excluded and recognized in the period in which the obligation for those payments is incurred. For variable payments dependent upon an index or rate, we apply the active index or rate as of the lease commencement date. Variable lease payments not based on an index or rate are not included in the measurement of our operating lease liabilities as they cannot be reasonably estimated, and are recognized in the period in which the obligation for those payments is incurred. Leases that have a term of 12 months or less upon commencement are considered short-term in nature and as such are not included in the measurement of our operating lease right-of-use assets and operating lease liabilities on the consolidated balance sheets and are expensed on a straight line basis over the lease term. In addition, we do separate lease and non-lease components (e.g. common area maintenance). Our lease agreements do not contain any material residual value guarantees or material restrictive covenants.
Revenue Recognition
Revenue is recognized when control of the promised goods or services is transferred to our customer, in an amount that reflects the consideration we expect to be entitled to in exchange for such goods or services. Revenue from merchandise sales at retail locations is recognized at the point of sale, revenue from services are recognized when the services are rendered. Revenue from e-commerce merchandise sales is recognized either at the time of pick-up at one of our locations or at the time of shipment depending on the customer’s order designation. Revenue is recorded net of related discounts and sales tax. Payment from retail customers is generally at the point of sale and payment terms for professional pool operators are based on our credit requirements and generally have terms of less than 60 days. When we receive payment from a consumer before the consumer has taken possession of the merchandise or the service has been performed, the amount received is recorded as deferred revenue or as a customer deposit until the sale or service is
42
complete. Shipping and handling are treated as costs to fulfill the contract and not a separate performance obligation. We include shipping and handling fees billed to customers within net sales and related costs are charged to cost of merchandise and services sold.
We estimate a liability for sales returns based on current sales levels and historical return trends. At each financial reporting date, we assess our estimates of expected returns, and a corresponding adjustment to cost of sales for our right to recover the goods returned by the customer, net of any expected recovery cost. Adjustments related to changes in return estimates were immaterial in all periods presented.
Our loyalty program allows members to earn reward points based on their purchases. Once a loyalty member achieves a certain point level, the member earns an award that may be used on future purchases, which are valid for 12 months from issuance. The program represents a material right to the customer and points may be redeemed on future products and services. We defer revenue related to points earned that have not yet been redeemed. The amount of deferred revenue is based on the estimated standalone selling price of points earned by members reduced by the percentage of points expected to be redeemed. The estimated redemption percentage is based on historical redemption trends and considers current information or trends. Revenue is recognized when the rewards are redeemed, expired or based on estimated breakage. When a customer redeems points or the points expire, the Company recognizes revenue in net sales on the consolidated statements of operations.
Income Taxes
We account for income taxes under the asset and liability method, which requires the recognition of deferred tax assets and liabilities for the future tax consequences attributable to differences between the financial statement carrying amounts and tax bases of existing assets and liabilities. Deferred tax assets, including the benefit of net operating loss and tax credit carryforwards, are evaluated based on the guidelines for realization and are reduced by a valuation allowance if it is deemed more likely than not that such assets will not be realized. We consider several factors in evaluating the realizability of our deferred tax assets, including the nature, frequency and severity of recent losses, the remaining years available for carryforwards, changes in tax laws, the future profitability of the operations in the jurisdiction, and tax planning strategies. Our judgments and estimates concerning realizability of deferred tax assets could change if any of the evaluation factors change, resulting in an increase or decrease to income tax expense in any period.
The ultimate realization of deferred tax assets can be dependent upon the generation of future taxable income during the periods in which the associated temporary differences become deductible. On a quarterly basis, we evaluate whether it is more likely than not that our deferred tax assets will be realized in the future and conclude whether a valuation allowance must be established.
We record a liability for uncertain tax positions to the extent a tax position taken or expected to be taken in a tax return does not meet certain recognition or measurement criteria. Considerable management judgment is necessary to assess the inherent uncertainties related to the interpretations of complex tax laws, regulations and taxing authority rulings. Our judgments and estimates may change as a result of the evaluation of new information, such as the outcome of tax audits or changes to or further interpretations of tax laws and regulations, resulting in an increase or decrease to income tax expense in any period. Interest and penalties accrued, if any, relating to uncertain tax positions will be recognized as a component of the income tax provision.
Self-Insurance Reserves
We are self-insured for losses relating to workers’ compensation, general liability, and employee medical. Stop-loss coverage has been purchased to limit exposure to any material level of claims. Liabilities for self-insurance reserves are estimated based on independent actuarial estimates, which are based on historical information and assumptions about future events. We utilize various techniques, including analysis of historical trends and actuarial valuation methods, to estimate the cost to settle reported claims and claims incurred but not yet reported as of the balance sheet date. The actuarial valuation methods consider loss development factors, which include the development time frame and expected claim reporting and settlement patterns, and expected loss costs, which include the expected frequency and severity of claim activity.
Recent Accounting Pronouncements
For information regarding recent accounting pronouncements, see Note 2 - Summary of Significant Accounting Policies to our consolidated financial statements included elsewhere in this Annual Report on Form 10-K.
43
Item 7A. Quantitative and Qualitative Disclosures About Market Risk.
Interest Rate Risk
Our operating results are subject to risk from interest rate fluctuations on our borrowings, which carry variable interest rates. Our borrowings include our ABL Credit Facility and Term Loan. Our ABL Credit Facility provides for revolving loans of up to $200.0 million, with a sub-commitment for issuance of letters of credit of $25.0 million. Because our borrowings bear interest at a variable rate, we are exposed to market risks relating to changes in interest rates. As of October 2, 2021, we had variable rate debt outstanding of $806.0 million under our Term Loan. No amounts were outstanding under our ABL Credit Facility as of October 2, 2021. In conjunction with our IPO all of our obligations related to the senior unsecured notes were settled. Based on the outstanding variable rate loan balance for the Term Loan an increase or decrease of 1% in the effective interest rate would cause an increase or decrease in interest cost of approximately $8.1 million over the next 12 months. From time to time, we may enter into interest rate cap agreements to manage interest rate risk. Such agreements cap the borrowing rate on variable debt to provide a hedge against the risk of rising rates. As of October 3, 2020, we had two interest rate cap agreements with a total notional amount of $750 million (the “Cap Agreements”) to mitigate the impact of fluctuations in the three-month LIBOR and effectively cap the LIBOR applicable to our variable rate debt at a rate of 3.00%. Fluctuations in the market value of the Cap Agreements are recorded in other expenses, net in our consolidated statements of operations. In March 2021, our Cap Agreements expired.
The United Kingdom’s Financial Conduct Authority has announced the phased cessation of publication of LIBOR beginning after 2021 and continuing through 2023. When LIBOR is discontinued, we may need to change the terms of certain of our floating rate notes, interest rate cap agreements, and credit instruments which utilize LIBOR as a benchmark in determining the interest rate, to replace LIBOR with the new standard that is established. As a result, we may incur incremental costs in transition to a new standard, and interest rates on our current or future indebtedness may be adversely affected by the new standard. Decision have not been finalized regarding the replacement rates. As such, the potential effect of any such event on our cost of capital cannot yet be determined, but we do not expect it to have a material impact to our consolidated financial condition, results of operations, or cash flows.
Impact of Inflation
We experience inflation and deflation related to our purchase of certain products. This price volatility could potentially have a material impact on our financial condition and/or our results of operations. We actively manage the impact of inflation, including tariffs, through strong relationships with our diverse supplier base, vendor negotiation, and promotion management. We also strategically invest through inventory purchases in order to obtain favorable pricing ahead of any vendor price increases. In order to mitigate price volatility, we monitor price fluctuations and may adjust our selling prices accordingly, however, our ability to recover higher costs through increased pricing may be limited by the competitive environment in which we operate. We currently do not use derivative instruments to manage these risks.
44
Item 8. Financial Statements and Supplementary Data
LESLIE’S, INC.
INDEX TO CONSOLIDATED FINANCIAL STATEMENTS
Audited Consolidated Financial Statements for the fiscal years ended October 2, 2021, October 3, 2020 and September 28, 2019
|
Page |
46 |
|
48 |
|
49 |
|
50 |
|
51 |
|
52 |
45
Report of Independent Registered Public Accounting Firm
To the Stockholders and Board of Directors of Leslie’s, Inc.
Opinion on the Financial Statements
We have audited the accompanying consolidated balance sheets of Leslie’s, Inc. (the Company) as of October 2, 2021 and October 3, 2020, the related consolidated statements of operations, stockholder’s deficit and cash flows for each of the three years in the period ended October 2, 2021, and the related notes (collectively referred to as the “consolidated financial statements”). In our opinion, the consolidated financial statements present fairly, in all material respects, the financial position of the Company at October 2, 2021 and October 3, 2020, and the results of its operations and its cash flows for each of the three years in the period ended October 2, 2021, in conformity with U.S. generally accepted accounting principles.
Basis for Opinion
These financial statements are the responsibility of the Company’s management. Our responsibility is to express an opinion on the Company’s financial statements based on our audits. We are a public accounting firm registered with the Public Company Accounting Oversight Board (United States) (PCAOB) and are required to be independent with respect to the Company in accordance with the U.S. federal securities laws and the applicable rules and regulations of the Securities and Exchange Commission and the PCAOB.
We conducted our audits in accordance with the standards of the PCAOB. Those standards require that we plan and perform the audit to obtain reasonable assurance about whether the financial statements are free of material misstatement, whether due to error or fraud. The Company is not required to have, nor were we engaged to perform, an audit of its internal control over financial reporting. As part of our audits we are required to obtain an understanding of internal control over financial reporting but not for the purpose of expressing an opinion on the effectiveness of the Company’s internal control over financial reporting. Accordingly, we express no such opinion.
Our audits included performing procedures to assess the risks of material misstatement of the financial statements, whether due to error or fraud, and performing procedures that respond to those risks. Such procedures included examining, on a test basis, evidence regarding the amounts and disclosures in the financial statements. Our audits also included evaluating the accounting principles used and significant estimates made by management, as well as evaluating the overall presentation of the financial statements. We believe that our audits provide a reasonable basis for our opinion.
Critical Audit Matter
The critical audit matter communicated below is a matter arising from the current period audit of the financial statements that was communicated or required to be communicated to the audit committee and that: (1) relates to accounts or disclosures that are material to the financial statements and (2) involved especially challenging, subjective or complex judgments. The communication of the critical audit matter does not alter in any way our opinion on the consolidated financial statements, taken as a whole, and we are not, by communicating the critical audit matter below, providing a separate opinion on the critical audit matter or on the account or disclosure to which it relates.
46
|
Valuation of Workers Compensation Self-Insurance Reserve |
Description of the Matter |
As more fully described in Note 2 of the consolidated financial statements, the Company retains a significant portion of the risks associated with workers’ compensation insurance costs. The Company utilizes various techniques, including analysis of historical trends and actuarial valuation methods, to estimate the cost to settle reported claims and claims incurred but not yet reported. The actuarial valuation methods consider loss development factors, which include the development time frame and expected claim reporting and settlement patterns, and expected loss costs, which include the expected frequency and severity of claim activity.
Auditing management’s estimate of the workers compensation self-insurance reserve is complex due to the judgmental nature of estimating the costs to settle reported claims and claims incurred but not yet reported. There are a number of factors and/or assumptions (e.g., severity, duration and frequency of claims and projected inflation of related factors) used in the measurement process which have a significant effect on the estimated workers compensation self-insurance reserve. |
How We Addressed the Matter in Our Audit |
To evaluate the workers compensation self-insurance reserve, our audit procedures included, among others, assessing the methodologies used, evaluating the significant actuarial assumptions and testing the completeness and the accuracy of the underlying claims data used by the Company. We compared the actuarial assumptions used by management to historical trends and evaluated the change in the self-insurance reserve from the prior year. In addition, we involved our actuarial specialists to assist in assessing the valuation methodologies and significant assumptions used in the valuation analysis, we evaluated management’s actuarial valuation methodology, we compared the significant assumptions used by management to industry accepted actuarial assumptions, and we compared the Company’s reserve to an independently estimated range developed by our actuarial specialists. |
/s/ Ernst & Young LLP
We have served as the Company’s auditor since 2000.
Phoenix, Arizona
December 10, 2021
47
LESLIE’S, INC.
Consolidated Balance Sheets
(Amounts in Thousands, Except Share and Per Share Amounts)
|
|
October 2, 2021 |
|
|
October 3, 2020 |
|
||
Assets |
|
|
|
|
|
|
||
Current assets |
|
|
|
|
|
|
||
Cash and cash equivalents |
|
$ |
|
|
$ |
|
||
Accounts and other receivables, net |
|
|
|
|
|
|
||
Inventories |
|
|
|
|
|
|
||
Prepaid expenses and other current assets |
|
|
|
|
|
|
||
Total current assets |
|
|
|
|
|
|
||
Property and equipment, net |
|
|
|
|
|
|
||
Operating lease right-of-use assets |
|
|
|
|
|
|
||
Goodwill and other intangibles, net |
|
|
|
|
|
|
||
Deferred tax assets |
|
|
|
|
|
|
||
Other assets |
|
|
|
|
|
|
||
Total assets |
|
$ |
|
|
$ |
|
||
Liabilities and stockholders’ deficit |
|
|
|
|
|
|
||
Current liabilities |
|
|
|
|
|
|
||
Accounts payable and accrued expenses |
|
$ |
|
|
$ |
|
||
Operating lease liabilities |
|
|
|
|
|
|
||
Income taxes payable |
|
|
|
|
|
|
||
Current portion of long-term debt |
|
|
|
|
|
|
||
Total current liabilities |
|
|
|
|
|
|
||
Operating lease liabilities, noncurrent |
|
|
|
|
|
|
||
Long-term debt, net |
|
|
|
|
|
|
||
Other long-term liabilities |
|
|
|
|
|
|
||
Total liabilities |
|
|
|
|
|
|
||
|
|
|
|
|
|
|||
Stockholders’ deficit |
|
|
|
|
|
|
||
Common stock, $ |
|
|
|
|
|
|
||
Additional paid in capital (deficit) |
|
|
|
|
|
( |
) |
|
Retained deficit |
|
|
( |
) |
|
|
( |
) |
Total stockholders’ deficit |
|
|
( |
) |
|
|
( |
) |
Total liabilities and stockholders’ deficit |
|
$ |
|
|
$ |
|
||
See accompanying notes which are an integral part of these consolidated financial statements.
48
LESLIE’S, INC.
Consolidated Statements of Operations
(Amounts in Thousands, Except Per Share Amounts)
|
|
Year Ended |
|
|||||||||
|
|
October 2, 2021 |
|
|
October 3, 2020 |
|
|
September 28, 2019 |
|
|||
Sales |
|
$ |
|
|
$ |
|
|
$ |
|
|||
Cost of merchandise and services sold |
|
|
|
|
|
|
|
|
|
|||
Gross profit |
|
|
|
|
|
|
|
|
|
|||
Selling, general and administrative expenses |
|
|
|
|
|
|
|
|
|
|||
Operating income |
|
|
|
|
|
|
|
|
|
|||
Other expense: |
|
|
|
|
|
|
|
|
|
|||
Interest expense |
|
|
|
|
|
|
|
|
|
|||
Loss on debt extinguishment |
|
|
|
|
|
— |
|
|
|
— |
|
|
Other expenses, net |
|
|
|
|
|
|
|
|
|
|||
Total other expense |
|
|
|
|
|
|
|
|
|
|||
Income before taxes |
|
|
|
|
|
|
|
|
|
|||
Income tax expense |
|
|
|
|
|
|
|
|
|
|||
Net income |
|
$ |
|
|
$ |
|
|
$ |
|
|||
Net income per share: |
|
|
|
|
|
|
|
|
|
|||
Basic |
|
$ |
|
|
$ |
|
|
$ |
|
|||
Diluted |
|
$ |
|
|
$ |
|
|
$ |
|
|||
Weighted average shares outstanding: |
|
|
|
|
|
|
|
|
|
|||
Basic |
|
|
|
|
|
|
|
|
|
|||
Diluted |
|
|
|
|
|
|
|
|
|
|||
See accompanying notes which are an integral part of these consolidated financial statements.
49
LESLIE’S, INC.
Consolidated Statements of Stockholders’ Deficit
(Amounts in Thousands)
|
|
Common Stock |
|
|
Additional |
|
|
Retained |
|
|
Total |
|
||||||||
|
|
Shares |
|
|
Amount |
|
|
(Deficit) |
|
|
Deficit |
|
|
Deficit |
|
|||||
Balance, September 29, 2018 |
|
|
|
|
$ |
|
|
$ |
( |
) |
|
$ |
( |
) |
|
$ |
( |
) |
||
Equity-based compensation |
|
|
— |
|
|
|
— |
|
|
|
|
|
|
— |
|
|
|
|
||
Payment of dividend |
|
|
— |
|
|
|
— |
|
|
|
— |
|
|
|
( |
) |
|
|
( |
) |
Net income |
|
|
— |
|
|
|
— |
|
|
|
— |
|
|
|
|
|
|
|
||
Balance, September 28, 2019 |
|
|
|
|
|
|
|
|
( |
) |
|
|
( |
) |
|
|
( |
) |
||
Impact of adoption of new accounting pronouncements |
|
|
— |
|
|
|
— |
|
|
|
— |
|
|
|
|
|
|
|
||
Equity-based compensation |
|
|
— |
|
|
|
— |
|
|
|
|
|
|
— |
|
|
|
|
||
Net income |
|
|
— |
|
|
|
— |
|
|
|
— |
|
|
|
|
|
|
|
||
Balance, October 3, 2020 |
|
|
|
|
|
|
|
|
( |
) |
|
|
( |
) |
|
|
( |
) |
||
Vesting of restricted stock units |
|
|
|
|
|
|
|
|
— |
|
|
|
— |
|
|
|
|
|||
Issuance of common stock upon initial public offering, |
|
|
|
|
|
|
|
|
|
|
|
— |
|
|
|
|
||||
Equity-based compensation |
|
|
— |
|
|
|
— |
|
|
|
|
|
|
— |
|
|
|
|
||
Net income |
|
|
— |
|
|
|
— |
|
|
|
— |
|
|
|
|
|
|
|
||
Balance, October 2, 2021 |
|
|
|
|
$ |
|
|
$ |
|
|
$ |
( |
) |
|
$ |
( |
) |
|||
See accompanying notes which are an integral part of these consolidated financial statements.
50
LESLIE’S, INC.
Consolidated Statements of Cash Flows
(Amounts in Thousands)
|
|
Year Ended |
|
|||||||||
|
|
October 2, 2021 |
|
|
October 3, 2020 |
|
|
September 28, 2019 |
|
|||
Operating Activities |
|
|
|
|
|
|
|
|
|
|||
Net income |
|
$ |
|
|
$ |
|
|
$ |
|
|||
Adjustments to reconcile net income to net cash provided by operating activities: |
|
|
|
|
|
|
|
|
|
|||
Depreciation and amortization |
|
|
|
|
|
|
|
|
|
|||
Equity-based compensation |
|
|
|
|
|
|
|
|
|
|||
Amortization of deferred financing costs and debt discounts |
|
|
|
|
|
|
|
|
|
|||
Provision for doubtful accounts |
|
|
|
|
|
|
|
|
|
|||
Deferred income taxes |
|
|
|
|
|
( |
) |
|
|
( |
) |
|
(Gain) loss on disposition of assets |
|
|
( |
) |
|
|
|
|
|
|
||
Loss on debt extinguishment |
|
|
|
|
|
— |
|
|
|
— |
|
|
Changes in operating assets and liabilities: |
|
|
|
|
|
|
|
|
|
|||
Accounts and other receivables |
|
|
( |
) |
|
|
|
|
|
( |
) |
|
Inventories |
|
|
( |
) |
|
|
|
|
|
( |
) |
|
Prepaid expenses and other current assets |
|
|
|
|
|
( |
) |
|
|
( |
) |
|
Other assets |
|
|
( |
) |
|
|
( |
) |
|
|
|
|
Accounts payable and accrued expenses |
|
|
|
|
|
|
|
|
|
|||
Income taxes payable |
|
|
|
|
|
( |
) |
|
|
|
||
Operating lease assets and liabilities, net |
|
|
|
|
|
|
|
|
— |
|
||
Net cash provided by operating activities |
|
|
|
|
|
|
|
|
|
|||
Investing Activities |
|
|
|
|
|
|
|
|
|
|||
Purchases of property and equipment |
|
|
( |
) |
|
|
( |
) |
|
|
( |
) |
Business acquisitions, net of cash acquired |
|
|
( |
) |
|
|
( |
) |
|
|
( |
) |
Proceeds from disposition of fixed assets |
|
|
|
|
|
|
|
|
|
|||
Net cash used in investing activities |
|
|
( |
) |
|
|
( |
) |
|
|
( |
) |
Financing Activities |
|
|
|
|
|
|
|
|
|
|||
Borrowings on revolving commitment |
|
|
— |
|
|
|
|
|
|
|
||
Payments on revolving commitment |
|
|
— |
|
|
|
( |
) |
|
|
( |
) |
Repayment of long term debt |
|
|
( |
) |
|
|
( |
) |
|
|
( |
) |
Issuance of long term debt |
|
|
|
|
|
— |
|
|
|
— |
|
|
Payment of deferred financing costs |
|
|
( |
) |
|
|
— |
|
|
|
— |
|
Payment of dividend |
|
|
— |
|
|
|
— |
|
|
|
( |
) |
Proceeds from issuance of common stock upon initial public offering, net |
|
|
|
|
|
— |
|
|
|
— |
|
|
Net cash provided by (used in) financing activities |
|
|
|
|
|
( |
) |
|
|
( |
) |
|
Net increase in cash and cash equivalents |
|
|
|
|
|
|
|
|
|
|||
Cash and cash equivalents, beginning of year |
|
|
|
|
|
|
|
|
|
|||
Cash and cash equivalents, end of year |
|
$ |
|
|
$ |
|
|
$ |
|
|||
Supplemental Information: |
|
|
|
|
|
|
|
|
|
|||
Interest |
|
$ |
|
|
$ |
|
|
$ |
|
|||
Income taxes, net of refunds received |
|
|
|
|
|
|
|
|
|
|||
See accompanying notes which are an integral part of these consolidated financial statements.
51
LESLIE’S, INC.
NOTES TO THE CONSOLIDATED FINANCIAL STATEMENTS
Note 1—Business and Operations
Leslie’s, Inc. (“Leslie’s,” “we,” “our,” “us,” “its,” or the “Company”) is the leading direct-to-consumer pool and spa care brand. We market and sell pool and spa supplies and related products and services, which primarily consist of maintenance items such as chemicals, equipment and parts, cleaning accessories, as well as safety, recreational, and fitness-related products. We currently market our products through
Initial Public Offering
In November 2020, we completed an initial public offering (“IPO”) of
Note 2—Summary of Significant Accounting Policies
Basis of Presentation and Principles of Consolidation
We prepared the accompanying consolidated financial statements following United States generally accepted accounting principles (“GAAP”). The financial statements include all normal and recurring adjustments that are necessary for a fair presentation of our financial position and operating results. Our consolidated financial statements include the accounts of Leslie’s, Inc. and our subsidiaries. All significant intercompany accounts and transactions have been eliminated.
All share and per share information included in the accompanying consolidated financial statements has been retroactively adjusted to reflect a
Fiscal Periods
Segment Reporting
Our Chief Operating Decision Maker is our Chief Executive Officer, who reviews financial information presented on a consolidated basis for purposes of allocating resources and assessing performance. We operate all of our locations in the United States and offer consumers similar products, services, and methods of distribution through our retail locations and e-commerce websites. As a result, we have a reportable segment.
Use of Estimates
Prior Period Reclassifications
Reclassifications of certain immaterial prior period amounts have been made to conform to current period presentation.
52
Cash and Cash Equivalents
Fair Value Measurements
We measure certain financial instruments and other items at fair value.
To determine the fair value, we maximize the use of observable inputs and minimize the use of unobservable inputs by requiring that the most observable inputs be used when available. Observable inputs are inputs market participants would use to value an asset or liability and are developed based on market data obtained from independent sources. Unobservable inputs are inputs based on assumptions about the factors market participants would use to value an asset or liability.
The fair value hierarchy is as follows, of which the first two are considered observable and the last unobservable:
Level 1—Quoted prices in active markets for identical assets or liabilities.
Level 2—Inputs other than Level 1 that are observable for the asset or liability, either directly or indirectly, such as quoted prices for similar assets and liabilities in active markets; quoted prices for identical or similar assets or liabilities in markets that are not active; or other inputs that are observable or can be corroborated by observable market data by correlation or other means.
Level 3—Unobservable inputs that are supported by little or no market activity and that are significant to the fair value of the assets or liabilities. Value is determined using pricing models, discounted cash flow methodologies, or similar techniques and also includes instruments for which the determination of fair value requires significant judgment or estimation.
Fair Value of Financial Instruments
We use fair value measurements to record fair value of certain assets and to estimate fair value of financial instruments not recorded at fair value but required to be disclosed at fair value.
The fair value of our amended and restated term loan credit agreement (“Term Loan”) due in 2028 was determined to be $
The fair value of our interest rate cap agreements, which expired in
The carrying amounts of cash, cash equivalents, accounts receivable, accounts payable and accrued expenses approximate fair value due to the short-term maturity of these instruments.
Vendor Rebates
Allowance for Doubtful Accounts
53
Inventories, Net
Inventories are stated at the lower of cost or market or net realizable value. We value inventory using the weighted-average cost method. We evaluate inventory for excess and obsolescence and record necessary reserves. We provide provisions for losses related to inventories based on historical purchase cost, selling price, margin, and current business trends. When an inventory item is sold or disposed, the associated reserve is released at that time.
Business Combinations
We account for business combinations using the acquisition method of accounting. This method requires that the purchase price of the acquisition be allocated to the assets acquired and liabilities assumed using the fair values determined by management as of the acquisition date. The excess of the purchase price over the amounts allocated to assets acquired and liabilities assumed is recorded as goodwill.
We use our best estimates and assumptions as part of the purchase price allocation process to accurately value assets acquired and liabilities assumed as of the acquisition date. Our estimates are inherently uncertain and subject to refinement. As a result, during the measurement period, which may be up to one year from the acquisition date, we record adjustments to the assets acquired and liabilities assumed, with the corresponding offset to goodwill to the extent we identify adjustments to the preliminary purchase price allocation. Upon the conclusion of the measurement period or final determination of the fair values of the assets acquired or liabilities assumed, whichever comes first, any subsequent adjustments are recorded in our consolidated statements of operations. Our consolidated financial statements include the results of operations from the date of acquisition for each business combination.
We expense all acquisition-related costs as incurred in selling, general and administrative expenses (“SG&A”) in our consolidated statements of operations.
Property and Equipment, Net
Property and equipment are stated at cost, less accumulated depreciation and amortization. Costs of normal maintenance and repairs are charged to expense as incurred. Major replacements or improvements of property and equipment are capitalized. When items are sold or otherwise disposed of, the cost and related accumulated depreciation or amortization are removed from the accounts, and any resulting gain or loss is included in our consolidated statements of operations.
Depreciation and amortization are computed using the straight-line method. These charges are based on the following range of useful lives:
Building and improvements |
|
Vehicles, machinery and equipment |
|
Office furniture, computers and software |
|
Leasehold improvements |
We evaluate our long-lived assets for potential impairment whenever events or changes in circumstances indicate that the carrying amount of an asset group may not be recoverable. The evaluation for long-lived assets (asset group) is performed at the lowest level of identifiable cash flows, which, for location assets, is the individual location level. The assets of a physical location with indicators of impairment are evaluated for recoverability by comparing its undiscounted future cash flows with its carrying value. If the carrying value is greater than the undiscounted future cash flows, we then measure the asset’s fair value to determine whether an impairment loss should be recognized. If the resulting fair value is less than the carrying value, an impairment loss is recognized for the difference between the carrying value and the estimated fair value. There was
Cloud Computing Arrangements
From time to time, we enter into various agreements with unaffiliated third parties for assistance with technical development work related to our security-related software and systems and other ongoing projects. Expenditures for implementation, set-up, and other upfront costs incurred in a cloud computing arrangement that is hosted by the vendor are capitalized generally in the same manner as internal use software and are recorded as other assets in our consolidated balance sheets. Such costs are amortized over the life of the related cloud computing arrangement. As of October 2, 2021, approximately $
54
Internal Use Software
Expenditures for software developed for internal use are capitalized and amortized over the estimated useful life of the software. Our policy provides for the capitalization of external direct costs of materials and services associated with developing or obtaining internal use computer software. In addition, we also capitalize certain payroll and payroll-related costs for employees who are directly associated with internal use computer software development projects. The amount of payroll costs capitalized with respect to these employees is limited to the time directly spent on such projects in the applicable development phase. Costs associated with preliminary project stage activities, training, maintenance and all other post-implementation stage activities are expensed as incurred. See Note 8 — Property and Equipment for further discussion.
Goodwill and Other Intangibles, Net
Goodwill and intangible assets are recorded at their estimated fair values at the date of acquisition. We review goodwill and indefinite lived intangible assets for impairment annually (in the fourth quarter) or on an interim basis whenever events or changes in circumstances indicate the fair value of such assets may be below their carrying amount. The Company’s impairment evaluation of goodwill consists of a qualitative assessment to determine if it is more likely than not that the fair value of its single reporting unit is less than its carrying amount. The Company’s qualitative assessment considered factors including changes macroeconomic conditions, industry and market conditions, cost factors, a sustained share price or market capitalization decrease, and any reporting unit specific events. If this qualitative assessment indicates it is more likely than not that the estimated fair value of a reporting unit exceeds its carrying value, no further analysis is required and goodwill is not impaired. Otherwise, we compare the estimated fair value of the asset to its carrying amount with an impairment loss recognized for the amount, if any, by which carrying value exceeds estimated fair value.
The impairment evaluation for the Company’s indefinite-lived intangible assets consists of a qualitative assessment similar to that for goodwill, for each indefinite-lived intangible asset. If the qualitative assessment indicates it is more likely than not that the estimated fair value of an indefinite-lived intangible asset exceeds its carrying value, no further analysis is required and the asset is not impaired. Otherwise, the Company compares the estimated fair value of the asset to its carrying amount with an impairment loss recognized for the amount, if any, by which carrying value exceeds estimated fair value. We evaluate whether certain trade names continue to have an indefinite life annually.
Finite-lived intangible assets are amortized to reflect the pattern of economic benefits consumed. We evaluate amortizable intangible assets for potential impairment whenever events or changes in circumstances indicate that the carrying amounts of the assets may not be fully recoverable. Intangible assets useful lives are reviewed annually.
Leases
We
We enter into contractual arrangements for the utilization of certain non-owned assets which are evaluated as finance or operating leases upon commencement, and are accounted for accordingly. Specifically, a contract is or contains a lease when (1) the contract contains an explicitly or implicitly identified asset and (2) we obtain substantially all of the economic benefits from the use of that underlying asset and direct how and for what purpose the asset is used during the term of the contract in exchange for consideration. We assess whether an arrangement is or contains a lease at inception of the contract.
We lease certain retail locations, warehouse and distribution space, office space, equipment, and vehicles. A substantial majority of our leases have an initial lease term of
55
commencement. The discount rate used to calculate the present value of lease payments is the rate implicit in the lease, when readily determinable. As the rate implicit in the lease is rarely readily determinable, we use a secured incremental borrowing rate, which is updated on a periodic basis as the discount rate for the present value of lease payments. Real estate taxes, insurance, maintenance, and operating expenses applicable to the leased property are generally our obligations under our lease agreements. In instances where these payments are fixed, they are included in the measurement of our lease liabilities, and when variable, are excluded and recognized in the period in which the obligation for those payments is incurred. For variable payments dependent upon an index or rate, we apply the active index or rate as of the lease commencement date. Variable lease payments not based on an index or rate are not included in the measurement of our operating lease liabilities as they cannot be reasonably estimated, and are recognized in the period in which the obligation for those payments is incurred. Leases that have a term of 12 months or less upon commencement are considered short-term in nature and as such are not included in the measurement of our operating lease right-of-use assets and operating lease liabilities on the consolidated balance sheets and are expensed on a straight line basis over the lease term. In addition, we do separate lease and non-lease components (e.g. common area maintenance). Our lease agreements do not contain any material residual value guarantees or material restrictive covenants.
Revenue Recognition
Revenue is recognized when control of the promised goods or services is transferred to our customer, in an amount that reflects the consideration we expect to be entitled to in exchange for such goods or services. Revenue from merchandise sales at retail locations is recognized at the point of sale, revenue from services are recognized when the services are rendered. Revenue from e-commerce merchandise sales is recognized either at the time of pick-up at one of our locations or at the time of shipment depending on the customer’s order designation. Revenue is recorded net of related discounts and sales tax. Payment from retail customers is generally at the point of sale and payment terms for professional pool operators are based on our credit requirements and generally have terms of less than
We estimate a liability for sales returns based on current sales levels and historical return trends. At each financial reporting date, we assess our estimates of expected returns, and a corresponding adjustment to cost of sales for our right to recover the goods returned by the customer, net of any expected recovery cost. Adjustments related to changes in return estimates were immaterial in all periods presented.
During the last quarter of fiscal 2021, we completed the implementation of our new loyalty program (“Pool Perks”) to all locations which allows members to earn reward points based on their purchases. Once a loyalty member achieves a certain point level, the member earns an award that may be used on future purchases, which are valid for 12 months from issuance. Pool Perks represents a material right to the customer and points may be redeemed on future products and services. We defer revenue related to points earned that have not yet been redeemed. The amount of deferred revenue is based on the estimated standalone selling price of points earned by members and reduced by the percentage of points expected to be redeemed. The estimated redemption percentage is based on historical redemption trends and considers current information or trends. Revenue is recognized when the rewards are redeemed, expired or based on estimated breakage.
Cost of Merchandise and Services Sold
Cost of merchandise and services sold reflects the direct cost of purchased merchandise, costs to package certain chemical products, including direct materials and labor, costs to provide services, including labor and materials, as well as distribution and occupancy costs. Distribution costs include warehousing and transportation expenses, including costs associated with third-party fulfillment centers. Occupancy costs include the rent, common area maintenance, real estate taxes, and depreciation and amortization costs of all retail locations.
Selling, General and Administrative Expenses
Our SG&A includes selling and operating expenses at our retail locations and corporate level general and administrative expenses. Selling and operating expenses at retail locations include payroll, bonus and benefit costs for personnel, supplies, and credit and debit
56
card processing costs. Corporate expenses include payroll, bonus, and benefit costs for our corporate and field support functions, equity-based compensation, marketing and advertising, insurance, utilities, occupancy costs related to our corporate office facilities, professional services, and depreciation and amortization for all assets, except those related to our retail locations and distribution operations, which are included in cost of merchandise and services sold.
Advertising
We expense advertising costs as incurred. Advertising costs for fiscal 2021, 2020 and 2019 were approximately $
Income Taxes
We account for income taxes under the asset and liability method, which requires the recognition of deferred tax assets and liabilities for the future tax consequences attributable to differences between the financial statement carrying amounts and tax bases of existing assets and liabilities. Deferred tax assets, including the benefit of net operating loss and tax credit carryforwards, are evaluated based on the guidelines for realization and are reduced by a valuation allowance if it is deemed more likely than not that such assets will not be realized. We consider several factors in evaluating the realizability of our deferred tax assets, including the nature, frequency and severity of recent losses, the remaining years available for carryforwards, changes in tax laws, the future profitability of the operations in the jurisdiction, and tax planning strategies. Our judgments and estimates concerning realizability of deferred tax assets could change if any of the evaluation factors change, resulting in an increase or decrease to income tax expense in any period.
The ultimate realization of deferred tax assets can be dependent upon the generation of future taxable income during the periods in which the associated temporary differences become deductible. On a quarterly basis, we evaluate whether it is more likely than not that our deferred tax assets will be realized in the future and conclude whether a valuation allowance must be established.
We record a liability for uncertain tax positions to the extent a tax position taken or expected to be taken in a tax return does not meet certain recognition or measurement criteria. Considerable management judgment is necessary to assess the inherent uncertainties related to the interpretations of complex tax laws, regulations and taxing authority rulings. Our judgments and estimates may change as a result of the evaluation of new information, such as the outcome of tax audits or changes to or further interpretations of tax laws and regulations, resulting in an increase or decrease to income tax expense in any period. Interest and penalties accrued, if any, relating to uncertain tax positions will be recognized as a component of the income tax provision.
We determined there were no material uncertain tax positions as of October 2, 2021 and October 3, 2020.
Equity-Based Compensation
Stock-based compensation expense is measured at grant date, based on the fair value of the award, and is recognized on a straight-line basis over the requisite service period for awards expected to vest. See Note 16 - Equity-Based Compensation for further discussion.
Self-Insurance Reserves
Earnings per Share
Basic earnings per share is calculated by dividing net income by the weighted average number of shares outstanding during the period. Dilutive earnings per share is computed giving effect to all potentially dilutive shares, unless their effect is antidilutive. We apply the treasury stock method for dilutive share-based awards. Performance-based share-based awards are included in diluted shares only if the related performance conditions have been considered satisfied as of the end of the reporting period.
57
Recent Accounting Pronouncements
In December 2019, the FASB issued ASU No. 2019-12, Income Taxes (“Topic 740”): Simplifying the Accounting for Income Taxes. ASU 2019-12 removes certain exceptions related to intraperiod tax allocations, foreign subsidiaries and interim reporting that are present within existing GAAP rules. The ASU also provides updated guidance regarding the tax treatment of certain franchise taxes, goodwill and nontaxable entities, among other items. In addition, ASU 2019-12 clarifies that the effect of a change in tax laws or rates should be reflected in the annual effective tax rate computation during the interim period that includes the enactment date. The ASU is effective for annual and interim periods beginning after December 15, 2020. We expect to early adopt ASU 2019-12 as of October 3, 2022. In anticipation of the adoption and based on management’s initial evaluation of the projected impact to our consolidated financial statements, we do not estimate there to be a material impact.
Note 3—Business Combinations
In fiscal 2021, we completed three acquisitions of retailers of supplies and services for hot tubs, swim spas and fireplaces with
These acquisitions did not have a material impact on our financial position or results of operations. Our consolidated financial statements include the results of operations of these acquisitions from the date of acquisition. The total purchase consideration was allocated to the assets acquired and the liabilities assumed at their estimated fair values as of the date of acquisition, as determined by management. The excess of the purchase price over the amounts allocated to assets acquired and liabilities assumed has been recorded as goodwill. The goodwill resulting from these acquisitions is expected to be deductible for income tax purposes. Our estimates and assumptions are subject to change as we gather additional information throughout the measurement period, which is up to 12 months after the acquisition date, and if we make changes to the amounts recorded, such amounts are recorded in the period in which they are identified. No such adjustments were made during fiscal 2021, 2020 or 2019.
Note 4 —Goodwill and Other Intangibles, Net
Goodwill
The carrying amounts of goodwill are as follows (in thousands):
|
|
October 2, 2021 |
|
|
October 3, 2020 |
|
||
Balance at beginning of the year |
|
$ |
|
|
$ |
|
||
Acquisitions |
|
|
|
|
|
|
||
Balance at the end of the year |
|
$ |
|
|
$ |
|
||
58
Other Intangible Assets
Other intangible assets consisted of the following as of October 2, 2021 (in thousands, except weighted average remaining useful life):
|
|
Weighted |
|
|
Gross |
|
|
Accumulated |
|
|
Net |
|
||||
Trade name and trademarks (finite life) |
|
|
|
|
$ |
|
|
$ |
( |
) |
|
$ |
|
|||
Trade name and trademarks (indefinite life) |
|
|
|
|
|
|
|
— |
|
|
|
|
||||
Non-compete agreements |
|
|
|
|
|
|
|
|
( |
) |
|
|
|
|||
Consumer relationships |
|
|
|
|
|
|
|
|
( |
) |
|
|
|
|||
Other intangibles |
|
|
|
|
|
|
|
|
( |
) |
|
|
|
|||
Total |
|
|
|
|
$ |
|
|
$ |
( |
) |
|
$ |
|
|||
Other intangible assets are as follows as of October 3, 2020 (in thousands, except weighted average remaining useful life):
|
|
Weighted |
|
|
Gross |
|
|
Accumulated |
|
|
Net |
|
||||
Trade name and trademarks (finite life) |
|
|
|
|
$ |
|
|
$ |
( |
) |
|
$ |
|
|||
Trade name and trademarks (indefinite life) |
|
|
|
|
|
|
|
— |
|
|
|
|
||||
Non-compete agreements |
|
|
|
|
|
|
|
|
( |
) |
|
|
|
|||
Consumer relationships |
|
|
|
|
|
|
|
|
( |
) |
|
|
|
|||
Other intangibles |
|
|
|
|
|
|
|
|
( |
) |
|
|
|
|||
Total |
|
|
|
|
$ |
|
|
$ |
( |
) |
|
$ |
|
|||
Amortization expense was $
The following table summarizes the estimated future amortization expense related to finite-lived intangible assets on our balance sheet as of October 2, 2021 (in thousands):
|
|
Amount |
|
|
2022 |
|
$ |
|
|
2023 |
|
|
|
|
2024 |
|
|
|
|
2025 |
|
|
|
|
2026 |
|
|
|
|
Thereafter |
|
|
|
|
Total |
|
$ |
|
|
Note 5—Accounts and Other Receivables, Net
Accounts and other receivables, net consisted of the following (in thousands):
|
|
October 2, 2021 |
|
|
October 3, 2020 |
|
||
Vendor and other rebates receivable |
|
$ |
|
|
$ |
|
||
Customer receivables |
|
|
|
|
|
|
||
Other receivables |
|
|
|
|
|
|
||
Allowance for doubtful accounts |
|
|
( |
) |
|
|
( |
) |
Total |
|
$ |
|
|
$ |
|
||
59
Note 6—Inventories, Net
Inventories, net consisted of the following (in thousands):
|
|
October 2, 2021 |
|
|
October 3, 2020 |
|
||
Raw materials |
|
$ |
|
|
$ |
|
||
Finished goods |
|
|
|
|
|
|
||
Inventories |
|
$ |
|
|
$ |
|
||
Changes in inventory excess and obsolescence reserves were as follows (in thousands):
|
|
|
|
|
Additions |
|
|
Deductions |
|
|
|
|
||||
|
|
Balance at Beginning of Period |
|
|
Charged to Costs and Expenses |
|
|
Sale or Disposal of Inventories |
|
|
Balance at |
|
||||
2021 |
|
$ |
|
|
$ |
|
|
$ |
( |
) |
|
$ |
|
|||
2020 |
|
$ |
|
|
$ |
|
|
$ |
( |
) |
|
$ |
|
|||
2019 |
|
$ |
|
|
$ |
|
|
$ |
( |
) |
|
$ |
|
|||
Note 7—Prepaid Expenses and Other Current Assets
Prepaid expenses and other current assets consisted of the following (in thousands):
|
|
October 2, 2021 |
|
|
October 3, 2020 |
|
||
Prepayment for inventory |
|
$ |
— |
|
|
$ |
|
|
Prepaid occupancy costs |
|
|
|
|
|
|
||
Prepaid other |
|
|
|
|
|
|
||
Other current assets |
|
|
|
|
|
|
||
Total |
|
$ |
|
|
$ |
|
||
Note 8—Property and Equipment
Property and equipment consist of the following (in thousands):
|
|
October 2, 2021 |
|
|
October 3, 2020 |
|
||
Land |
|
$ |
|
|
$ |
|
||
Buildings and improvements |
|
|
|
|
|
|
||
Vehicles, machinery and equipment |
|
|
|
|
|
|
||
Leasehold improvements |
|
|
|
|
|
|
||
Office furniture, computers and software |
|
|
|
|
|
|
||
Construction in process |
|
|
|
|
|
|
||
|
|
$ |
|
|
$ |
|
||
Less: accumulated depreciation and amortization |
|
|
( |
) |
|
|
( |
) |
Total |
|
$ |
|
|
$ |
|
||
Depreciation and amortization expense on property and equipment was $
Capitalized software additions placed into service were $
60
Note 9—Accounts Payable and Accrued Expenses
Accounts payable and accrued expenses consisted of the following (in thousands):
|
|
October 2, 2021 |
|
|
October 3, 2020 |
|
||
Accounts payable |
|
$ |
|
|
$ |
|
||
Accrued payroll and employee benefits |
|
|
|
|
|
|
||
Customer deposits |
|
|
|
|
|
|
||
Interest |
|
|
|
|
|
|
||
Inventory related accruals |
|
|
|
|
|
|
||
Loyalty and deferred revenue |
|
|
|
|
|
|
||
Sales taxes |
|
|
|
|
|
|
||
Self-insurance reserves |
|
|
|
|
|
|
||
All other accrued liabilities |
|
|
|
|
|
|
||
Total |
|
$ |
|
|
$ |
|
||
As of October 2, 2021, October 3, 2020, and September 28, 2019, approximately $
Note 10—Long-Term Debt
Our debt obligations consisted of the following (in thousands, except interest rates):
|
|
Effective |
|
|
October 2, 2021 |
|
|
October 3, 2020 |
|
|||
Term Loan—due on March 9, 2028 |
|
|
% |
(2) |
$ |
|
|
$ |
|
|||
ABL Credit Facility |
|
|
% |
(3) |
|
— |
|
|
|
— |
|
|
Senior Unsecured Notes |
|
|
|
|
|
— |
|
|
|
|
||
Total long-term debt |
|
|
|
|
|
|
|
|
|
|||
Less: current portion of long-term debt |
|
|
|
|
|
( |
) |
|
|
( |
) |
|
Less: unamortized discount |
|
|
|
|
|
( |
) |
|
|
( |
) |
|
Less: deferred financing charges |
|
|
|
|
|
( |
) |
|
|
( |
) |
|
Long-term debt, net |
|
|
|
|
$ |
|
|
$ |
|
|||
Term Loan
In March 2021, we entered into an amendment to our Term Loan. The amended Term Loan provides for an $
Borrowings under the Term Loan have an initial applicable rate, at our option of, (i)
Substantially all of our assets are pledged as collateral to secure our indebtedness. The Term Loan does not require us to comply with any financial covenants. The Term Loan contains customary events of default and no event of default had occurred under the Term Loan as of October 2, 2021 or October 3, 2020.
61
ABL Credit Facility
On April 12, 2021, we entered into Amendment No. 5 to our $
In addition, we are also obligated to pay a commission on all outstanding letters of credit as well as customary administrative, issuance, fronting, amendment, payment, and negotiation fees. As of October 2, 2021 and October 3, 2020,
Substantially all of our assets are pledged as collateral to secure our indebtedness The ABL Credit Facility does not require us to comply with any financial covenants. The ABL Credit Facility contains customary events of default, including default upon the nonpayment of principal, interest, fees or other amounts, or the occurrence of a change of control. No event of default has occurred under the ABL Credit Facility as of October 2, 2021 or October 3, 2020.
Senior Unsecured Notes
The senior unsecured notes principal of $
Interest Rate Cap Agreements
In March 2017, we entered into interest rate cap agreements in order to manage the variability of cash flows related to a portion of our floating rate indebtedness. Pursuant to the agreements, we capped
The fair value of our interest rate cap agreements were
Future Debt Maturities
The following table summarizes the debt maturities and scheduled principal repayments of our indebtedness as of October 2, 2021 (in thousands):
|
|
Amount |
|
|
2022 |
|
$ |
|
|
2023 |
|
|
|
|
2024 |
|
|
|
|
2025 |
|
|
|
|
2026 |
|
|
|
|
Thereafter |
|
|
|
|
Total |
|
$ |
|
|
62
Note 11—Leases
Operating Leases
We lease certain locations, office, distribution, and manufacturing facilities under operating leases that expire at various dates through
In April 2020, the Financial Accounting Standards Board issued Staff Q&A - Topic 842 and Topic 840: Accounting For Lease Concessions Related to the Effects of the COVID-19 Pandemic. This guidance provides entities with the option to elect to account for certain lease concessions as though the enforceable rights and obligations had existed in the original lease. As a result, an entity will not need to reassess each existing contract to determine whether enforceable rights and obligations for concessions exist and an entity can elect to apply or not to apply the lease modification guidance in Accounting Standards Codification Topic 842, Leases, to those contracts.
The following table summarizes the components of lease expense (in thousands):
|
|
Year Ended |
|
|||||||||
|
|
October 2, 2021 |
|
|
October 3, 2020 |
|
|
September 28, 2019 |
|
|||
Operating lease expense |
|
$ |
|
|
$ |
|
|
$ |
|
|||
Variable lease expense |
|
|
|
|
|
|
|
|
|
|||
Total net lease expense |
|
$ |
|
|
$ |
|
|
$ |
|
|||
As of October 2, 2021 and October 3, 2020, operating lease right-of-use assets obtained in exchange for operating lease liabilities totaled $
The following table presents the weighted-average remaining lease term and discount rate for operating leases:
|
|
October 2, 2021 |
|
|
October 3, 2020 |
|
||
Weighted-average remaining lease term |
|
|
|
|
|
|
||
Weighted-average discount rate |
|
|
% |
|
|
% |
||
The following table summarizes the future annual minimum lease payments as of October 2, 2021 (in thousands):
|
|
Amount |
|
|
2022 |
|
$ |
|
|
2023 |
|
|
|
|
2024 |
|
|
|
|
2025 |
|
|
|
|
2026 |
|
|
|
|
Thereafter |
|
|
|
|
Total |
|
$ |
|
|
Less: amount of lease payments representing imputed interest |
|
|
|
|
Present value of future minimum lease payments |
|
|
|
|
Less: current operating lease liabilities |
|
|
|
|
Operating lease liabilities, noncurrent |
|
$ |
|
|
63
Note 12—Income Taxes
The provision for income taxes consists of the following (in thousands):
|
|
Year Ended |
|
|||||||||
|
|
October 2, 2021 |
|
|
October 3, 2020 |
|
|
September 28, 2019 |
|
|||
Current: |
|
|
|
|
|
|
|
|
|
|||
Federal |
|
$ |
|
|
$ |
|
|
$ |
|
|||
State |
|
|
|
|
|
|
|
|
|
|||
Total Current |
|
|
|
|
|
|
|
|
|
|||
Deferred: |
|
|
|
|
|
|
|
|
|
|||
Federal |
|
|
|
|
|
( |
) |
|
|
( |
) |
|
State |
|
|
|
|
|
( |
) |
|
|
( |
) |
|
Total Deferred |
|
|
|
|
|
( |
) |
|
|
( |
) |
|
Total income tax provision |
|
$ |
|
|
$ |
|
|
$ |
|
|||
A reconciliation of the provision for income taxes to the amount computed at the federal statutory rate is as follows (in thousands):
|
|
Year Ended |
|
|||||||||
|
|
October 2, 2021 |
|
|
October 3, 2020 |
|
|
September 28, 2019 |
|
|||
Federal income tax at statutory rate |
|
$ |
|
|
$ |
|
|
$ |
|
|||
Equity-based compensation |
|
|
( |
) |
|
|
|
|
|
|
||
Section 162(m) limitation |
|
|
|
|
|
— |
|
|
|
— |
|
|
Permanent differences |
|
|
|
|
|
|
|
|
|
|||
Change in valuation allowance |
|
|
( |
) |
|
|
( |
) |
|
|
|
|
State taxes, net of federal benefit |
|
|
|
|
|
|
|
|
|
|||
Other |
|
|
( |
) |
|
|
( |
) |
|
|
( |
) |
Total income tax provision |
|
$ |
|
|
$ |
|
|
$ |
|
|||
Our effective rate for fiscal 2021 was
The tax effects of temporary differences that give rise to significant portions of deferred tax assets and liabilities are summarized below (in thousands):
|
|
October 2, 2021 |
|
|
October 3, 2020 |
|
||
Deferred tax assets: |
|
|
|
|
|
|
||
Compensation accruals |
|
$ |
|
|
$ |
|
||
Inventory |
|
|
— |
|
|
|
|
|
Interest limitation |
|
|
— |
|
|
|
|
|
Lease liabilities |
|
|
|
|
|
|
||
Equity-based compensation |
|
|
|
|
|
— |
|
|
Reserves and other accruals |
|
|
|
|
|
|
||
Total deferred tax assets |
|
|
|
|
|
|
||
Deferred tax liabilities: |
|
|
|
|
|
|
||
Property, plant, and equipment |
|
|
( |
) |
|
|
( |
) |
Intangibles |
|
|
( |
) |
|
|
( |
) |
Lease assets |
|
|
( |
) |
|
|
( |
) |
Deferred financing cost |
|
|
( |
) |
|
|
( |
) |
Other |
|
|
( |
) |
|
|
— |
|
Total deferred tax liabilities |
|
|
( |
) |
|
|
( |
) |
Valuation allowance |
|
|
|
|
|
( |
) |
|
Deferred tax assets (liabilities), net |
|
$ |
|
|
$ |
|
||
64
Valuation Allowance consists of the following (in thousands):
|
|
Balance at |
|
|
Additions |
|
|
Deductions |
|
|
Balance at End |
|
||||
2021 |
|
$ |
|
|
$ |
— |
|
|
$ |
( |
) |
|
$ |
— |
|
|
2020 |
|
$ |
|
|
$ |
— |
|
|
$ |
( |
) |
|
$ |
|
||
Management assesses the available positive and negative evidence to estimate if sufficient future taxable income will be generated to utilize the existing deferred tax assets. The interest expense limitation passed in the CARES Act created a deferred tax asset for the fiscal year ended October 3, 2020 that we did not anticipate realizing in the immediate future; as a result, a valuation allowance was recorded. The valuation allowance was removed during the first quarter of fiscal 2021 due to the Company’s paydown of debt with proceeds from the IPO, which decreased interest expense.
We are subject to United States federal and state taxes in the normal course of business and our income tax returns are subject to examination by the relevant tax authorities. We are no longer subject to United States federal examinations by taxing authorities for calendar years before 2018 and are no longer subject to state examinations for calendar years before 2017.
We have not identified any material uncertain tax positions.
Note 13—Commitments & Contingencies
Contingencies
We are defendants in lawsuits or potential claims encountered in the normal course of business. When the potential liability from a matter can be estimated and the loss is considered probable, we record the estimated loss. Due to uncertainties related to the resolution of lawsuits, investigations and claims, the ultimate outcome may differ from the estimates. We do not expect that the resolutions of any of these matters will have a material effect to our consolidated financial position or results of operations. We did not record any material loss contingencies as of October 2, 2021, October 3, 2020, and June 27, 2020.
Our workers’ compensation insurance program, general liability insurance program, and employee group medical plan have self-insurance retention features of up to $ per event as of October 2, 2021 and October 3, 2020. We had standby letters of credit outstanding in the amounts of $
Purchase Commitments
In addition to our lease obligations, we maintain future purchase commitments related to inventory and operational requirements.
The following table summarizes the future minimum purchase commitments as of October 2, 2021 (in thousands):
|
|
Amount |
|
|
2022 |
|
$ |
|
|
2023 |
|
|
|
|
2024 |
|
|
|
|
2025 |
|
|
|
|
2026 |
|
|
|
|
Thereafter |
|
|
— |
|
Total |
|
$ |
|
|
Note 14—401(K) Plan
We provide for the benefit of our employees a voluntary defined contribution retirement plan under Section of the Internal Revenue Code. The plan covers all eligible employees and provides for a matching contribution by us of
65
Note 15—Related Party Transactions
In February 2017, we entered into a management services agreement with our private equity sponsors in connection with our acquisition in February 2017. The management services agreement provides that we will pay an annual fee for them to provide management and advisory services to us and our affiliates, including general management consulting services, support and analysis with respect to financing alternatives and strategic planning functions. The management services agreement terminated in October 2020 in connection with the completion of our IPO. During fiscal 2020 and 2019, we paid or accrued management fees in the amount of $
Note 16—Equity-Based Compensation
Equity-Based Compensation
2020 Omnibus Incentive Plan
In October 2020, we adopted the Leslie’s, Inc. 2020 Omnibus Incentive Plan (the “Plan”). The Plan provides for the grant of awards such as stock options to purchase Leslie’s common stock (each, a “Stock Option”) and restricted stock units (“RSUs”) which may settle in Leslie’s, Inc. common stock to our directors, executives and eligible employees of the Company. Stock Options granted under the Plan generally expire
As of October 2, 2021, the aggregate unamortized value of all outstanding equity-based compensation awards, excluding equity-based compensation expense associated with Performance Stock Options which have not yet been issued for accounting purposes, was approximately $
Stock Options
The fair value of each non-qualified stock option (“Stock Option”) granted is estimated on the grant date using the Black-Scholes option pricing model. The expected life is based on the SEC simplified method and a mid-point assumption. Expected price volatility is determined based on the implied volatilities of comparable companies over a historical period that matches the expected life of the Stock Options. The risk-free interest rate is based on the expected United States Treasury rate over the expected life. The dividend yield is based on the expectation that
The following table summarizes the weighted average assumptions used for Stock Options for the fiscal year ended:
|
|
October 2, 2021 |
|
|
Expected volatility |
|
|
% |
|
Risk-free interest rate |
|
|
% |
|
Dividend yield |
|
|
% |
|
Expected term (in years) |
|
|
|
|
The following tables summarizes our Stock Option activity under the Plan for the fiscal year ended (in thousands, except per share amounts):
|
|
October 2, 2021 |
|
|
|||||
|
|
Number of Options |
|
|
Weighted Average Exercise Price |
|
|
||
Outstanding, Beginning |
|
|
— |
|
|
$ |
— |
|
|
Granted |
|
|
|
|
|
|
|
||
Exercised |
|
|
— |
|
|
|
— |
|
|
Cancelled/forfeited |
|
|
( |
) |
|
|
|
|
|
Balance, Ending |
|
|
|
|
$ |
|
|
||
|
|
|
|
|
|
|
|
||
66
|
|
As of October 2, 2021 |
|
|
Aggregate intrinsic value of options outstanding |
|
$ |
|
|
Unamortized value of unvested stock options |
|
$ |
|
|
Weighted average period (years) that expense is expected to be recognized |
|
|
|
|
Weighted average remaining contractual life (years) for options outstanding |
|
|
|
|
There were
Restricted Stock Units
The following table summarizes our RSU activity under the Plan for the fiscal year ended (in thousands, except per share amounts):
|
|
October 2, 2021 |
|
|||||
|
|
Number of RSUs |
|
|
Weighted Average |
|
||
Outstanding, Beginning |
|
|
— |
|
|
$ |
— |
|
Converted from Incentive Awards (1) |
|
|
|
|
|
|
||
Granted |
|
|
|
|
|
|
||
Vested |
|
|
( |
) |
|
|
|
|
Cancelled/forfeited |
|
|
( |
) |
|
|
|
|
Balance, Ending |
|
|
|
|
$ |
|
||
|
|
|
|
|
|
|
||
|
|
As of October 2, 2021 |
|
|
Unamortized value of unvested RSUs |
|
$ |
|
|
Weighted average period (years) expense is expected to be recognized |
|
|
|
|
In connection with the IPO, we issued RSUs that vest only upon achievement of volume weighted average price (“VWAP”) targets established by the compensation committee of the board of directors (Performance RSUs). The VWAP target was measured over rolling
Incentive Grant Agreements
Prior to the IPO, our then parent company granted profits interests to our employees (“Incentive Awards”) through incentive unit grant agreements (“Incentive Agreements”). The Incentive Awards had economic characteristics similar to stock options and had the right to share in the appreciation of the equity value of our then parent company. The sole asset of our then parent company was indirect ownership of Leslie’s, Inc. We concluded such Incentive Awards were classified as equity awards. The Incentive Awards were spread over two tiers, a service-based (time) award tier (“Service Incentive Awards”) and a performance-based award tier (“Performance Incentive Awards”). The Service Incentive Awards vested over a
The fair value of the Incentive Awards was estimated on the date of grant using the Black-Scholes option pricing model, which treated the Incentive Unit Grant Agreements as implicit call options with exercise prices determined based on their respective rights to participate in distributions. The Black-Scholes option pricing model required the use of a number of assumptions, including expected volatility, risk-free interest rate, expected dividends, and expected term.
67
The following table summarizes the assumptions and fair value used for Incentive Awards in each of the fiscal years ended:
|
|
October 3, 2020 |
|
|
September 28, 2019 |
|
||
Expected volatility |
|
|
% |
|
|
% |
||
Risk-free interest rate |
|
|
% |
|
|
% |
||
Dividend yield |
|
|
% |
|
|
% |
||
Expected term (in years) |
|
|
|
|
|
|
||
The following tables summarizes our Incentive Awards activity (in thousands, except per share amounts):
|
|
October 2, 2021 |
|
October 3, 2020 |
|
|
September 28, 2019 |
|
||||||||||||||
|
|
Number of Awards |
|
|
Weighted Average Exercise Price |
|
Number of Awards |
|
|
Weighted Average Exercise Price |
|
|
Number of Awards |
|
|
Weighted Average Exercise Price |
|
|||||
Outstanding, Beginning |
|
|
|
|
|
|
|
|
|
|
|
|
|
|
|
|
|
|||||
Cancelled upon IPO |
|
|
( |
) |
|
|
|
|
— |
|
|
|
|
|
|
— |
|
|
|
|
||
Converted to RSUs |
|
|
( |
) |
|
|
|
|
— |
|
|
|
|
|
|
— |
|
|
|
|
||
Granted |
|
|
— |
|
|
|
|
|
|
|
$ |
|
|
|
|
|
$ |
|
||||
Exercised |
|
|
— |
|
|
|
|
|
— |
|
|
|
|
|
|
— |
|
|
|
|
||
Cancelled/forfeited |
|
|
— |
|
|
|
|
|
( |
) |
|
|
|
|
|
( |
) |
|
|
|
||
Balance, Ending |
|
|
— |
|
|
|
|
|
|
|
|
|
|
|
|
|
|
|
||||
In fiscal 2021, equity-based compensation expense totaled $
Note 17—Earnings Per Share
The following is a reconciliation of basic weighted average common shares outstanding to diluted weighted average common shares outstanding (in thousands):
|
|
Year Ended |
|
|||||||||
|
|
October 2, 2021 |
|
|
October 3, 2020 |
|
|
September 28, 2019 |
|
|||
Numerator: |
|
|
|
|
|
|
|
|
|
|||
Net income |
|
$ |
|
|
$ |
|
|
$ |
|
|||
Denominator: |
|
|
|
|
|
|
|
|
|
|||
Weighted average shares outstanding - basic |
|
|
|
|
|
|
|
|
|
|||
Effect of dilutive securities: |
|
|
|
|
|
|
|
|
|
|||
Stock options |
|
|
|
|
|
— |
|
|
|
— |
|
|
RSUs |
|
|
|
|
|
— |
|
|
|
— |
|
|
Weighted average shares outstanding - diluted |
|
|
|
|
|
|
|
|
|
|||
|
|
|
|
|
|
|
|
|
|
|||
Basic earnings per share |
|
$ |
|
|
$ |
|
|
$ |
|
|||
Diluted earnings per share |
|
$ |
|
|
$ |
|
|
$ |
|
|||
The following number of weighted-average potentially dilutive shares were excluded from the calculation of diluted net income per share because the effect of including such shares would have been antidilutive (in thousands):
|
|
Year Ended |
|
|||||||||
|
|
October 2, 2021 |
|
|
October 3, 2020 |
|
|
September 28, 2019 |
|
|||
Stock options |
|
|
|
|
|
— |
|
|
|
— |
|
|
RSUs |
|
|
|
|
|
— |
|
|
|
— |
|
|
|
|
|
|
|
|
— |
|
|
|
— |
|
|
68
Note 18—Subsequent Events
On December 3, 2021, the Board of Directors authorized a share repurchase program for up to an aggregate amount of $
69
Item 9. Changes in and Disagreements With Accountants on Accounting and Financial Disclosure.
None.
Item 9A. Controls and Procedures.
Management’s Evaluation of Disclosure Controls and Procedures
Our disclosure controls and procedures (as defined in Rules 13a-15(e) and 15d-15(e)) are designed to ensure that information required to be disclosed by us in reports we file or submit under the Securities Exchange Act of 1934, as amended, is recorded, processed, summarized and reported within the appropriate time periods specified in SEC rules and forms, and that such information is accumulated and communicated to our management, including our Chief Executive Officer and Chief Financial Officer, as appropriate, to allow timely discussions regarding required disclosure. We, under the supervisions of and with the participation of our management, including our Chief Executive Officer and Chief Financial Officer, have evaluated the effectiveness of our disclosure controls and procedures. Based on that evaluation, our Chief Executive Officer and Chief Financial Officer have concluded that the design and operation of our disclosure controls and procedures were effective as of the end of the period covered by this Annual Report on Form 10-K.
Management’s Report on Internal Control over Financial Reporting
Management is responsible for establishing and maintaining adequate internal control over financial reporting, as defined in Rule 13a-15(f) of the 1934 Act. Management has assessed the effectiveness of our internal control over financial reporting the end of the period covered by this Annual Report on Form 10-K based on criteria established in Internal Control — Integrated Framework (2013) issued by the Committee of Sponsoring Organizations of the Treadway Commission. As a result of this assessment, management concluded that, at the end of the period covered by this Annual Report on Form 10-K, our internal control over financial reporting was effective in providing reasonable assurance regarding the reliability of financial reporting and the preparation of financial statements for external purposes in accordance with generally accepted accounting principles.
Changes in Internal Control over Financial Reporting
There were no changes in our internal control over financial reporting during the quarter ended October 2, 2021 that materially affected, or are reasonably likely to materially affect, our internal control over financial reporting.
Item 9B. Other Information.
None.
Item 9C. Disclosure Regarding Foreign Jurisdictions that Prevent Inspections.
Not applicable.
70
PART III
Item 10. Directors, Executive Officers and Corporate Governance.
Information responsive to this item is incorporated herein by reference to our Proxy Statement with respect to our 2022 Annual Meeting of Stockholders to be filed with the SEC within 120 days after the end of our fiscal year covered by this Annual Report on Form 10-K.
We have adopted a Code of Ethics that applies to all of our directors, officers, and employees, including our principal executive, principal financial, and principal accounting officers, or persons performing similar functions. Our Code of Ethics is posted on our website located on the investor relations page of our website at www.lesliespool.com. We intend to disclose future amendments to certain provisions of the Code of Ethics, and waivers of the Code of Ethics granted to executive officers and directors, on the website within four business days following the date of the amendment or waiver.
Item 11. Executive Compensation.
Information responsive to this item is incorporated herein by reference to our Proxy Statement with respect to our 2022 Annual Meeting of Stockholders to be filed with the SEC within 120 days after the end of our fiscal year covered by this Annual Report on Form 10-K.
Item 12. Security Ownership of Certain Beneficial Owners and Management and Related Stockholder Matters.
Information responsive to this item is incorporated herein by reference to our Proxy Statement with respect to our 2022 Annual Meeting of Stockholders to be filed with the SEC within 120 days after the end of our fiscal year covered by this Annual Report on Form 10-K.
Information responsive to this item is incorporated herein by reference to our Proxy Statement with respect to our 2022 Annual Meeting of Stockholders to be filed with the SEC within 120 days after the end of our fiscal year covered by this Annual Report on Form 10-K.
Item 14. Principal Accountant Fees and Services.
Information responsive to this item is incorporated herein by reference to our Proxy Statement with respect to our 2022 Annual Meeting of Stockholders to be filed with the SEC within 120 days after the end of our fiscal year covered by this Annual Report on Form 10-K.
71
PART IV
Item 15. Exhibits, Financial Statements Schedules.
|
|
|
|
Incorporated by Reference |
||||
Exhibit Number |
|
Exhibit Description |
|
Form |
|
Exhibit |
|
Filing Date/ Period End Date |
3.1 |
|
Fifth Amended and Restated Certificate of Incorporation, effective as of November 2, 2020 |
|
8-K |
|
3.1 |
|
11/2/2020 |
3.2 |
|
Amended and Restated Bylaws, effective as of November 2, 2020 |
|
8-K |
|
3.2 |
|
11/2/2020 |
4.1 |
|
|
S-1/A |
|
4.1 |
|
10/22/2020 |
|
4.2 |
|
|
S-1/A |
|
4.2 |
|
10/22/2020 |
|
4.3 |
|
|
S-1/A |
|
4.3 |
|
10/22/2020 |
|
4.4 |
|
|
S-1/A |
|
4.4 |
|
10/28/2020 |
|
4.5 |
|
|
S-1 |
|
4.5 |
|
2/8/2021 |
|
4.6 |
|
|
S-1 |
|
4.6 |
|
6/7/2021 |
|
4.7 |
|
|
8-K |
|
4.1 |
|
10/26/2021 |
|
4.8 |
|
Description of Securities Registered under Section 12 of the Securities Exchange Act of 1934 |
|
10-K |
|
4.5 |
|
12/23/2020 |
10.1# |
|
Form of Indemnification Agreement between Leslie’s, Inc. and its directors and officers |
|
S-1/A |
|
10.1 |
|
10/22/2020 |
10.2# |
|
|
S-1/A |
|
10.2 |
|
10/22/2020 |
|
10.3# |
|
Form of Stock Option Agreement pursuant to 2020 Omnibus Incentive Plan |
|
S-1/A |
|
10.3 |
|
10/22/2020 |
10.4# |
|
|
S-1/A |
|
10.4 |
|
10/22/2020 |
|
10.5# |
|
|
S-1/A |
|
10.5 |
|
10/22/2020 |
|
10.6# |
|
|
S-1/A |
|
10.6 |
|
10/22/2020 |
|
10.7# |
|
|
S-1/A |
|
10.7 |
|
10/22/2020 |
|
10.8# |
|
Offer Letter, dated as of October 11, 2019, by and between Leslie’s Poolmart, Inc. and Paula Baker |
|
S-1/A |
|
10.8 |
|
10/22/2020 |
10.9# |
|
Severance Plan, dated as of March 3, 2020, by and between Leslie’s Poolmart, Inc. and Paula Baker |
|
S-1/A |
|
10.9 |
|
10/22/2020 |
10.10# |
|
|
S-1/A |
|
10.10 |
|
10/22/2020 |
|
72
10.11# |
|
|
S-1/A |
|
10.11 |
|
10/22/2020 |
|
10.12# |
|
|
S-1/A |
|
10.12 |
|
10/22/2020 |
|
10.13 |
|
|
S-1/A |
|
10.13 |
|
10/22/2020 |
|
10.14 |
|
|
S-1/A |
|
10.14 |
|
10/22/2020 |
|
10.15 |
|
|
S-1/A |
|
10.15 |
|
10/22/2020 |
|
10.16 |
|
|
S-1/A |
|
10.16 |
|
10/22/2020 |
|
10.17 |
|
|
S-1/A |
|
10.17 |
|
10/22/2020 |
|
10.18 |
|
|
S-1/A |
|
10.18 |
|
10/22/2020 |
|
10.19 |
|
|
S-1/A |
|
10.19 |
|
10/22/2020 |
|
10.20 |
|
|
S-1/A |
|
10.20 |
|
10/22/2020 |
|
10.21 |
|
|
10-Q |
|
10.2 |
|
5/10/2021 |
|
10.22 |
|
|
8-K |
|
10.1 |
|
3/10/2021 |
|
21.1* |
|
|
|
|
|
|
|
|
23.1* |
|
|
|
|
|
|
|
|
24.1* |
|
Power of Attorney (included on signature page on this Annual Report on Form 10-K) |
|
|
|
|
|
|
31.1* |
|
|
|
|
|
|
|
|
31.2* |
|
|
|
|
|
|
|
|
32.1+ |
|
Certification of Principal Executive Officer Pursuant to 18 U.S.C. Section 1350 |
|
|
|
|
|
|
73
32.2+ |
|
Certification of Principal Financial Officer Pursuant to 18 U.S.C. Section 1350 |
|
|
|
|
|
|
101.INS* |
|
Inline XBRL Instance Document |
|
|
|
|
|
|
101.SCH* |
|
Inline XBRL Schema Document |
|
|
|
|
|
|
101.CAL* |
|
Inline XBRL Calculation Linkbase Document |
|
|
|
|
|
|
101.LAB* |
|
Inline XBRL Label Linkbase Document |
|
|
|
|
|
|
101.PRE* |
|
Inline XBRL Presentation Linkbase Document |
|
|
|
|
|
|
101.DEF* |
|
Inline XBRL Definition Linkbase Document |
|
|
|
|
|
|
104* |
|
The cover page from the Company’s Annual Report on Form 10-K for the year ended October 2, 2021, formatted in Inline XBRL (included as Exhibit 101) |
|
|
|
|
|
|
* Filed herewith.
# Indicates a management contract or compensatory plan or arrangement.
+ Furnished herewith and not deemed to be “filed” for purposes of Section 18 of the Securities Exchange Act of 1934, as amended, and shall not be deemed to be incorporated by reference into any filing under the Securities Act of 1933, as amended, or the Securities Exchange Act of 1934, as amended.
Item 16. Form 10-K Summary
None.
74
SIGNATURES
Pursuant to the requirements of Section 13 or 15(d) of the Securities Exchange Act of 1934, as amended, the Registrant has duly caused this Report to be signed on its behalf by the undersigned, thereunto duly authorized.
|
|
LESLIE’S, INC. |
|
|
|
|
|
Date: December 10, 2021 |
|
By: |
/s/ Michael R. Egeck |
|
|
|
Michael R. Egeck |
|
|
|
Chief Executive Officer |
|
|
|
(Principal Executive Officer) |
Pursuant to the requirements of the Securities Exchange Act of 1934, as amended, this Report has been signed below by the following persons on behalf of the Registrant in the capacities and on the dates indicated.
Name |
|
Title |
|
Date |
|
|
|
|
|
/s/ Steven L. Ortega |
|
Chairman |
|
December 10, 2021 |
Steven L. Ortega |
|
|
|
|
|
|
|
|
|
/s/ Michael R. Egeck |
|
Chief Executive Officer (Principal Executive Officer) and Director |
|
December 10, 2021 |
Michael R. Egeck |
|
|
|
|
|
|
|
|
|
/s/ Steven M. Weddell |
|
Executive Vice President and Chief Financial Officer (Principal Financial Officer and Principal Accounting Officer) |
|
December 10, 2021 |
Steven M. Weddell |
|
|
|
|
|
|
|
|
|
/s/ Yolanda Daniel |
|
Director |
|
December 10, 2021 |
Yolanda Daniel |
|
|
|
|
|
|
|
|
|
/s/ Jodeen Kozlak |
|
Director |
|
December 10, 2021 |
Jodeen Kozlak |
|
|
|
|
|
|
|
|
|
/s/ Eric Kufel |
|
Director |
|
December 10, 2021 |
Eric Kufel |
|
|
|
|
|
|
|
|
|
/s/ Marc Magliacano |
|
Director |
|
December 10, 2021 |
Marc Magliacano |
|
|
|
|
|
|
|
|
|
/s/ Susan O'Farrell |
|
Director |
|
December 10, 2021 |
Susan O'Farrell |
|
|
|
|
|
|
|
|
|
/s/ James R. Ray, Jr. |
|
Director |
|
December 10, 2021 |
James R. Ray, Jr. |
|
|
|
|
|
|
|
|
|
/s/ John Strain |
|
Director |
|
December 10, 2021 |
John Strain |
|
|
|
|
75