false0001821806FY1P5Yhttp://fasb.org/us-gaap/2025#OtherLiabilitiesNoncurrenthttp://fasb.org/us-gaap/2025#QualifiedPlanMember369.150135.181http://fasb.org/srt/2025#ChiefExecutiveOfficerMember0001821806us-gaap:EmployeeStockOptionMember2023-10-012024-09-2800018218062023-09-300001821806us-gaap:SubsequentEventMember2025-12-012025-12-010001821806us-gaap:RetainedEarningsMember2023-10-012024-09-280001821806us-gaap:PrepaidExpensesAndOtherCurrentAssetsMemberlesl:CloudComputingArrangementsMember2025-10-040001821806srt:MaximumMemberus-gaap:BuildingAndBuildingImprovementsMember2025-10-040001821806us-gaap:PrepaidExpensesAndOtherCurrentAssetsMemberlesl:CloudComputingArrangementsMember2024-09-280001821806us-gaap:DomesticCountryMember2024-09-280001821806us-gaap:OtherIntangibleAssetsMember2025-10-0400018218062024-09-292025-10-040001821806lesl:VehiclesMachineryAndEquipmentMembersrt:MaximumMember2025-10-040001821806us-gaap:TrademarksAndTradeNamesMember2024-09-280001821806us-gaap:ConstructionInProgressMember2024-09-280001821806us-gaap:PerformanceSharesMembersrt:MinimumMember2023-10-012024-09-280001821806us-gaap:RetainedEarningsMember2022-10-022023-09-300001821806lesl:TrademarksAndTradeNameMember2025-10-040001821806lesl:TrademarksAndTradeNameMember2024-09-292025-10-040001821806lesl:OfficeFurnitureComputersAndSoftwareMember2025-10-040001821806us-gaap:SecuredOvernightFinancingRateSofrOvernightIndexSwapRateMemberus-gaap:DebtInstrumentRedemptionPeriodOneMember2023-06-012023-06-300001821806us-gaap:OperatingSegmentsMember2024-09-292025-10-040001821806us-gaap:WorkersCompensationInsuranceMember2024-09-2800018218062024-09-280001821806us-gaap:SecuredOvernightFinancingRateSofrOvernightIndexSwapRateMemberlesl:TermLoanMemberlesl:ApplicableRateMember2023-06-012023-06-300001821806srt:MinimumMember2025-10-040001821806us-gaap:RetainedEarningsMember2024-09-280001821806us-gaap:CommonStockMember2024-09-280001821806us-gaap:AdditionalPaidInCapitalMember2022-10-010001821806lesl:TermLoanMember2023-06-3000018218062024-08-310001821806us-gaap:DebtInstrumentRedemptionPeriodThreeMemberus-gaap:SecuredOvernightFinancingRateSofrOvernightIndexSwapRateMember2023-06-012023-06-300001821806us-gaap:RestrictedStockUnitsRSUMember2023-10-012024-09-280001821806us-gaap:AdditionalPaidInCapitalMember2023-09-300001821806lesl:VehiclesMachineryAndEquipmentMember2024-09-280001821806us-gaap:RetainedEarningsMember2023-09-300001821806us-gaap:SecuredOvernightFinancingRateSofrOvernightIndexSwapRateMemberus-gaap:RevolvingCreditFacilityMember2023-03-012023-03-310001821806us-gaap:RevolvingCreditFacilityMemberus-gaap:InterestRateFloorMember2023-03-012023-03-310001821806us-gaap:WorkersCompensationInsuranceMember2025-10-040001821806us-gaap:EmployeeStockOptionMember2024-09-292025-10-040001821806us-gaap:PerformanceSharesMembersrt:MaximumMember2024-09-292025-10-040001821806lesl:ABRMemberlesl:FirstLienLeverageRatioLessThanOrEqualToTwoPointSevenFiveToOneMemberlesl:TermLoanMemberlesl:ApplicableRateMember2023-06-012023-06-300001821806us-gaap:EmployeeStockOptionMember2023-10-012024-09-280001821806us-gaap:SellingGeneralAndAdministrativeExpensesMember2024-09-292025-10-040001821806us-gaap:SellingGeneralAndAdministrativeExpensesMember2023-10-012024-09-280001821806us-gaap:LeaseholdImprovementsMember2024-09-280001821806us-gaap:NoncompeteAgreementsMember2024-09-280001821806lesl:TermLoanMember2024-09-280001821806us-gaap:RevolvingCreditFacilityMember2023-03-012023-03-3100018218062024-08-012024-08-310001821806us-gaap:CommonStockMember2025-10-040001821806us-gaap:AdditionalPaidInCapitalMember2025-10-040001821806us-gaap:SecuredOvernightFinancingRateSofrOvernightIndexSwapRateMemberus-gaap:RevolvingCreditFacilityMembersrt:MaximumMember2023-03-012023-03-310001821806us-gaap:RevolvingCreditFacilityMember2025-10-0400018218062022-10-022023-09-3000018218062023-10-012024-09-280001821806us-gaap:LeaseholdImprovementsMembersrt:MaximumMember2025-10-040001821806lesl:FirstLienLeverageRatioLessThanOrEqualToTwoPointSevenFiveToOneMemberlesl:TermLoanMembersrt:MinimumMember2023-06-012023-06-300001821806us-gaap:EmployeeStockOptionMember2022-10-022023-09-300001821806us-gaap:SecuredOvernightFinancingRateSofrOvernightIndexSwapRateMemberlesl:ABLCreditFacilityMembersrt:MinimumMember2024-09-292025-10-040001821806srt:MinimumMemberus-gaap:BuildingAndBuildingImprovementsMember2025-10-040001821806us-gaap:BaseRateMemberlesl:ABLCreditFacilityMembersrt:MaximumMember2024-09-292025-10-040001821806us-gaap:SecuredOvernightFinancingRateSofrOvernightIndexSwapRateMemberlesl:TermLoanMemberlesl:ApplicableRateMemberlesl:FirstLienLeverageRatioGreaterThanTwoPointSevenFiveToOneHundredMember2023-06-012023-06-300001821806us-gaap:CustomerRelationshipsMember2025-10-040001821806us-gaap:AdditionalPaidInCapitalMember2022-10-022023-09-300001821806us-gaap:EmployeeStockOptionMember2025-10-040001821806us-gaap:EmployeeStockOptionMember2023-09-300001821806us-gaap:TrademarksAndTradeNamesMember2025-10-0400018218062022-10-010001821806us-gaap:LandMember2025-10-040001821806us-gaap:AdditionalPaidInCapitalMember2024-09-280001821806us-gaap:OtherAssetsMemberlesl:CloudComputingArrangementsMember2024-09-280001821806us-gaap:RevolvingCreditFacilityMember2024-09-280001821806lesl:RestrictedStockUnitsAndPerformanceUnitsMember2025-10-040001821806us-gaap:RevolvingCreditFacilityMember2023-03-310001821806us-gaap:BuildingAndBuildingImprovementsMember2025-10-040001821806us-gaap:RetainedEarningsMember2025-10-040001821806lesl:RestrictedStockUnitsAndPerformanceUnitsMember2024-09-280001821806lesl:TermLoanDueInTwentyTwentyEightMemberus-gaap:FairValueInputsLevel2Member2024-09-280001821806us-gaap:SecuredOvernightFinancingRateSofrOvernightIndexSwapRateMembersrt:MinimumMemberlesl:TermLoanMember2024-09-292025-10-040001821806us-gaap:SecuredOvernightFinancingRateSofrOvernightIndexSwapRateMembersrt:MinimumMemberlesl:TermLoanMember2025-10-040001821806us-gaap:OtherAssetsMemberlesl:CloudComputingArrangementsMember2025-10-0400018218062025-12-050001821806us-gaap:CommonStockMember2023-09-3000018218062025-10-040001821806us-gaap:BuildingAndBuildingImprovementsMember2024-09-280001821806us-gaap:SubsequentEventMember2025-11-250001821806us-gaap:PerformanceSharesMembersrt:MaximumMember2023-10-012024-09-280001821806us-gaap:CommonStockMember2022-10-022023-09-300001821806lesl:RestrictedStockUnitsAndPerformanceUnitsMember2023-10-012024-09-280001821806us-gaap:SecuredOvernightFinancingRateSofrOvernightIndexSwapRateMemberlesl:TermLoanMembersrt:MaximumMember2025-10-040001821806lesl:TrademarksAndTradeNameMember2024-09-280001821806us-gaap:EmployeeStockOptionMember2024-09-292025-10-040001821806lesl:EquipmentUnderFinanceLeaseMember2024-09-280001821806lesl:EquipmentUnderFinanceLeaseMember2025-10-040001821806us-gaap:EmployeeStockOptionMember2024-09-280001821806us-gaap:CustomerRelationshipsMember2024-09-280001821806us-gaap:OperatingSegmentsMember2022-10-022023-09-300001821806us-gaap:RetainedEarningsMember2022-10-0100018218062025-03-280001821806us-gaap:RestrictedStockUnitsRSUMember2024-09-292025-10-040001821806us-gaap:AdditionalPaidInCapitalMember2023-10-012024-09-280001821806srt:MinimumMemberlesl:OfficeFurnitureComputersAndSoftwareMember2025-10-040001821806us-gaap:BaseRateMemberlesl:ABLCreditFacilityMembersrt:MinimumMember2024-09-292025-10-040001821806us-gaap:RevolvingCreditFacilityMember2024-04-032024-04-030001821806lesl:ABRMemberlesl:TermLoanMemberlesl:ApplicableRateMemberlesl:FirstLienLeverageRatioGreaterThanTwoPointSevenFiveToOneHundredMember2023-06-012023-06-3000018218062024-10-052025-10-040001821806lesl:TermLoanMember2023-06-012023-06-300001821806lesl:OfficeFurnitureComputersAndSoftwareMember2024-09-280001821806lesl:TermLoanMembersrt:MinimumMemberlesl:FirstLienLeverageRatioGreaterThanTwoPointSevenFiveToOneHundredMember2023-06-012023-06-300001821806us-gaap:RetainedEarningsMember2024-09-292025-10-040001821806us-gaap:CommonStockMember2022-10-010001821806us-gaap:NoncompeteAgreementsMember2025-10-040001821806us-gaap:DebtInstrumentRedemptionPeriodTwoMemberus-gaap:SecuredOvernightFinancingRateSofrOvernightIndexSwapRateMember2023-06-012023-06-300001821806lesl:RestrictedStockUnitsAndPerformanceUnitsMember2024-09-292025-10-040001821806lesl:OfficeFurnitureComputersAndSoftwareMembersrt:MaximumMember2025-10-040001821806us-gaap:StateAndLocalJurisdictionMember2025-10-040001821806us-gaap:SecuredOvernightFinancingRateSofrOvernightIndexSwapRateMemberus-gaap:RevolvingCreditFacilityMembersrt:MinimumMember2023-03-012023-03-310001821806us-gaap:SecuredOvernightFinancingRateSofrOvernightIndexSwapRateMemberlesl:FirstLienLeverageRatioLessThanOrEqualToTwoPointSevenFiveToOneMemberlesl:TermLoanMemberlesl:ApplicableRateMember2023-06-012023-06-300001821806srt:MinimumMemberlesl:VehiclesMachineryAndEquipmentMember2025-10-040001821806us-gaap:ConstructionInProgressMember2025-10-040001821806us-gaap:LeaseholdImprovementsMember2025-10-040001821806us-gaap:LandMember2024-09-280001821806us-gaap:PerformanceSharesMember2024-09-292025-10-040001821806us-gaap:BaseRateMemberus-gaap:RevolvingCreditFacilityMembersrt:MaximumMember2023-03-012023-03-310001821806us-gaap:OperatingSegmentsMember2023-10-012024-09-280001821806us-gaap:CommonStockMember2023-10-012024-09-280001821806us-gaap:CommonStockMember2024-09-292025-10-040001821806us-gaap:PerformanceSharesMember2023-10-012024-09-280001821806us-gaap:BaseRateMemberus-gaap:RevolvingCreditFacilityMembersrt:MinimumMember2023-03-012023-03-310001821806us-gaap:RestrictedStockUnitsRSUMember2022-10-022023-09-300001821806us-gaap:SecuredOvernightFinancingRateSofrOvernightIndexSwapRateMemberlesl:ABLCreditFacilityMembersrt:MaximumMember2024-09-292025-10-040001821806us-gaap:OtherIntangibleAssetsMember2024-09-280001821806lesl:TermLoanMember2025-10-040001821806lesl:GeneralLiabilityInsuranceProgramMembersrt:MaximumMember2025-10-040001821806lesl:RestrictedStockUnitsAndPerformanceUnitsMember2023-09-300001821806lesl:FirstLienLeverageRatioLessThanOrEqualToTwoPointSevenFiveToOneMemberlesl:TermLoanMembersrt:MaximumMember2023-06-012023-06-300001821806us-gaap:PerformanceSharesMembersrt:MinimumMember2024-09-292025-10-040001821806lesl:TermLoanDueInTwentyTwentyEightMemberus-gaap:FairValueInputsLevel2Member2025-10-040001821806lesl:ABRMemberlesl:TermLoanMemberlesl:ApplicableRateMember2023-06-012023-06-300001821806lesl:TrademarksAndTradeNameMember2023-10-012024-09-2800018218062025-06-292025-10-040001821806lesl:VehiclesMachineryAndEquipmentMember2025-10-040001821806lesl:TermLoanMemberlesl:FirstLienLeverageRatioGreaterThanTwoPointSevenFiveToOneHundredMembersrt:MaximumMember2023-06-012023-06-300001821806us-gaap:DomesticCountryMember2025-10-040001821806us-gaap:AdditionalPaidInCapitalMember2024-09-292025-10-04lesl:Segmentlesl:Statelesl:Locationxbrli:purexbrli:shareslesl:Centeriso4217:USD
UNITED STATES
SECURITIES AND EXCHANGE COMMISSION
WASHINGTON, D.C. 20549
FORM 10-K
(Mark One)
|
|
☒ |
ANNUAL REPORT PURSUANT TO SECTION 13 OR 15(d) OF THE SECURITIES EXCHANGE ACT OF 1934 |
For the fiscal year ended October 4, 2025
OR
|
|
☐ |
TRANSITION REPORT PURSUANT TO SECTION 13 OR 15(d) OF THE SECURITIES EXCHANGE ACT OF 1934 FOR THE TRANSITION PERIOD FROM TO |
Commission File Number: 001-39667
LESLIE’S, INC.
(Exact Name of Registrant as Specified in its Charter)
|
|
Delaware |
20-8397425 |
(State or other jurisdiction of incorporation or organization) |
(I.R.S. Employer Identification No.) |
|
|
2005 East Indian School Road Phoenix, AZ |
85016 |
(Address of principal executive offices) |
(Zip Code) |
Registrant’s telephone number, including area code: (602) 366-3999
Securities registered pursuant to Section 12(b) of the Act:
|
|
|
|
|
Title of each class |
|
Trading Symbol(s) |
|
Name of each exchange on which registered |
Common Stock, par value $0.001 per share |
|
LESL |
|
The Nasdaq Global Select Market |
Securities registered pursuant to Section 12(g) of the Act: None
Indicate by check mark if the Registrant is a well-known seasoned issuer, as defined in Rule 405 of the Securities Act. Yes ☐ No ☒
Indicate by check mark if the Registrant is not required to file reports pursuant to Section 13 or 15(d) of the Act. Yes ☐ No ☒
Indicate by check mark whether the Registrant: (1) has filed all reports required to be filed by Section 13 or 15(d) of the Securities Exchange Act of 1934 during the preceding 12 months (or for such shorter period that the Registrant was required to file such reports), and (2) has been subject to such filing requirements for the past 90 days. Yes ☒ No ☐
Indicate by check mark whether the Registrant has submitted electronically every Interactive Data File required to be submitted pursuant to Rule 405 of Regulation S-T (§ 232.405 of this chapter) during the preceding 12 months (or for such shorter period that the Registrant was required to submit such files). Yes ☒ No ☐
Indicate by check mark whether the Registrant is a large accelerated filer, an accelerated filer, a non-accelerated filer, a smaller reporting company, or an emerging growth company. See the definitions of “large accelerated filer,” “accelerated filer,” “smaller reporting company,” and “emerging growth company” in Rule 12b-2 of the Exchange Act.
|
|
|
|
|
|
|
Large accelerated filer |
|
☐ |
|
Accelerated filer |
|
☒ |
|
|
|
|
Non-accelerated filer |
|
☐ |
|
Smaller reporting company |
|
☐ |
|
|
|
|
|
|
|
Emerging growth company |
|
☐ |
|
|
|
|
If an emerging growth company, indicate by check mark if the Registrant has elected not to use the extended transition period for complying with any new or revised financial accounting standards provided pursuant to Section 13(a) of the Exchange Act. ☐
Indicate by check mark whether the Registrant has filed a report on and attestation to its management’s assessment of the effectiveness of its internal control over financial reporting under Section 404(b) of the Sarbanes-Oxley Act (15 U.S.C. 7262(b)) by the registered public accounting firm that prepared or issued its audit report. ☒
If securities are registered pursuant to Section 12(b) of the Act, indicate by check mark whether the financial statements of the Registrant included in the filing reflect the correction of an error to previously issued financial statements. ☐
Indicate by check mark whether any of those error corrections are restatements that required a recovery analysis of incentive-based compensation received by any of the Registrant’s executive officers during the relevant recovery period pursuant to §240.10D-1(b). ☐
Indicate by check mark whether the Registrant is a shell company (as defined in Rule 12b-2 of the Exchange Act). Yes ☐ No ☒
The aggregate market value of the Common Stock held by non-affiliates of the Registrant, based on the closing price of the Common Stock on The Nasdaq Global Select Market (“Nasdaq”) on March 28, 2025, the last business day of the Registrant’s most recently completed second fiscal quarter, was approximately $153.3 million. For purposes of this response, the Registrant has assumed that its directors, executive officers, and beneficial owners of 5% or more of its Common Stock are affiliates of the Registrant.
The number of shares of Registrant’s Common Stock outstanding as of December 5, 2025 was 9,290,311.
DOCUMENTS INCORPORATED BY REFERENCE
The information required by Part III of this Report, to the extent not set forth herein, is incorporated herein by reference from the Registrant’s definitive proxy statement relating to the Annual Meeting of Shareholders to be held in 2026, which definitive proxy statement shall be filed with the Securities and Exchange Commission within 120 days after the end of the fiscal year to which this Annual Report on Form 10-K relates.
CAUTIONARY NOTE REGARDING FORWARD-LOOKING STATEMENTS
This Annual Report on Form 10-K contains forward-looking statements about us and our industry that involve substantial risks and uncertainties. All statements other than statements of historical fact contained in this Annual Report on Form 10-K, including statements regarding our future results of operations or financial condition, business strategy, value proposition, dispositions, legal proceedings, competitive advantages, market size, growth opportunities, industry expectations, and plans and objectives of management for future operations, are forward-looking statements. In some cases, you can identify forward-looking statements because they contain words such as “anticipate,” “believe,” “contemplate,” “continue,” “could,” “estimate,” “expect,” “intend,” “may,” “plan,” “potential,” “predict,” “project,” “should,” “target,” “will,” or “would,” or the negative of these words or other similar terms or expressions. Our actual results or outcomes, or the timing of our results or outcomes, could differ materially from those indicated in these forward-looking statements for a variety of reasons, including, among others:
•our ability to execute on our growth strategies;
•our expectations regarding our cash resources and cash generation from normal operations;
•supply disruptions or increased costs, including as a result of trade policies;
•our ability to maintain favorable relationships with suppliers and manufacturers;
•our ability to maintain the integrity of our supply chain without disruption;
•our ability to successfully streamline our operations and improve long-term profitability, including through the closure of underperforming U.S. stores;
•competition from mass merchants, online platforms and specialty retailers;
•impacts on our business from the sensitivity of our business to weather conditions, changes in the economy (including high interest rates, recession fears, inflationary pressures and changes in trade policies, including tariffs or other trade restrictions or the threat of such actions), geopolitical events or conflicts, and the housing market;
•disruptions in the operations of our manufacturing facilities and distribution centers;
•our ability to implement technology initiatives that deliver the anticipated benefits, without disrupting our operations;
•our ability to execute on our management transition plans and to attract and retain senior management and other qualified personnel;
•regulatory changes and developments affecting our current and future products including evolving legal standards, regulations and stakeholder expectations concerning environmental and, sustainability matters;
•our ability to obtain additional capital to finance operations;
•commodity price inflation and deflation;
•impacts on our business from epidemics, pandemics, or natural disasters;
•impacts on our business from cyber incidents and other security threats or disruptions;
•our ability to maintain compliance with Nasdaq listing standards;
•our ability to remediate material weaknesses or other deficiencies in our internal control over financial reporting or to maintain effective disclosure controls and procedures and internal control over financial reporting; and
•other risks and uncertainties, including those listed in the section titled “Risk Factors” in our filings with the United States Securities and Exchange Commission (“SEC”).
You should not rely on forward-looking statements as predictions of future events. We have based the forward-looking statements contained in this Annual Report on Form 10-K primarily on our current expectations and projections about future events and trends that we believe may affect our business, financial condition, and operating results. The outcome of the events described in these forward-looking statements is subject to risks, uncertainties, and other factors described in Part I, Item 1A, “Risk Factors” and elsewhere in this Annual Report on Form 10-K. Moreover, we operate in a very competitive and rapidly changing environment. New risks and uncertainties emerge from time to time, and it is not possible for us to predict all risks and uncertainties that could have an impact on the forward-looking statements contained in this Annual Report on Form 10-K. The results, outcomes, events, and circumstances reflected in the forward-looking statements may not be achieved or occur, and actual results or outcomes, or the timing of results and outcomes, could differ materially from those described in the forward-looking statements.
In addition, statements that “we believe” and similar statements reflect our beliefs and opinions on the relevant subject. These statements are based on information available to us as of the date of this Annual Report on Form 10-K and while we believe that information provides a reasonable basis for these statements, that information may be limited or incomplete. Our statements should not be read to indicate that we have conducted an exhaustive inquiry into, or review of, all relevant information. These statements are inherently uncertain, and investors are cautioned not to unduly rely on these statements.
The forward-looking statements made in this Annual Report on Form 10-K are based on events or circumstances as of the date on which the statements are made. We undertake no obligation to update any forward-looking statements made in this Annual Report on Form 10-K to reflect events or circumstances after the date of this Annual Report on Form 10-K or to reflect new information, changed expectations, the occurrence of unanticipated events or otherwise, except as required by law. We may not actually achieve the plans, intentions, outcomes or expectations disclosed in our forward-looking statements, and you should not place undue reliance on our forward-looking statements. Our forward-looking statements do not reflect the potential impact of any future acquisitions, mergers, dispositions, joint ventures, or investments.
PART I
Item 1. Business.
In this Annual Report on Form 10-K, unless otherwise indicated or the context otherwise requires, all references to “we,” “our,” “us,” “Leslie’s,” “the Company,” and “our Company” refer to Leslie’s, Inc. and its consolidated subsidiaries.
Our Company
Founded in 1963 by Phil Leslie Jr. in Southern California, the Company today known simply as “Leslie’s” has over six
decades of disruptive retail innovation in the $15 billion U.S. pool and spa care industry. Today, we are the largest and most trusted direct-to-consumer brand in our segment, serving residential consumers and pool professionals, and many of the largest commercial property operators in the country. With over 1,000 retail locations, an integrated, digitally forward omnichannel strategy, and a horizontally integrated, nationwide ecosystem under the Leslie’s and In the Swim® brands, among others, we have built a market-leading share of residential aftermarket product spend, based on 2024 industry analyst reports, and a physical network larger than the sum of our 20 largest competitors. We offer an extensive assortment of professional-grade products, the majority of which are exclusive to Leslie’s, manufacturer certified installation and repair services, and in some markets, weekly pool maintenance services. Our dedicated, knowledgeable team of associates, pool and spa care experts, and experienced service technicians, are passionate about empowering every single Leslie’s customer with the knowledge, products, and solutions necessary to confidently maintain and thoroughly enjoy their pools and spas. The considerable scale of our integrated marketing and distribution ecosystem, which is powered by our direct-to-consumer network, uniquely enables us to efficiently reach and service nearly every pool and spa in the continental United States.
We operate primarily in the pool and spa aftermarket industry, a fundamentally attractive category in retail, given its scale, historical predictability, and growth outlook. More than 85% of our product assortment is comprised of non-discretionary products essential to the care of residential and commercial pools and spas. This includes chemicals, new and replacement parts, cleaning and maintenance equipment, safety, recreational, and fitness-related products. We also offer important essential services, such as equipment installation and repair for residential and commercial customers. We have relationships with professional pool operators from major hotel and apartment owners to municipal, county and state governments, all the way to sole proprietors. In addition to a strong consumer and commercial retail and service presence, we operate a wholesale specialty pool and spa parts distribution business, giving us unique access to hard-to-find specialty parts; an integrated manufacturing plant, giving us vertical scale and competitive cost on parts of our chemical assortment; and a regionally located, hub-and-spoke distribution system throughout the continental United States.
We offer complimentary, commercial-grade in-store water testing and analysis via our proprietary AccuBlue® system, leading to increased consumer engagement, conversion, basket size, and loyalty, resulting in higher lifetime value. Our water treatment expertise is powered by data and intelligence accumulated from the millions of water tests we have performed over the years, positioning us as the most trusted water treatment service provider in the recreational pool and spa industry. We then brought AccuBlue® direct to pool owners’ backyards with AccuBlue Home®, a pioneering app-enabled water testing device. These differentiated capabilities allow us to meet the needs of any pool and spa owner, whether they care for their pool or spa themselves or rely on a professional, whenever, wherever, and however they choose to engage with us.
Our Competitive Strengths
We believe that the following competitive strengths have been key drivers of our success to date, and strategically position us for continued success.
We are the direct-to-consumer market leader in the aftermarket pool and spa care industry, with close proximity to U.S. pool and spa installations.
For over 60 years, we have been dedicated to addressing our consumers’ pool needs so that they can spend less time maintaining and more time enjoying their pools. While we sell many pool and spa services and solutions, we view our ultimate goal as enabling joy with family and friends. We are the only direct-to-consumer pool and spa care brand with a nationwide physical presence and an integrated digital platform, consisting of individually merchandised e-commerce websites, a mobile app with transaction capabilities, and online marketplace operations, designed to address the needs of all pool and spa consumers. Further, our locations are strategically situated within 20 miles of 80% of pools in the country, and in the sunbelt, nearly 90% of pools are within a 15 mile radius of our locations, according to 2024 industry analyst reports. The remainder of the industry is highly fragmented across both offline and online providers, including mass merchant stores with a much narrower assortment of pool and spa care solutions, and local independent operators.
Direct relationships with pool and spa owners and professional service providers, driving strong Company loyalty programs.
We are the largest national pool and spa care brand with a direct relationship with pool and spa owners and importantly, those who serve them. Our database includes over 12 million consumers who have relied on our integrated platform, for their ongoing pool and spa care needs. Through our best-in-class proprietary water testing and backed by our team of highly trained pool and spa experts, we offer sophisticated product recommendations and other expert advice, which cultivates long-standing relationships with our consumers and drives our leading loyalty programs, including Pool Perks®, our retail loyalty program, as well as our PRO Partner loyalty program for service professionals. The comprehensive nature of our product and service offering enables our customers to reap expanded benefits by staying within the Leslie’s ecosystem. Pool Perks®, revamped earlier this year for more rewarding engagement by embracing three different loyalty tiers, specifically drives exceptional retention with a higher per transaction spend versus non-loyalty members. We define “direct relationships” as the number of unique customers for whom we have a mailing address, a phone number, or an email address, and many of which are Pool Perks® members.
Consumer-centric connected ecosystem for all pool and spa owners and the professionals who serve them using proprietary, leading brands across all channels.
We have built the most extensive and geographically diverse pool and spa care network in the United States. Our locations are strategically located in densely populated areas mainly throughout the Sunbelt, including California, Arizona, Texas, and Florida, and have a full omni-channel capability to ship to each state within the United States. Across our physical network, we employ a team of more than 3,700 associates, including pool and spa care experts and service technicians, who act as solution providers to both “do-it-yourself” (“DIY”) and “do-it-for-me” (“DIFM”) pool owners as well as pool professionals.
As digital transactions have become many customers’ default preference, we have focused on architecting an industry-leading integrated digital platform of proprietary e-commerce websites via our Leslie’s and In The Swim® brands and the Leslie’s iOS and Android apps. Our proprietary e-commerce websites serve digital consumers through curated pricing and targeted merchandising strategies. In addition to our owned and operated e-commerce websites, we also offer our products through online marketplaces such as Amazon, eBay, and Walmart. This year, we launched an exciting test partnership with a leading same-day delivery provider for many essential products, which we plan to sustainably expand. As a result of our strategic investments in digital, we are uniquely positioned to serve our consumers with cross-channel capabilities and capture incremental online demand from new consumers while growing the total profitability of the network.
Comprehensive assortment of proprietary brands with recurring, essential, superior product formulations, and trusted, solution-based services for all consumers.
We offer a comprehensive product range, consisting of more than 25,000 products across chemicals, equipment and parts, cleaning and maintenance equipment, safety, recreational, and fitness-related categories. More than 80% of our product sales are non-discretionary and recurring in nature. In addition, more than 55% of our total sales and 82% of our chemical sales are derived from proprietary brands and custom-formulated products, which allows us to create an entrenched consumer relationship, optimize our supply chain, and capture attractive margins. Consumers choose our exclusive, proprietary brands and custom-formulated products for their efficacy and value, a combination that we believe cannot be found elsewhere.
We pair our comprehensive product assortment with differentiated in-store and on-site service offerings. We pioneered the complimentary in-store water test and resulting proprietary water prescription, which has driven consumer traffic and loyalty, and has created a pharmacy-like consultative relationship with our consumers. We further made significant upgrades to our water testing capabilities with the launch of our AccuBlue® platform. Our AccuBlue® water test screens for 10 distinct water quality criteria including pH, total alkalinity, chlorine levels, cyanuric acid, and more, to determine the pool's health and safety. Our in-store experts leverage our proprietary AccuBlue® water diagnostics software engine to offer our consumers a customized prescription and treatment plan using our comprehensive range of exclusive products, walking them step-by-step through the product use sequence. These detailed and sophisticated treatment algorithms are supported by our differentiated, decades-long water treatment expertise. Historically, we have found that consumers who test their water with us regularly spend more with us per year than those who do not, underscoring the importance of this acquisition and retention vehicle. In 2023, we pioneered this same proprietary, commercial grade technology for consumers in the comfort of their own backyards, with AccuBlue Home®. We also employ the industry’s largest network of in-field technicians who perform on-site evaluations, installation, and repair services for residential consumers and professional pool operators.
Highly experienced and visionary leadership team that combines deep industry expertise and advanced direct-to-consumer capabilities.
Our strategic vision and culture are driven by our executive leadership team. Our well-balanced leadership team is comprised of leaders with experience in the pool and spa care industry as well as recent hires who bring new perspectives and capabilities to Leslie’s from a variety of sectors. Our leadership team is firmly committed to executing our strategic vision and, driving increased traffic and conversion; and focused on creating long-term shareholder value.
Our Company Purpose
Our Vision is to be “America’s One Stop for Pool Care”. We do this by putting the customer at the center of everything that we do. At Leslie’s, our goal is to enable joy and elevate everyday moments through clean, safe and beautiful pools.
Our Growth Strategies
We believe we are well positioned to drive sustainable growth and profitability over the long term by executing on the following strategies:
Drive traffic & grow engaged customer base.
We believe we have significant opportunity to acquire new residential consumers and reactivate lapsed residential consumers, which we plan to do by executing on the following strategies:
•Acquire or reactivate consumers via optimized marketing strategy. We believe we have a sizeable opportunity to grow by serving the millions of pool and spa owners in our market who do not actively shop with us today. We plan to pursue our acquisition of these potential new or reactivated consumers and, at the same time, manage consumer acquisition costs by shifting our marketing mix toward more efficient digital and social channels with increasing focus on advanced analytics and return-on-investment focused marketing spend. From our own data analytics, we know that over 85% of our residential transactions are with ‘known’ customers, i.e. those that have given us their email, phone number, address, size and type of pool, depth of pool, hot tub or sauna ownership, equipment models, and more. With this information we can take a targeted approach to reach out to lapsed and loyal customers with offers or customized solutions to meet their needs.
•Capture new pool and spa consumers. We intend to build our consumer file by deploying targeted marketing tactics and highlighting our unique value proposition, including our pool expertise, our 10-point AccuBlue® water test, and our broad portfolio of products and services.
•Highlight our unique, nationwide retail store footprint, while simultaneously improving our digital and mobile offerings. As previously noted, our nationwide retail footprint is strategically located to be within 20 miles of 80% of the country’s installed pool base – and nearly 90% of the installed base in the Sunbelt. At the same time, we know that consumers are facing ever-busier lives and hectic schedules, so they expect prompt service and solutions; we believe we have more white space to increase adoption and engagement with the Leslie’s mobile app and the Leslie’s and In The Swim® owned and operated websites, as well as improve our consideration in third-party marketplaces. Our newly launched same-day, on-demand delivery partnership, which we expect to expand beyond our trial markets in FY 2026, represents our increasing focus on meeting pool owners and pool pros wherever they are as quickly and helpfully as possible.
Increase share of wallet among existing consumers.
We believe we have a significant opportunity to increase spend from existing consumers and drive higher lifetime value. We plan to do this by executing on the following strategies:
•Increase loyalty membership penetration and introduce program upgrades. We plan to continue to market our loyalty program in-store and online to convert more of our consumers to loyalty members through our revamped loyalty program, Pool Perks®, in order to offer more value-added features to further drive member enrollment and engagement. This year, Pool Perks® was relaunched with loyalty tiers, rewarding our members incrementally as they spend more with us. We actively explore opportunities to drive interest by selectively offering special incentives and rewards as well as introducing new value-added features and services. From our decades of experience, we know these initiatives will drive higher transaction frequency and basket size, resulting in increased category spend and higher lifetime value with existing consumers.
•Enhance retention marketing. We believe there is opportunity to drive even greater retention and engagement with our customers and all pool and spa owners. We plan to do this by more actively leveraging our consumer and service professionals’ databases to personalize each user’s experience with targeted messaging and product recommendations.
•Expand our product and service offering. We plan to expand our offering by introducing new and innovative products and services in our existing categories and by expanding into adjacent categories. We also believe that the DIFM pool and spa customers are a rapidly growing space, so our targeted efforts toward greater acquisition and retention of pool pros has become an increasing focal point for growth.
•Grow additional share in the professional market. We believe we have a significant opportunity to grow our sales with pool care professionals, who individually can spend significantly more than residential consumers on pool supplies and equipment. Our research suggests that small and mid-size pool professionals value convenience and referrals, both of which we are uniquely positioned to offer given our over 1,000 locations and the industry’s largest consumer file. We continue to assemble an affiliated network of qualified pool professionals through our PRO Partner program, further expanding the Leslie’s name in the professional channel. To better attract pool care professionals, we also have a dedicated Leslie’s PRO e-commerce website. This website provides all of the online tools needed for professionals to serve their respective communities and grow their pool care businesses.
Continue our focus on the convenience Leslie’s can offer our customers.
People today are busier than ever before, and today’s consumer thinks in “minutes and hours” well before “days”. In our portfolio some products have the customer availability expectation of mere minutes. They have a ‘need’ and time for them is of the essence. Some areas of focus for this include:
•Localized fulfillment. Having the right inventory, in the right place, at the right time, and at the right price is key. The pool and spa markets are regionally varied, and Leslie’s strength is in having locally relevant inventory to meet customers’ needs. Whether you are a residential customer who needs chemicals, or a local Pro who needs critical parts on a consistent basis, our goal is to have a selection in our stores of certain chemicals and parts that we expect to always have in stock and be available in ‘minutes’. For other items, like select pool parts that are not as high velocity, our goal will be to get to a place where we can get those items to customers within hours.
•“Never-outs.” To be truly convenient, we have re-examined every SKU we carry and prioritized being in-stock on the most important high velocity SKUs. We refer to these as “never-outs” and we have redoubled our efforts on supporting in-stock rates approaching 100% wherever possible. Our product assortment consists of such a high percentage of non-discretionary, needs-based items, less time taken to solve a customer’s problem often determines who wins the sale and is key to delivering on our customer’s expectation for convenience.
•Omnichannel Focus. We are accelerating our competitive advantage with our proximity to pools and our omnichannel transformation. In addition to continued enhancements and improvements in our business online on our website and via our mobile app, we are also focused on improving our overall fulfillment efficiency. In addition to Ship to Home and Buy Online, Pickup in Store (“BOPIS”) capabilities, Leslie’s is expanding same-day delivery options. In 2025, in our Phoenix test market, new technology integrations cut Ship-to-Home fulfillment from days to hours—and often minutes. In fiscal 2026, we intend to scale this model across Arizona and intent to look to sustainably expand it nationwide thereafter.
Continue to introduce disruptive innovation.
Leslie’s has a legacy of disruptive innovation in the pool and spa care industry. We plan to continue that legacy by developing and introducing capabilities that create loyalty amongst our customers, provide novel solutions for pool owners, and create value for our shareholders. Present areas of focus include water testing, maintenance prescriptions, new product offerings, and our product distribution ecosystem.
We know consumers will seek the convenience of “smart” home functionality in more facets of their daily lives. We believe there is an opportunity to introduce a full service, connected home solution that effectively automates pool maintenance, including actively monitoring our consumers’ water, diagnosing, developing, and prescribing a treatment plan, and delivering to their home the assortment of products needed to maintain a clear, safe, and beautiful pool.
Accordingly, in fiscal 2023 we completed the commercial launch of our AccuBlue Home® program, a subscription-based offering that enables pool and spa owners to confidently test and treat their pools and spas without ever having to leave their backyard. Using the new, industry-leading AccuBlue Home® connected device combined with the Leslie’s mobile app, program members can utilize commercial grade water testing in the convenience of their own home and can test all critical aspects of their water chemistry with ease, generating a custom treatment plan tailored to the specifications of their pool or spa. Seamlessly within the Leslie’s mobile app, consumers can review their prescription, order the products they need, and have them delivered right to their door or arrange for a same-day pick-up at their local Leslie’s location.
In fiscal 2025, as mentioned above, we launched a trial partnership with an on-demand, same-day delivery platform tailored for Leslie’s customers and pool owners who simply know what they need and know they need it quickly. We completed a redesign of our Pool Perks® loyalty program by offering up loyalty tiers for the first time, which we believe increases engagement with our major customers and entice occasional customers to gain more by spending more.
Our Industry
We operate in the aftermarket pool and spa care industry, which is broadly comprised of: (i) chemicals; (ii) equipment, parts, and accessories; and (iii) services. The United States market consists of millions of installed pools and spas, which require routine maintenance throughout their lifetime. This drives an annuity-like stream of demand for the chemicals and products necessary to properly maintain a pool or spa, and Leslie’s is at the forefront of providing innovative products and solutions for this recurring, necessary share of wallet.
While we benefit from the growth in the installed base, our business is not dependent on new pool construction activity and can generate strong growth from a fixed installed base through increased pool usage, more frequent sanitization, and recurring maintenance needs. Increasing our customer file and growing our loyalty membership should also have a positive effect on our growth from a fixed installed base which is not dependent on new pool construction.
Seasonality
Our business is highly seasonal. Sales and earnings are highest during our third and fourth fiscal quarters, which include April through September, and represent the peak months of swimming pool use. Sales are substantially lower during our first and second fiscal quarters. Despite the seasonal nature of our business, we have a long track record of investing in our business throughout the year, including in operating expenses, working capital, and capital expenditures related to new products, locations, and other growth initiatives. While these investments drive performance during the primary selling season in our third and fourth fiscal quarters, they have a negative impact on our earnings and cash flow during our first and second quarters.
We typically experience a build-up of inventory and accounts payable during the first and second fiscal quarters in anticipation of the peak swimming pool supply selling season. We negotiate extended payment terms with certain of our primary suppliers as we receive merchandise in December through March in advance of the swimming pool supply selling season.
The principal external factor affecting our business is weather. Hot weather can increase purchases of chemicals and other non-discretionary products as well as purchases of discretionary products and can drive increased purchases of installation and repair services. Unreasonably cool weather or significant amounts of rainfall during the peak pool sales season can reduce chemical consumption in pools and spas and decrease consumer purchases of our products and services. In addition, unseasonably early or late warming trends can increase or decrease the length of the pool season and impact time around pool openings and closings, and therefore, our total sales and timing of our sales.
We generally open new locations before our peak selling season begins and close locations after our peak selling season ends. We expect that our quarterly results of operations will fluctuate depending on the timing and amount of sales contributed by new locations.
Our Consumers
We strategically serve all consumers within the aftermarket pool and spa care industry including Residential Pool, Residential Spa, and Professional Pool consumers.
•Residential Pool. The residential pool market consists of approximately 9.0 million pools representing a total aftermarket sales opportunity of approximately $7.0 billion. Within this market, the DIY aftermarket spend represents approximately 65% of total spend while DIFM services represent approximately 35% of total spend. Many of our residential pool consumers visit our locations on a regular basis to conduct water testing, seek expert pool advice, and purchase products as well as utilize our integrated digital platforms.
•Residential Spa. The residential spa market consists of approximately 5.5 million spas or hot tubs representing approximately $0.9 billion aftermarket sales opportunity for chemicals and equipment. Including the approximately $1.6 billion market for new spas, residential spa represents a total addressable market of approximately $2.5 billion.
•Professional Pool. The professional pool market consists of pool service professionals and professional pool operators. Pool service professionals specialize in maintenance and equipment repair for DIFM homeowners, businesses, and government entities. Professional pool operators manage approximately 300,000 pools across hotels, motels, apartment complexes, and water parks. This market represents a total aftermarket sales opportunity of approximately $4.9 billion.
Our Product and Service Offering
We offer a comprehensive assortment of more than 25,000 products across chemicals, equipment and parts, cleaning and maintenance equipment, and safety, recreational, and fitness related products. Historically, approximately 85% of our assortment has been comprised of essential and non-discretionary products that are needed by residential customers and pool professionals to care for pools and spas. The vast majority of our assortment features non-discretionary products that are shelf-stable and generally not prone to either obsolescence or shrinkage, which could occur from changing technology or consumer buying habits. As the trusted one-stop destination for all aftermarket pool and spa needs, we provide an extensive and highly differentiated product offering. We aim to fulfill the needs of our residential and professional consumers with our comprehensive assortment, in-stock inventory, and product selection across a broad range of premium proprietary and third-party brands.
Since our inception in 1963, we have offered a portfolio of owned and exclusive brands. We continue to expand our selection of exclusive offerings through innovation and product development. Our exclusive brands and products account for more than 55% of total sales and 82% of chemical sales. These proprietary brands and custom-formulated products are only available through our integrated platform and offer professional-grade quality to our consumers, while allowing us to achieve higher gross margins relative to sales of third-party products.
In addition to our comprehensive product assortment, we offer critical services, such as complimentary, commercial grade water testing and in-store equipment repair. We also employ a large in-field service network of pool and spa care service professionals who have the expertise to provide essential on-site equipment installation and repair services for residential consumers and professional pool operators throughout the continental United States.
Our Vertically Integrated Model
We operate a vertically integrated supply chain, packaging, and distribution model, which represents a significant competitive advantage.
Our vertically integrated supply chain enables us to produce and package products at our company-operated packaging facilities and third-party contract packaging facilities. Our strategy is to identify, produce, and package high volume items that do not require sophisticated or capital-intensive production or packaging equipment, but allow us to offer our consumers a premium product while offering us a significant cost advantage. We source a variety of raw materials and chemicals directly from a diversified supplier base; and maintain strong relationships with these suppliers. As of October 4, 2025, we had one supplier that represented more than 10% of our annual purchases. Using these raw materials, we manufacture and package a wide selection of final products, including, but not limited to, chlorine products, pH adjusters, and filter cleaners. A significant portion of our total mix is comprised of products that we manufacture or package through vertical integration, which offers economies of scale that have resulted in higher quality products and a structurally advantaged margin profile.
We also operate a vertically integrated distribution and delivery model. In addition to operating two manufacturing facilities, we operate a national network of company-operated distribution centers in addition to utilizing third-party distribution centers. Our
company-operated distribution centers and our third-party logistics partners have the capacity to carry a broad breadth of our products in significant quantities and are capable of replenishing inventory throughout our physical network. From these facilities, we distribute to our physical network through a contracted fleet of tractors and trailers, which helps ensure optimal in-stock levels throughout the year. Our third-party distribution centers are strategically located to complement our company-operated distribution centers and primarily fulfill online orders.
Our Marketing Strategy
We believe there is potential to drive increased share of wallet among our existing consumers through strategic initiatives, such as our loyalty membership program and dynamic promotions.
Due to the replenishment driven nature of our product mix and long-term consumer relationships, we believe that our investments in consumer acquisition marketing generate attractive returns. We know the location of pools and spas throughout the United States, and by leveraging this information, we have the ability to allocate our advertising dollars in a highly targeted manner. Additionally, we have added experienced marketing talent with significant expertise in analytics and performance marketing to grow our consumer file. Through these strategies, we plan to increase brand awareness and continue profitably acquiring new consumers.
Our Competition
The United States aftermarket pool and spa care industry is fragmented and competitive. We compete against a wide range of manufacturers, retailers, distributors, and service providers in the residential and professional pool and spa care market. This includes original equipment manufacturers, regional and local retailers, home improvement retailers, mass-market and club retailers, and specialty e-commerce operators. Key competitive groups include:
•Regional and Local Independent Retailers. Estimated to include more than 10,000 smaller, local independent competitors, which offer the convenience of proximity. The vast majority of these competitors operate single stores and, due to relative economies of scale, this group generally offers limited product assortment, charges higher prices and invests less resources in marketing;
•Home Improvement Retailers. Includes national home improvement retailers, such as Home Depot, Lowe’s, and local and regional hardware stores. This group generally employs a seasonal strategy, offering limited product assortment during select spring and summer months, does not offer services, and typically does not employ associates with the pool and spa care expertise;
•Mass-Market, Club and Marketplace Retailers. Includes larger, scaled players, such as Walmart, and Costco, as well as smaller online retailers that market their products to consumers through scaled marketplace platforms such as Amazon, eBay, and Walmart. The mass-market group generally offers limited product assortment, often on a seasonal basis, and does not offer services or pool and spa care expertise. The marketplace retailers sell a wide range of pool supplies under a number of brands that are available for sale year-round, however they do not offer services or pool and spa care expertise; and
•Wholesale Distributors. Includes large wholesalers, such as Heritage Pool Supply Group, owned by Home Depot, and Pool Corporation. This group generally does not directly serve the end-consumer, but rather serves as an intermediary that supplies product to retailers as well as the professional channel.
Our competitors offer pool care products and services of varied quality and across a wide range of retail price points. We experience greater brick-and-mortar competition in the states with the largest installed pool bases, including California, Texas, Florida, and Arizona. While some of our competitors also market and sell online, there are various challenges to serving consumers in the aftermarket pool and spa care industry via e-commerce. These challenges include regulatory restrictions on shipping hazardous materials, the need for professional installation of equipment at point of delivery, and the need for regular water testing, expert advice, and customized prescriptions and solutions related to the sale of chemicals. In addition, due to the seasonality of the aftermarket pool and spa care industry, several competitors only stock related products during the summer months, and their product assortment tends to be limited to basic offerings.
Human Capital Resources
As of October 4, 2025, we employed approximately 3,790 employees. Of these, approximately 2,990 work within our physical network, 210 work as in-field service technicians, 360 work in our corporate office, and 230 work in our distribution centers.
Our voluntary turnover rate over the past twelve months was 18% for corporate employees, and for all non-corporate roles including field team members, the turnover rate was 23%. In August 2025, we completed our annual employee engagement survey. Our commitment to culture was shown in a 3% increase in active engagement since the last survey. The strength of our leadership team was made evident in an 87% favorable score on our overall leadership effectiveness, which is a compilation of six survey questions regarding the employee’s direct supervisor’s performance. The executive leadership team prioritized the clarity of our strategic plan and delivery of that plan through an all-leadership summit, resulting in 86% of team members reporting that they feel clear on the goals, objectives, and strategy of the Company (2% increase from the prior survey).
Note: None of our employees are covered by collective bargaining agreements.
Trademarks and Other Intellectual Property
We employ various trademarks, trade names and service marks, including Leslie’s®, AccuBlue®, AccuBlue Home®, Pool Perks®, and our logo, in our product packaging and advertising our products. We have registered trademarks and trade names for several of our major products on the Principal Register of the United States Patent and Trademark Office. We distinguish the products produced in our chemical repackaging operation or by our third-party repacking partners through the use of the Leslie’s brand name and logo and the trademarks and trade names of the individual items, none of which is patented, licensed, or otherwise restricted to or by us. We believe the strength of our trademarks and trade names has been beneficial to our business and we intend to continue to protect and promote our trademarks in appropriate circumstances.
Leslie’s®, AccuBlue®, AccuBlue Home®, In The Swim®, Pool Perks®, and other trademarks, trade names or service marks of Leslie’s, Inc. appearing in this Annual Report on Form 10-K are the property of Leslie’s, Inc. All other trademarks, trade names, and service marks appearing in this Annual Report on Form 10-K are the property of their respective owners.
Available Information
Our website address is www.lesliespool.com. Information contained on our website or connected thereto does not constitute a part of this Annual Report on Form 10-K or any other filing we make with the SEC. We make available on this website under the “Investor Relations” section, free of charge, our annual reports on Form 10-K, quarterly reports on Form 10-Q, and current reports on Form 8-K, and amendments to those reports, as soon as reasonably practicable after we electronically file those materials with, or furnish them to, the SEC. The SEC also maintains a website that contains reports, proxy and information statements, and other information regarding issuers that file electronically with the SEC at www.sec.gov.
Note Regarding Third-Party Information
This Annual Report on Form 10-K includes market data and certain other statistical information and estimates that are based on reports and other publications from industry analysts, market research firms, and other independent sources, as well as management’s own good faith estimates and analyses. We believe these third-party reports to be reputable, but have not independently verified the underlying data sources, methodologies, or assumptions. Information that is based on estimates, forecasts, projections, market research, or similar methodologies is inherently subject to uncertainties, and actual events or circumstances may differ materially from events and circumstances reflected in this information.
Item 1A. Risk Factors.
Investing in our common stock involves a high degree of risk and uncertainty. You should carefully consider the risks, events and uncertainties described below in addition to the other information set forth in this Annual Report on Form 10-K, including the Management’s Discussion and Analysis of Financial Condition and Results of Operations section and the consolidated financial statements and related notes, before making an investment decision. The risks and uncertainties described below are not the only risks or uncertainties we face. The occurrence of any of the following risks and uncertainties or additional risks, events and uncertainties not presently known to us, or that we currently believe to be immaterial, could materially and adversely affect our business, financial condition, prospects, results of operations, cash flows or liquidity. In such case, the trading price of our common stock could decline, and you may lose all or part of your original investment. Some of the factors, events and contingencies discussed below may have occurred in the past, but the disclosures below are not representations as to whether or not the factors, events or contingencies have occurred in the past, and instead reflect our beliefs and opinions as to the factors, events, or contingencies that could materially and adversely affect us in the future. Our actual results and outcomes, or the timing of our results and outcomes, could differ materially from those anticipated in the forward-looking statements as a result of specific factors, including the risks and uncertainties described below.
Additionally, macroeconomic and geopolitical developments, including public health crises, escalating global conflicts, supply chain disruptions, labor market constraints, rising rates of inflation and high interest rates may amplify many of the risks discussed below to which we are subject. The extent of the impact of macroeconomic and geopolitical developments, including public health crises, on our financial and operating performance depends significantly on the duration and severity of such macroeconomic and geopolitical developments, including public health crises, the actions taken to contain or mitigate its impact and any changes in consumer behaviors as a result thereof. Among other factors, a significant disruption to our supply chain for products we sell, as a result of macroeconomic and geopolitical developments, including public health crises or otherwise, could have a material impact on our sales and earnings.
Summary of Risk Factors
The following summarizes the risks facing our business, which are more fully described below. This summary should be read in conjunction with the Risk Factors below and should not be relied upon as an exhaustive summary of the material risks facing our business. The order of presentation is not necessarily indicative of the level of risk that each factor poses to us.
Risks Related to the Nature of Our Business
•If we are unable to achieve comparable sales growth, our profitability and performance could be materially adversely impacted.
•Past growth may not be indicative of future growth.
•We may not be able to successfully manage our inventory to match consumer demand.
•Loss of key members of management could adversely affect our business.
•Our business is significantly dependent on our ability to meet our labor needs.
•We are subject to legal or other proceedings that could have a material adverse effect on us.
•Disruptions from natural disasters and similar weather-driven events could have a material adverse effect on our business.
•Our business is in a highly competitive industry subject to regional preferences and variations, and where we face
competition from certain of our suppliers, online platforms and mass merchants.
Risks Related to Our Industry and the Broader Economy
•We face competition from manufacturers, retailers, distributors, and service providers in the residential and professional pool and spa care market.
•The demand for our swimming pool and spa-related products and services may be adversely affected by unfavorable economic conditions.
•Adverse developments in the housing industry could slow the install of new pools and spas and thus impact demand for our products.
•The demand for pool chemicals may be affected by consumer attitudes towards products for environmental or safety reasons.
•Our results of operations may fluctuate from quarter to quarter for many reasons, including cyclicality and seasonality.
•Adverse developments affecting the financial services industry, such as actual events or concerns involving prevailing interest rates, liquidity, defaults, or non-performance by financial institutions or transactional counterparties, could adversely affect our current and projected business operations and our financial condition and results of operations.
•We maintain our cash at financial institutions in balances that may exceed federally insured limits.
•We are susceptible to adverse weather conditions.
Technology and Privacy Related Risks
•If our online systems do not function effectively, our operating results could be adversely affected.
•Any limitation or restriction on our ability to sell via online platforms could harm our profitability.
•A significant disturbance or breach of our technological infrastructure could adversely affect our financial condition and results of operations.
•Improper activities by third parties and other events or developments may result in future intrusions into or compromise of our networks, payment card terminals, or other payment systems.
Risks Related to Our Business Strategy
•We may acquire other companies or technologies, which could fail to result in a commercialized products and otherwise disrupt our business.
•Changing consumer preferences and demographic shifts could impact the demand for pool and spa care products sold via our retail networks.
•Our operating results will be harmed if we are unable to effectively manage and sustain our future growth or scale our operations.
•If we are unable to streamline our operations effectively, our business, financial condition and results of operations may be adversely affected.
•Our aspirations and disclosures related to sustainability matters expose us to risks that could adversely affect our reputation and performance.
Risks Related to the Manufacturing, Processing, and Supply of Our Products
•Our business includes the packaging and storage of chemicals, and an accident related to these chemicals could subject us to liability and increased costs.
•Our product assortment may be subject to increased regulatory oversight, increasing our cost of goods sold and our
competitive pricing power.
•Product supply disruptions may have an adverse effect on our profitability and operating results.
•The cost of raw materials could increase our cost of goods sold and cause our results of operations and financial condition to suffer.
Risks Related to Commercialization of Our Products
•The commercial success of our planned or future products is not guaranteed.
•We may implement a product recall or voluntary market withdrawal, which could significantly increase our costs, damage our reputation, and disrupt our business.
•If we do not manage product inventory effectively and efficiently, it could adversely affect profitability.
•If we do not effectively manage our distribution centers, it could adversely affect our business and financial condition.
•If we do not continue to obtain favorable purchase terms with manufacturers, it could adversely affect our operating results.
•Product quality, warranty claims, or safety concerns could impact our sales and expose us to litigation.
Risks Related to Government Regulation
•The nature of our business subjects us to compliance with employment, environmental, health, transportation, safety, and other governmental regulations.
Risks Related to Intellectual Property Matters
•If we are unable to adequately protect our intellectual property rights, our competitive position could be harmed or we could be required to incur significant expenses to enforce or defend our rights.
•If we infringe on or misappropriate the proprietary rights of others, we may be liable for damages.
Risks Related to Our Indebtedness
•Our substantial indebtedness could adversely affect our financial condition and our ability to operate our business.
•Our ability to generate sufficient cash depends on numerous factors beyond our control, and we may be unable to generate sufficient cash flow to service our debt obligations.
•Restrictive covenants in the agreements governing our Credit Facilities may restrict our ability to pursue our business strategies, and failure to comply with these restrictions could result in acceleration of our debt obligations.
•Incurrence of substantially more debt could further exacerbate the risks associated with our substantial leverage.
Risks Related to Ownership of Our Common Stock
•Our stock price may be volatile, resulting in substantial losses for investors.
•An active trading market for our common stock may not be sustained.
•Future sales of common stock by existing stockholders could cause our stock price to decline.
•Transactions engaged in by our principal stockholders, our officers or directors involving our common stock may have an adverse effect on the price of our stock.
•We do not intend to pay dividends for the foreseeable future.
•Anti-takeover provisions in our charter documents and under Delaware law could limit certain stockholder actions.
•Certain provisions of our seventh amended and restated certificate of incorporation may have the effect of discouraging lawsuits against our directors and officers.
•We will continue to incur increased costs as a result of being a public company.
•Our inability to remediate material weaknesses, our identification of any additional weaknesses, or our inability to achieve and maintain effective disclosure controls and procedures and internal control over financial reporting in a timely manner could adversely affect our results of operations, our stock price and investor confidence in us.
Risks Related to the Nature of Our Business
Our success depends on our ability to maintain or increase comparable sales, and if we are unable to achieve comparable sales growth, our profitability and performance could be materially adversely impacted.
Our success depends on increasing comparable sales through our merchandising and marketing strategy and on our ability to increase sales and profits. To increase sales and profits, and therefore comparable sales growth, we focus on delivering value and generating consumer excitement by staffing our locations with pool and spa experts, developing compelling products, optimizing inventory management, maintaining strong location conditions, and effectively marketing current products and new product offerings. If these efforts become less successful, we may not be able to maintain or improve the levels of comparable sales that we have experienced in the past, which could adversely impact our profitability; competition and pricing pressures from competitors may also adversely impact our operating margins. Our comparable sales growth could be, and has been in the past, lower than our historical average or our target for many reasons, including general economic conditions, operational performance, price inflation or deflation, competitive price on similar products, high interest rates, recession fears, industry competition, new competitive entrants near our locations, price changes in response to competitive factors, the impact of new locations entering the comparable base, cycling against any year or quarter of above-average sales results, unfavorable weather conditions, supply shortages or other operational disruptions, the number and dollar amount of consumer transactions in our locations, our ability to provide product or service offerings that generate new and repeat visits to our locations, and the level of consumer engagement that we provide in our locations. Opening new locations in our established markets may result in inadvertent oversaturation, temporary or permanent diversion of consumers, and sales from our existing locations to new locations and reduced comparable sales, thus adversely affecting our overall financial performance. These factors may cause our comparable sales results to be materially lower than in recent periods, which could harm our profitability and business.
Past growth may not be indicative of future growth.
Historically, we have experienced sales growth through organic market share gains, new location openings, and acquisitions that have increased our size, scope, and geographic footprint. Our various business strategies and initiatives, including our growth initiatives, are subject to business, economic, and competitive uncertainties and contingencies, many of which are beyond our control. While we contemplate continued growth through internal expansion and acquisitions, we may not be able to:
•acquire new consumers, retain existing consumers, and grow our share of the market;
•provide relevant omni-channel experiences to rapidly evolving consumer expectations through our proprietary mobile app and e-commerce websites;
•generate sufficient cash flows or obtain sufficient financing to support expansion plans and general operating activities;
•identify suitable acquisition candidates and successfully integrate acquired businesses;
•maintain favorable supplier arrangements and relationships; and
•identify and divest assets that do not continue to create value consistent with our objectives.
If we do not manage these factors successfully, our operating results could be adversely affected.
We may not be able to successfully manage our inventory to match consumer demand, which could have a material adverse effect on our business, financial condition, and results of operations.
We base our inventory purchases, in part, on our sales forecasts. If our sales forecasts overestimate consumer demand, we may experience higher inventory levels, which could result in the need to sell products at lower than anticipated prices, leading to decreased profit margins. Conversely, if our sales forecasts underestimate consumer demand, we may have insufficient inventory to meet demand, leading to lost sales, either of which could materially adversely affect our financial performance.
Loss of key members of management or failure to attract, develop, and retain highly qualified personnel could adversely affect our business.
Our future success depends on the continued efforts of the members of our executive leadership team. If one or more of our executives or other key personnel are unable or unwilling to continue in their present positions, or if we are unable to attract and retain high-quality executives or key personnel in the future, our business may be adversely affected.
We consider our employees to be the foundation for our growth and success. As such, our future success depends in large part on our ability to attract, train, retain, and motivate qualified personnel. During the height of our seasonal activities, we hire additional employees, including seasonal and part-time employees who generally are not employed during the off-season. If we are unable to attract and hire additional personnel during these seasons, our operating results could be adversely affected.
Our business is significantly dependent on our ability to meet our labor needs.
In order to maintain and continue expanding our operations, we depend on our ability to attract and retain qualified team members. Competition for non-entry-level personnel, particularly for team members with retail experience, is significant. Additionally, our ability to maintain a consistent level of high-quality customer service in our stores is critical to our success. Many of our store team members are in entry-level positions that historically have high rates of turnover. We may be unable to meet our labor needs and control our costs due to external factors such as the availability of qualified persons in the work forces of the markets in which we operate, which is impacted by factors including competition, unemployment levels, demand for certain labor expertise, prevailing wage rates, and the potential adoption of new or revised employment and labor laws and regulations. If we are unable to locate, attract, or retain qualified personnel, or if costs of labor or other related costs increase significantly, our financial performance could be adversely affected.
We are subject to, and may in the future be subject to, legal or other proceedings that could have a material adverse effect on us.
From time to time, we are a party to legal proceedings, including matters involving personnel and employment issues, personal injury, antitrust claims, intellectual property claims, securities law claims, and other proceedings arising in or outside of the ordinary course of business. We cannot guarantee that the insurance coverage we maintain for the Company and our directors and officers will be available for or adequately cover current or future claims or that we will be able to maintain adequate insurance in the future at rates we consider reasonable. In addition, there are an increasing number of cases being filed against companies generally, including class-action allegations under federal and state wage and hour laws. We estimate our exposure to these legal proceedings and establish reserves for the probable and reasonably estimated liabilities. Assessing and predicting the outcome of these matters involves substantial uncertainties. Although not currently anticipated by management, unexpected outcomes in these legal proceedings or changes in management’s forecast assumptions or predictions could have a material adverse impact on our results of operations.
Disruptions from natural or man-made disasters or extreme weather, public health and safety issues, geopolitical events and security issues, labor or trade disputes, macroeconomic crises, and similar events could have a material adverse effect on our business.
Natural or man-made disasters or extreme weather (including as a result of climate change), public health and safety issues, geopolitical events and conflicts (including terrorist attacks and armed hostilities), labor or trade disputes, macroeconomic crises (including any stemming from adverse developments in the financial services industry), and similar events can lead to uncertainty and have a negative impact on demand for our products, in addition to causing disruptions to our supply chain. Discretionary spending on chemicals, equipment and parts, cleaning and maintenance equipment, and safety, recreational, and fitness-related products, such as ours, is generally adversely affected during times of economic, social, or political uncertainty. For example, recent and potential changes to US trade policies, particularly escalating tariff exchanges with China and other countries, have disrupted supply chains and increased costs, potentially creating unpredictable customer spending patterns and economic uncertainty that could impact consumers’ discretionary spending. The potential for natural or man-made disasters or extreme weather, geopolitical events and conflicts, labor or trade disputes, macroeconomic crises, and similar events could create these types of uncertainties and negatively impact our business for the short- or long-term in ways that cannot presently be predicted.
We operate in a competitive and fragmented industry, subject to regional variations, and where we face competition from online
platforms, mass merchants, and certain of our suppliers.
The aftermarket pool and spa care industry is highly competitive, fragmented and regionally varied. Our success depends on many factors we cannot control, including localized competition, increased penetration from mass merchants and online competitors with greater scale and bargaining power, and even privately held, independent retailers that may be able to sell certain maintenance products at a loss. Further, some third-party suppliers with which the Company has long-standing relationships also sell their goods through other channels, including with some of our competitors. Customers in competitive markets often have significant bargaining power, low switching costs, and access to extensive information about competing offerings, which can increase pressure on pricing, thus producing upstream pressures on our contractual terms with suppliers and our margins. In addition, if key distribution partners, suppliers, or technology platforms favor competing products or restrict or alter access to their channels, the Company’s ability to attract new customers and retain existing customers could be impaired. Regional variations in pool and spa care and the types of products used in these regions requires an intimate knowledge of the local landscape, and changing tastes and preferences cannot always be anticipated.
Risks Related to Our Industry and the Broader Economy
We face competition from manufacturers, retailers, distributors, and service providers in the residential and professional pool and spa care market.
Within our industry, competition is highly fragmented. We compete against a wide range of manufacturers, retailers, distributors, and service providers in the residential and professional pool and spa care market. This includes original equipment manufacturers, regional and local retailers, home improvement retailers, mass-market retailers, and specialty e-commerce operators.
Most of our competition comes from regional and local independent retailers. National home improvement and retailers, such as Home Depot, Lowe’s, and local and regional hardware stores, typically compete with us mainly on a seasonal basis during the spring and summer months, but experience significantly higher foot traffic than our retail locations. We also face competition from mass-market retail competitors, such as Walmart and Costco, who devote shelf space to merchandise and products targeted to our consumers, as well as online mass-market retailers such as Amazon, who devote online categories to merchandise and products targeted to our consumers. Historically, mass-market retailers have generally expanded by adding new stores and product breadth, but their product offerings of pool-related products have remained relatively constant.] If pool and spa owners are attracted by the convenience afforded by any of our competitors, they may be less inclined to purchase products and/or services from us.
In addition, new competitors may emerge as there are no proprietary technologies or other significant barriers to prevent other firms from entering the swimming pool and spa supply retail market in the future. Should store and internet-based mass-market retailers increase their focus on the pool and spa industry, or increase the breadth of their pool, spa, and related product offerings, they may become a more significant competitor for our industry, which could have an adverse impact on our business. We may face additional competitive pressures if large pool supply retailers look to expand their consumer base. Given the density and demand for pool and spa products, some geographic markets that we serve also tend to have a higher concentration of competitors than others, particularly Arizona, California, Florida, and Texas. These states encompass our largest markets and entry of significant new competitors into them could have a substantial impact on our total sales.
The demand for our swimming pool and spa related products and services can be adversely affected by unfavorable economic conditions.
Consumer discretionary spending affects our sales and is impacted by factors outside of our control, including general economic conditions, the residential housing market, unemployment rates and wage levels, high interest rates, high inflation, disposable income levels, consumer confidence, recession fears, and access to credit. In economic downturns, the demand for swimming pool and spa related products and services may decline, often corresponding with declines in discretionary consumer spending, the growth rate of pool-eligible households, and swimming pool construction. A weak economy may also cause consumers to defer discretionary replacement and refurbishment activity. Even in generally favorable economic conditions, severe and/or prolonged downturns in the housing market could have a material adverse impact on our financial performance. Similarly, slow growth in the number of pool-eligible households can have a lasting negative impact by limiting the potential for future growth of the pool and spa maintenance market.
We believe that homeowners’ access to consumer credit is a critical factor enabling the purchase of new pools, spas and related products. Unfavorable economic conditions and downturns in the housing market can result in significant tightening of credit markets, which limit the ability of consumers to access financing for new swimming pools, spas, and related supplies, and consequently, replacement, repair, and maintenance of equipment. Tightening consumer credit could prevent consumers from obtaining financing for pool and spa projects, which could negatively impact our sales of products and services.
Adverse developments in the housing industry could slow the install of new pools and spas and thus impact demand for our products.
We could be materially impacted if the pace of new home construction fails to keep up with historical trends, population growth, and aggregate demand, particularly if homes change in design to omit features like pools and spas. In addition, as the U.S. housing market has shifted in some regions towards smaller lot sizes and higher-density developments, there is a possibility that new home construction will omit pools and spas altogether or replace individually owned pools and spas with community features. These developments could, in the aggregate, be materially adverse to our growth prospects in future years by reducing the demand for our products.
The demand for pool chemicals may be affected by consumer attitudes towards products for environmental or safety reasons.
We could be adversely affected if consumers lose confidence in the safety and quality of our products. The demand for the pool chemicals sold by us may also be affected by changes in consumer attitudes toward pool chemical products for environmental or safety reasons. To the extent more environmentally friendly alternative pool and spa water treatment methods emerge, we may not be successful in adopting them in a timely manner.
Our results of operations can fluctuate from quarter to quarter for many reasons, including seasonality.
Our sales are highly seasonal and we experience fluctuations in quarterly results as a result of many factors, many of which are outside of our control and/or difficult to predict. We have historically generated a greater percentage of our revenues during the warm weather months of April through September. Timing of consumer purchases will vary each year and sales can be expected to shift from one period to another. As a result, management believes that period-to-period comparisons of results of operations are not necessarily meaningful and should not be relied upon as any indication of future performance or results. In addition, because our revenues are concentrated to a limited number of months, our business is more susceptible to adverse events occurring in those months than other businesses that have consistent levels of revenue throughout the year.
Adverse developments affecting the financial services industry, such as actual events or concerns involving prevailing interest rates, liquidity, defaults, or non-performance by financial institutions or transactional counterparties, could adversely affect our current and projected business operations and our financial condition and results of operations.
Actual events involving reduced or limited liquidity, defaults, non-performance, or other adverse developments that affect financial institutions or other companies in the financial services industry or the financial services industry generally, or concerns or rumors about any events of these kinds, have in the past and may in the future lead to market-wide liquidity problems. Investor concerns regarding the U.S. or international financial systems could result in less favorable commercial financing terms, including higher interest rates or costs and tighter financial and operating covenants, or systemic limitations on access to credit and liquidity sources, thereby making it more difficult for us to acquire financing on acceptable terms or at all. Increased interest rates impact the Company and our consumers by making new borrowings or refinancings of our indebtedness obligations more expensive and, for consumers, reducing their access to favorable credit can slow new pool construction and thus reduce demand for our equipment and aftermarket care products. Any decline in available funding or access to our cash and liquidity resources could, among other risks, adversely impact our ability to meet our operating expenses, financial obligations or fulfill our other obligations, or result in breaches of our financial and/or contractual obligations. Any of these impacts, or any other impacts resulting from the factors described above or other similar factors, could have material adverse impacts on our liquidity and our current and/or projected business operations and financial condition and results of operations.
We maintain our cash at financial institutions in balances that may exceed federally insured limits.
The majority of our cash is held in accounts at U.S. banking institutions, and the amounts of cash held in non-interest-bearing and interest-bearing operating accounts may exceed the FDIC insurance limits. If the banking institutions we use were to fail, we could lose all or a portion of those amounts held in excess of such insurance limitations, and our ability to access such funds in a timely manner, or at all, could be limited. Any material loss or delayed receipt of cash that we may experience in the future could have an adverse effect on our ability to pay our operational expenses or make other payments and may require us to move our accounts to other banks, which could cause a temporary delay in making payments to our suppliers, vendors, and employees, and cause other operational challenges.
We are susceptible to adverse weather conditions.
Given the nature of our business, weather is one of the principal external factors affecting our business. Unseasonably cool weather or significant amounts of rainfall during the peak sales season have in the past and can in the future reduce chemical consumption in pools and spas and decrease consumer purchases of our products and services. In addition, unseasonably early or late warming trends have in the past and can in the future increase or decrease the length of the pool season and impact timing around pool openings and closings and, therefore, our total sales and timing of our sales. While warmer weather conditions favorably impact our sales, global warming trends and other significant climate changes can create more variability in the short-term or lead to other unfavorable weather conditions that could adversely impact our sales or operations and could make our operations, seasonality and sales cycles less predictable than in previous years. Drought conditions or water management initiatives sometimes lead to municipal ordinances related to water use restrictions. To the extent such restrictions result in decreased pool installations, our sales could be negatively impacted.
Certain extreme weather events, such as hurricanes and tropical storms, may become more frequent, and when such events occur, they can impact demand for our products and services, our ability to deliver our products, provide services, continue to keep our facilities open and operational, cause damage to our facilities, or impact our business in other ways. As a consequence of these or other catastrophic or uncharacteristic events, we may experience interruption to our operations, increased costs or loss of property, equipment or inventory, which would adversely affect our revenue and profitability.
Technology and Privacy Related Risks
If the technology-based systems that give our consumers the ability to shop with us online do not function effectively, our operating results, as well as our ability to grow our e-commerce business globally, could be materially adversely affected.
Many of our consumers shop with us through our physical network and digital platform, which includes our proprietary mobile app and e-commerce websites. Increasingly, consumers are using tablets and smart phones to shop online with us and with our competitors and to do comparison shopping. We are increasingly using social media and our proprietary mobile app to interact with our consumers and as a means to enhance their shopping experience. Any failure on our part to provide an attractive, effective, reliable, and user-friendly digital platform that offers a wide assortment of merchandise with rapid delivery options and that meets the changing expectations of online shoppers could place us at a competitive disadvantage, result in the loss of e-commerce and other sales, harm our reputation with consumers, have a material adverse impact on the growth of our e-commerce business globally, and could have a material adverse impact on our business and results of operations.
Our e-commerce operation faces distinct risks, such as the failure to make and implement changes to our e-commerce websites and mobile app, the failure to maintain a relevant consumer experience in understanding and interacting with our e-commerce websites and mobile app, telecommunications disruptions, reliance on third-party software technologies, and rapid changes in technology, among others. If not managed effectively, these risks could adversely impact our operating results.
A significant portion of our digital sales take place through online marketplaces and online retailers and any limitation or restriction, temporarily or otherwise, to sell on these online platforms could harm our profitability and results of operation.
Marketplace storefronts complement our platform of branded proprietary e-commerce websites. A significant portion of our digital sales take place through online marketplaces and online retailers and are subject to their terms of service and their various other policies including fees charged for transacting on the corresponding platforms. While we endeavor to materially comply with the terms of service and other policies of each online marketplace and online retailer through which we sell our products, these online marketplaces or online retailers may not have the same determination with respect to our compliance. These online marketplaces and online retailers may, in certain circumstances, refuse to continue hosting us or selling our products or temporarily suspend or discontinue our access to their online platform and any limitation or restriction (whether temporary or otherwise) on our ability to sell our products or a material change in transaction fees charged through these online platforms could harm our profitability and results of operations.
We rely on information technology systems to support our business operations. A significant disturbance or breach of our technological infrastructure could adversely affect our financial condition and results of operations. Additionally, failure to maintain the security of confidential information could damage our reputation and expose us to litigation.
Information technology supports several aspects of our business, including, among others, product sourcing, pricing, consumer service, transaction processing, financial reporting, collections, and cost management. Our ability to operate effectively on a day-to-day basis and accurately report our results depends on robust technological infrastructure, which may be susceptible to internal and external threats. We are vulnerable to interruption by fire, natural disaster, power loss, telecommunication failures, internet failures, security breaches, catastrophic events, and other significant disruptions. Exposure to various types of cyberattacks such as malware, computer viruses, worms, social engineering attacks, or other malicious acts, as well as human error and technological malfunction, could also potentially disrupt our operations or result in a significant interruption in the delivery of our goods and services.
We also may experience occasional system interruptions and delays, as a result of routine maintenance, periodic updates, or other factors, that make our information systems unavailable or slow to respond, including the interaction of our information systems with those of third parties. A lack of sophistication or reliability of our information systems could adversely impact our operations and consumer service and could require major repairs or replacements, resulting in significant costs and foregone revenue.
Our numerous procedures and protocols designed to mitigate cybersecurity risks (including processes for timely notification of appropriate personnel, for assessment and resolution of cybersecurity incidents, and for company-wide training programs, our investments in information technology security and our updates to our business continuity plan) may not prevent or effectively mitigate adverse consequences from cybersecurity risks. Any failure by us to maintain or protect our information technology systems and data integrity, including from cyberattacks, intrusions, or other breaches, could result in unauthorized access to consumer data, credit card information, and personally identifiable information, theft of intellectual property or other misappropriation of assets, or otherwise compromise our confidential or proprietary information and disrupt our operations, putting us at a competitive disadvantage. Such a breach could result in damage to our reputation and subject us to potential litigation, liability, fines, and penalties, resulting in a material adverse impact on our financial condition and results of operations.
Improper activities by third parties, exploitation of encryption technology, new data-hacking tools and discoveries, and other events or developments may result in future intrusions into or compromise of our networks, payment card terminals, or other payment systems.
We may not be able to anticipate the frequently changing techniques used to obtain unauthorized access to sensitive data or implement adequate preventive measures for all of them. Any unauthorized access into our consumers’ sensitive information, or data belonging to us or our suppliers, even if we are compliant with industry security standards, could put us at a competitive disadvantage, result in deterioration of our consumers’ confidence in us, and subject us to potential litigation, liability, fines, penalties, and consent decrees, resulting in a possible material adverse impact on our financial condition and results of operations.
As a merchant that accepts debit and credit cards for payment, we are subject to the Payment Card Industry Data Security Standard (“PCI DSS”) issued by the Payment Card Industry Council and to the American National Standards Institute (“ANSI”) data encryption standards and payment network security operating guidelines, as well as the Fair and Accurate Credit Transactions Act (“FACTA”). Failure to comply with these guidelines or standards may result in the imposition of financial penalties or the allocation by debit and
credit card companies of the costs of fraudulent charges to us. Despite our efforts to comply with these or other payment card standards and other information security measures, we cannot be certain that all of our IT systems will be able to prevent, contain, or detect all cyberattacks or intrusions from known malware or malware that may be developed in the future. To the extent that any disruption results in the loss, damage, or misappropriation of information, we may be adversely affected by claims from consumers, financial institutions, regulatory authorities, payment card associations, and others. In addition, privacy and information security laws and standards continue to evolve and could expose us to further regulatory burdens. The cost of our continued compliance with stricter laws and standards, including, among other regulations, PCI DSS, ANSI, and FACTA data encryption standards and the California Consumer Privacy Act, which took effect in January 2020, and the California Privacy Rights Act, which took effect on January 1, 2023, and the cost of complying with other state data privacy regulations that we may be subject to in the future, could be significant.
Risks Related to Our Business Strategy
We may acquire other companies or technologies, which could fail to result in a commercial product or sales, divert our management’s attention, result in additional dilution to our stockholders, and otherwise disrupt our business.
We may in the future seek to acquire or invest in businesses or technologies that we believe could complement or expand our portfolio, enhance our technical capabilities, or otherwise offer growth opportunities. We may not be able to successfully complete any acquisition we choose to pursue and we may not be able to successfully integrate any acquired business, product or technology in a cost-effective and non-disruptive manner. The pursuit of potential acquisitions may divert the attention of management and cause us to incur various costs and expenses in identifying, investigating, and pursuing suitable acquisitions, whether or not they are consummated. We may not be able to identify desirable acquisition targets or be successful in entering into an agreement with any particular target or obtain the expected benefits of any acquisition or investment. Similarly, we may not be able to successfully identify and acquire new technologies in a timely manner or at all. Acquisitions could also result in dilutive issuances of equity securities, the use of our available cash, or the incurrence of debt, which could harm our operating results. In addition, if an acquired business fails to meet our expectations, our business, financial condition, and results of operations may be negatively affected.
Changing consumer preferences and demographic shifts could materially impact the demand for pool and spa care products sold via our retail networks.
The Company’s retail and omnichannel strategy is highly dependent on demand from a mix of both DIY and DIFM customers, as well as commercial service professionals. While our growth strategy takes into account potential changes in this mix, our physical retail locations are primarily designed to cater to DIY pool and spa owners. As younger families become homeowners in greater numbers, there is the potential for their aftermarket care needs to shift from DIY to more heavily favor DIFM, meaning our physical store footprint and retail pricing strategy may become out of sync with a changing marketplace.
Our operating results will be harmed if we are unable to effectively manage and sustain our future growth or scale our operations.
We experienced a decline in sales, and thus profitability, beginning the fiscal years ending September 30, 2023, through the fiscal year ending October 4, 2025. The current declines in our revenue and operating margins means our revenue and margin growth may be less than expected. If we are unable to scale our operations efficiently or maintain pricing power and competitive pricing, we may fail to achieve expected operating margins, which would have a material and adverse effect on our operating results. Diminished growth may also stress our ability to adequately manage our operations, quality of products, safety, and regulatory compliance. If growth significantly decreases, it could negatively impact our cash reserves, and it may be necessary to obtain additional financing, which could increase indebtedness or result in dilution to shareholders. Further, we may not be able to obtain additional financing on acceptable terms, if at all.
If we are unable to streamline our operations effectively, our business, financial condition and results of operations may be adversely affected.
Our locations may not achieve the growth and profitability we anticipate, and, from time to time, we may determine to close certain locations based on a variety of factors, including, but not limited to, geographic proximity to other stores, operating cost increases, labor costs, profitability, leases and other strategic decisions. Our business strategy depends in part on our ability to streamline our operations and improve long-term profitability, including the effective implementation of our announced closure of approximately 80 to 90 underperforming U.S. locations by the end of the first fiscal quarter of 2026. Our ability to successfully close those locations, or other future locations as appropriate to operate efficiently, depends on a number of factors beyond our control, including without limitation, general economic conditions, prevailing conditions in the commercial real estate market, success in amending or terminating existing leases on acceptable terms, availability of suitable alternative locations and other factors. If we are unable to optimize our location base by closing the number of underperforming locations we expect, on the timeline we expect, or if we are unable to transfer these existing
store customers to our other sales channels or if we announce additional store closures in the future, our business, financial condition and results of operations may be adversely affected.
In addition, we expect to incur costs associated with the closure of underperforming locations, including charges for the impairment of long-lived assets and inventory write-offs. These costs may turn out to be greater than we expect and may adversely impact our financial condition.
Our aspirations and disclosures related to sustainability matters expose us to risks that could adversely affect our reputation and performance.
We have established and publicly announced various sustainability goals. These statements reflect our current plans and aspirations and do not guarantee that we will be able to achieve them.
Our ability to achieve any sustainability objective is subject to numerous risks, many of which are outside of our control. Additionally, standards for tracking and reporting sustainability matters continue to evolve and vary. Our selection of voluntary disclosure frameworks and standards, and the interpretation or application of those frameworks and standards, may change from time -to-time or differ from those of others. This may result in a lack of consistent or meaningful comparative data from period to period or between us and other companies in the same industry.
In addition, our processes and controls may not comply with evolving standards for identifying, measuring, and reporting sustainability metrics, including sustainability -related disclosures that may be required of companies by U.S. federal or state governments and other regulators, and such standards may change over time, which could result in significant revisions to our existing processes and controls, reporting, and current goals, reported progress in achieving such goals, or ability to achieve such goals in the future.
Our sustainability practices may not satisfy all investor or other stakeholder expectations and standards, which are evolving and varied and may not align with our sustainability strategy. As a result, our reputation, our ability to attract or retain employees, and our attractiveness as an investment or partner could be negatively impacted. Further, our success, failure or perceived failure to pursue, track report or fulfill our goals and objectives or to satisfy various reporting standards on a timely basis, or at all, could adversely affect our reputation, financial performance, and growth, and expose us to increased scrutiny, review, or litigation from our stakeholders, including the investment community, media outlets (including social media) and enforcement authorities.
Risks Related to the Manufacturing, Processing, and Supply of Our Products
Our business includes the packaging and storage of chemicals and an accident related to these chemicals could subject us to liability and increased costs.
We operate chemical repackaging and manufacturing facilities and we store chemicals in our locations and in our distribution facilities. Because some of the chemicals we repackage, manufacture and store are hazardous materials, we must comply with various fire and safety ordinances. However, a release at a location or a fire at one of our facilities could give rise to liability claims against us and potential environmental liability. In addition, if an incident involves a repackaging, manufacturing or distribution facility, we might be required temporarily to use alternate sources of supply that could increase our cost of sales.
We cannot guarantee that our insurance coverage will be adequate to cover future claims that may arise or that we will be able to maintain adequate insurance in the future at rates we consider reasonable. Successful claims for which we are not fully insured may adversely affect our working capital and profitability. In addition, changes in the insurance industry have generally led to higher insurance costs and decreased availability of coverage.
Notwithstanding our internal training curriculum and compliance programs, we cannot guarantee that our employees will follow the applicable operating procedures and regulations, or that no accidents or incidents will arise that could expose us to liability and have a negative impact on our operations and results.
Product supply disruptions may have an adverse effect on our profitability and operating results.
We rely on various suppliers and vendors to provide and deliver product inventory on a continuous basis, some of which are located outside of the United States. These suppliers (and those they depend upon for materials and services) are subject to risks, including from natural or man-made disasters or extreme weather (including as a result of climate change), public health and safety issues, geopolitical events and conflicts (including terrorist attacks and armed hostilities), power outages, labor or trade disputes, union organizing activities, disruption to transportation routes, changes in tariffs or duties imposed on imported products or raw materials, financial liquidity
problems, and similar events, as well as supply constraints and general economic, social, and political conditions that can limit their ability to provide us (or our suppliers) with quality products and services in a timely manner and at reasonable cost. The occurrence of these or other unexpected events can cause us to suffer significant product inventory losses, and significant lost revenue, and increased cost of sales. For example, recent and potential changes to U.S. trade policies, particularly escalating tariff exchanges with China and other countries, have disrupted supply chains and increased costs, potentially creating unpredictable customer spending patterns and economic uncertainty that could, directly or indirectly, significantly impact business operations, financial conditions, and results in ways difficult to anticipate or mitigate.
The cost of raw materials could increase our cost of goods sold and cause our results of operations and financial condition to suffer.
Our principal chemical raw materials are granular chlorine compounds, which are commodity materials. The prices of granular chlorine compounds are a function of, among other things, manufacturing capacity and demand. In the past, we have generally been able to pass along chlorine price increases to our consumers. However should the price of granular chlorine compounds increase in the future, we may not be able to pass on any such increase to our consumers. We purchase granular chlorine compounds primarily from the nation’s largest suppliers. The alternate sources of supply we currently view as reliable may ultimately be unable to supply us with all of our raw materials and finished goods, including chlorine products. Additionally, significant price fluctuations or shortages in raw materials needed for our products have increased our cost of goods sold for certain products and may cause our results of operations and financial condition to suffer. For example, during times of highly unstable supply of granular chlorine compounds we believe some customers stockpile chemicals, resulting in unexpected changes in demand. As a result of such behavior, our revenue is higher than normal during periods of stockpiling and lower than normal during the period after stockpiling has occurred. We believe that consumer stockpiling of chemicals may have negatively impacted our results of operations in fiscal 2023 and may impact us in future periods.
Risks Related to Commercialization of Our Products
Even if we are able to attain significant market acceptance of our planned or future products or services, the commercial success of our planned or future products is not guaranteed.
Our future financial success will depend substantially on our ability to effectively and profitably market and sell our planned and future products and services on a sustained basis, which ability is dependent on a number of additional and/or unpredictable factors. Successful growth of our sales and marketing efforts will depend on the strength of our marketing infrastructure and the effectiveness of our sales and marketing strategies, as well as our ability to forecast demand. Our ability to satisfy product demand driven by our sales and marketing efforts will be largely dependent on the ability to maintain a commercially viable manufacturing process that is compliant with regulatory standards. If we fail to market and sell our planned or future products or services successfully, we will not be able to achieve profitability, which could have a material adverse effect on our business, financial condition, and results of operations.
We may implement a product recall or voluntary market withdrawal, which could significantly increase our costs, damage our reputation, and disrupt our business.
The manufacturing, packaging, marketing, and processing of our products involves an inherent risk that our processes do not meet applicable quality standards and requirements. In that event, we may voluntarily implement a recall or market withdrawal or may be required to do so by a regulatory authority. A recall or market withdrawal of one of our products would be costly and would divert management resources. A recall or withdrawal of one of our products, or a similar product processed by another entity, also could impair sales of our products because of confusion concerning the scope of the recall or withdrawal, or because of the damage to our reputation for quality and safety.
If we do not manage product inventory in an effective and efficient manner, it could adversely affect profitability.
Many factors affect the efficient use and planning of product inventory, such as effectiveness of predicting demand, preparing manufacturing to meet demand, meeting product mix and product demand requirements, and managing product expiration. We have in the past and may in the future be unable to manage our inventory efficiently, keep inventory within expected budget goals, keep our work-in-process inventory on hand or manage it efficiently, control expired product, or keep sufficient product on hand to meet demand. We may not be able to keep inventory costs within our target levels. Failure to do so can harm our profitability and long-term growth prospects.
Any significant interruption to the operations of our distribution centers could affect our ability to distribute our products in a timely manner, which could adversely impact our business and financial condition.
We utilize a national network consisting of a mix of company-operated distribution centers as well as third-party operated distribution centers to manage the receipt, storage, sorting, packing and distribution of our merchandise to appropriate stores or to customers directly. We depend in large part on the orderly operation of our receiving and distribution process, which depends, in turn, on adherence to shipping schedules, proper functioning of our information technology and inventory control systems and, the overall effective management of such distribution centers. Work stoppages, labor shortages, operations below historical efficiency levels, supply chain disruptions, inclement weather, or other unforeseen events in the areas or regions in which these distribution centers operate could impair our ability to adequately stock our stores, ship products to our e-commerce customers, process returns of products, and may adversely affect our sales and profitability.
If we do not continue to obtain favorable purchase terms with manufacturers, it could adversely affect our operating results.
Most of the raw materials that go into our products, and products not repackaged by us, are purchased directly from manufacturers. It is common in the swimming pool supply industry for certain manufacturers to offer extended payment terms on certain products to volume purchasers like us. These payment terms typically include favorable pricing and are available to us for pre-season or early season purchases so that we are able to meet anticipated demand each year. However, if we do not continue to maintain such favorable purchase terms with manufacturers, it could adversely affect our operating results.
We depend on a network of suppliers to source our products, including our own branded products. Product quality, warranty claims, or safety concerns could negatively impact our sales and expose us to litigation.
We rely on manufacturers and other suppliers to provide us with the products we sell. As we increase the number of branded products we sell, our exposure to potential liability claims may increase. Product and service quality issues could negatively impact consumer confidence in our brands and our business. If our product and service offerings do not meet applicable safety standards or our consumers’ expectations regarding safety or quality, we could experience lost sales and increased costs and be exposed to legal, financial, and reputational risks, as well as governmental enforcement actions. Actual, potential, or perceived product safety concerns, including health-related concerns, could expose us to litigation, as well as government enforcement actions, and result in costly product recalls and other liabilities.
In addition, if our products are defectively designed, manufactured, or labeled, contain defective components or are misused, we may become subject to costly litigation initiated by consumers. Product liability claims could harm our reputation, divert management’s attention from our core business, be expensive to defend, and may result in sizable damage awards against us. Although we maintain product liability insurance, we may not have sufficient insurance coverage for future product liability claims. We may not be able to obtain insurance in amounts or scope sufficient to provide us with adequate coverage against all potential liabilities. Any product liability claims brought against us, with or without merit, could increase our product liability insurance rates or prevent us from securing continuing coverage, harm our reputation, significantly increase our expenses, and reduce product sales. Product liability claims could cause us to incur significant legal fees and deductibles and claims in excess of our insurance coverage would be paid out of cash reserves, harming our financial condition and operating results. In addition, successful product liability claims made against one of our competitors could cause claims to be made against us or expose us to a perception that we are vulnerable to similar claims. Claims against us, regardless of their merit or potential outcome, may also hurt our ability to obtain acceptance of our products or to expand our business.
Risks Related to Government Regulation
The nature of our business subjects us to compliance with employment, environmental, health, transportation, safety, and other governmental regulations.
We are subject to federal, state, and local laws and regulations relating to matters such as product labeling, weights and measures, zoning, land use, environmental protection, local fire codes, and workplace safety, including regulation by the Environmental Protection Agency, the Consumer Product Safety Commission, the Department of Transportation, the Occupational Safety and Health Administration, and the National Fire Protection Agency and corresponding state and local authorities. Most of these requirements govern the packaging, labeling, handling, transportation, storage, disposal, and sale of chemicals. We store certain types of chemicals at each of our locations and the storage of these items is strictly regulated by local fire codes. In addition, we sell algaecides and related products that are regulated under the Federal Insecticide, Fungicide and Rodenticide Act, and various state pesticide laws. These laws primarily relate to labeling, annual registration, and licensing.
Compliance with new and proposed sustainability disclosure requirements, including on the U.S. federal or state level, could require significant effort and divert management’s attention and resources, which could adversely affect our operating results. We are also subject to evolving data privacy and cybersecurity laws and regulations (including applicable standards), compliance with which may also increase our costs of doing business.
Management has processes in place to facilitate and support our compliance with these requirements. However, failure to comply with these laws and regulations, which have become increasingly varied in different regions in which we operate, may result in investigations, the assessment of administrative, civil and criminal fines, damages, seizures, disgorgements, penalties, or the imposition of injunctive relief. Moreover, compliance with such laws and regulations in the future could prove to be costly. Although we presently do not expect to incur any material capital or other expenditures relating to regulatory matters we may be required to make such expenditures in the future. These laws and regulations have changed substantially and rapidly in recent years, and we anticipate that there will be continuing changes.
There has been a general trend in environmental, health, transportation, and safety regulations to place more restrictions and limitations on activities that impact the environment, such as the use and handling of chemicals. Increasingly, strict restrictions and limitations have resulted in higher operating costs for us and it is possible that the costs of compliance with such laws and regulations will continue to increase. Our attempts to anticipate future regulatory requirements that might be imposed and our plans to remain in compliance with changing regulations and to minimize the costs of such compliance may not be as effective as we anticipate.
Risks Related to Intellectual Property Matters
If we are unable to adequately protect our intellectual property rights, our competitive position could be harmed, we may not be able to build name recognition in our markets of interest, or we could be required to incur significant expenses to enforce or defend our rights.
In the course of our business, we employ various trademarks, trade names, and service marks as well as our logo in packaging and advertising of our products. Our commercial success depends in part on our success in obtaining and maintaining issued trademarks, trade names, and service marks in the United States and protecting our proprietary technology. If we do not adequately protect our intellectual property and proprietary technology, competitors may be able to use our technologies or the goodwill we have acquired in the marketplace and erode or negate any competitive advantage we may have, which could harm our business and ability to achieve profitability.
Our ability to enforce our intellectual property rights depends on our ability to detect infringement. It may be difficult to detect infringers who do not advertise the components that are used in their products. Moreover, it may be difficult or impossible to obtain evidence of infringement in a competitor’s or potential competitor’s product. We may not prevail in any lawsuits that we initiate and the damages or other remedies awarded if we were to prevail may not be commercially meaningful.
If our trademarks and trade names are not adequately protected, we may not be able to build name recognition in our target markets and our business may be adversely affected. At times, competitors may adopt trade names or trademarks similar to ours, thereby impeding our ability to build brand identity, possibly leading to market confusion and potentially requiring us to pursue legal action. In addition, there could be potential trade name or trademark infringement claims brought by owners of other registered trademarks or trademarks that incorporate variations of our unregistered trademarks or trade names. If we are unable to successfully register our trademarks and trade names and establish name recognition based on our trademarks and trade names, then we may not be able to compete effectively and our business may be adversely affected. Our efforts to enforce or protect our proprietary rights related to trademarks, domain names, copyrights, or other intellectual property may be ineffective and could result in substantial costs and diversion of resources and could adversely impact our financial condition or results of operations.
Our success depends in part on our ability to operate without infringing on or misappropriating the proprietary rights of others, and if we are unable to do so we may be liable for damages.
We cannot be certain that United States or foreign patents or patent applications of other companies do not exist or will not be issued that would prevent us from commercializing our products. Third parties may sue us for infringing or misappropriating their patent or other intellectual property rights. Intellectual property litigation is costly. If we do not prevail in litigation, in addition to any damages we might have to pay, we could be required to cease the infringing activity or obtain a license requiring us to make royalty payments. It is possible that a required license may not be available to us on commercially acceptable terms, if at all. In addition, a required license may be non-exclusive, and therefore our competitors may have access to the same technology licensed to us. If we fail to obtain a required license or are unable to design around another company’s patent, we may be unable to make use of some of the affected products, which would reduce our revenues.
The defense costs and settlements for patent infringement lawsuits are not covered by insurance. Patent infringement lawsuits can take years to settle. If we are not successful in our defense of or are not successful in obtaining dismissals of any such lawsuit, legal fees or settlement costs could have a material adverse effect on our results of operations and financial position.
Risks Related to Our Indebtedness
Our substantial indebtedness could materially adversely affect our financial condition and our ability to operate our business, react to changes in the economy or industry or pay our debts and meet our obligations under our debt agreements, and could divert our cash flow from operations to debt payments.
We have a substantial amount of indebtedness. As of December 5, 2025, our total borrowings under our Amended and Restated Term Loan Credit Agreement (the “Term Loan”) and our $250.0 million credit facility (the “Revolving Credit Facility” and together with the Term Loan, the “Credit Facilities”) was $756.7 million. Subject to restrictions in the agreements governing our debt, it is possible that we may incur additional debt.
Our substantial debt could have important consequences to our stockholders, including but not limited to the following:
•it may be difficult for us to satisfy our obligations, including debt service requirements under our existing or future debt agreements, resulting in possible defaults on and acceleration of such debt;
•our ability to obtain additional financing for working capital, capital expenditures, debt service requirements, or other general corporate purposes may be impaired;
•a substantial portion of cash flow from operations may be dedicated to the payment of principal and interest on our debt, therefore reducing our ability to use our cash flow to fund our operations, capital expenditures, future business opportunities, and acquisitions or for other purposes;
•we are more vulnerable to economic downturns and adverse industry conditions and our flexibility to plan for, or react to, changes in our business or industry is more limited;
•our ability to capitalize on business opportunities and to react to competitive pressures, as compared to our competitors, may be compromised due to our high level of debt and restrictive covenants contained in the agreements governing our existing and any future debt; and
•our ability to borrow additional funds or to refinance debt may be limited.
Our credit rating was recently downgraded, and there is a risk of further downgrades in the future. Credit rating downgrades have and may continue to adversely affect our ability to access capital markets, increase our borrowing costs, limit our financing options, and reduce our financial flexibility. Lower credit ratings may also result in more stringent covenants in our debt agreements, require us to provide additional collateral for existing obligations, trigger early repayment obligations under certain of our debt instruments, or limit our ability to refinance existing debt on favorable terms. Given our substantial indebtedness, these impacts could further constrain our operational flexibility, intensify the risks associated with our leverage, exacerbate our vulnerability to economic downturns, and adversely affect our liquidity, financial condition, and ability to fund operations, capital expenditures, and strategic initiatives.
Furthermore, all of our debt under our Credit Facilities bears interest at variable rates. If these rates were to increase significantly, our ability to borrow additional funds may be reduced and the risks related to our substantial debt would intensify.
Servicing our debt requires a significant amount of cash. Our ability to generate sufficient cash depends on numerous factors beyond our control, and we may be unable to generate sufficient cash flow to service our debt obligations.
Our business may not generate sufficient cash flow from operating activities to service our debt obligations. Our ability to make payments on and to refinance our debt and to fund planned capital expenditures depends on our ability to generate cash in the future. To some extent, this is subject to general economic, financial, competitive, legislative, regulatory, and other factors that are beyond our control.
If we are unable to generate sufficient cash flow from operations to service our debt and meet our other commitments, we may need to refinance all or a portion of our debt, sell material assets or operations, delay capital expenditures, or raise additional debt or equity capital. We may not be able to effect any of these actions on a timely basis, on commercially reasonable terms or at all, and these actions may not be sufficient to meet our capital requirements. In addition, the terms of our existing or future debt agreements may restrict us from pursuing any of these alternatives.
Restrictive covenants in the agreements governing our Credit Facilities may restrict our ability to pursue our business strategies, and failure to comply with any of these restrictions could result in acceleration of our debt.
The operating and financial restrictions and covenants in the agreements governing our Credit Facilities may materially adversely affect our ability to finance future operations or capital needs or to engage in other business activities. Such agreements limit our ability, among other things, to:
•incur additional debt or issue certain preferred shares;
•pay dividends on or make distributions in respect of our common stock or make other restricted payments;
•make certain investments;
•consolidate, merge, sell, or otherwise dispose of our assets;
•make certain payments in respect of certain debt obligations;
•enter into certain transactions with our affiliates; and
•designate our subsidiaries as unrestricted subsidiaries.
A breach of any of these covenants could result in an event of default under our Credit Facilities. Upon the occurrence of an event of default under any of our Credit Facilities, the lenders could elect to declare all amounts outstanding under our Credit Facilities to be immediately due and payable and terminate all commitments to extend further credit. If we were unable to repay those amounts, the lenders under our Credit Facilities could proceed against the collateral granted to them to secure the debt under the Credit Facilities. We have pledged substantially all of our assets as collateral to secure our Credit Facilities. Our future operating results may not be sufficient to enable compliance with our Credit Facilities, and we may not have sufficient assets to repay amounts outstanding under our Credit Facilities. In addition, in the event of an acceleration of our debt upon an event of default, we may not have or be able to obtain sufficient funds to make any accelerated payments.
Furthermore, the terms of any future debt we may incur could have further additional restrictive covenants. We may not be able to maintain compliance with these covenants in the future, and in the event that we are not able to maintain compliance, we cannot assure you that we will be able to obtain waivers from the lenders or amend the covenants.
Despite current debt levels, we and our subsidiaries may still be able to incur substantially more debt. This could further exacerbate the risks associated with our substantial leverage.
We and our subsidiaries may be able to incur substantial additional debt in the future. Although the agreements governing our Credit Facilities contain restrictions on the incurrence of additional debt, these restrictions are subject to a number of qualifications and exceptions, and the debt incurred in compliance with these restrictions could be substantial. Additionally, we may successfully obtain waivers of these restrictions. If we incur additional debt above the levels currently in effect, the risks associated with our leverage, including those described above, would increase.
Risks Related to Ownership of Our Common Stock
Our stock price may be volatile or may decline regardless of our operating performance, resulting in substantial losses for investors.
The market price of our common stock has fluctuated upwards and downwards significantly in the past and is likely to be volatile in the future in response to numerous factors, many of which are beyond our control, including:
•actual or anticipated fluctuations in our results of operations;
•the financial projections we may provide to the public, any changes in these projections, or our failure to meet these projections;
•failure of securities analysts to initiate or maintain coverage of us, changes in financial estimates or ratings or negative reports by any securities analysts who follow us or our failure to meet these estimates or the expectations of investors;
•announcements by us or our competitors of significant technical innovations, acquisitions, strategic partnerships, joint ventures, results of operations, or capital commitments;
•changes in operating performance and stock market valuations of other retail companies generally, or those in our industry in particular;
•price and volume fluctuations in the overall stock market, including as a result of trends in the economy as a whole;
•changes in our board of directors or management;
•sales of large blocks of our common stock, including sales by our executive officers or directors;
•lawsuits threatened or filed against us;
•changes in laws or regulations applicable to our business;
•changes in our capital structure, such as future issuances of debt or equity securities;
•short sales, hedging, and other derivative transactions involving our capital stock;
•our performance with respect to sustainability and other issues impacting our reputation;
•general economic conditions in the United States, including high interest rates, inflationary pressures, and recession fears (including as a result of recent liquidity and financial stability concerns with respect to banks and financial institutions);
•other events or factors, including those resulting from war, incidents of terrorism, pandemics, or other public health emergencies or responses to these events; and
•other factors described in this section and “Cautionary Note Regarding Forward-Looking Statements.”
As a result of this volatility, payouts under, as well as the incentive value of, our stock-based compensation arrangements for employees can fluctuate and investors may experience losses on their investment in our common stock.
An active trading market for our common stock may not be sustained.
Although our common stock is traded on the Nasdaq under the symbol “LESL”, there is a limited trading history on an active trading market for our common stock, which may not be sustained. Accordingly, no assurance can be given as to the following:
•the likelihood that an active trading market for our common stock will be sustained;
•the liquidity of any such market;
•the ability of our stockholders to sell their shares of common stock; or
•the price of our stockholders may obtain for their common stock.
If an active market for our common stock with meaningful trading volume is not maintained, the market price of our common stock may decline materially. Consequently, stockholders may not be able to sell our common stock at prices equal to or greater than the price paid.
Future sales of common stock by existing stockholders could cause our stock price to decline.
If our existing stockholders sell, or indicate an intention to sell, substantial amounts of our common stock in the public market the trading price of our common stock could be adversely impacted. As of December 5, 2025, we had 9,290,311 shares of common stock outstanding. All such shares are eligible for resale in the public market, subject to applicable securities laws, including the Securities Exchange Act of 1934, as amended (the “Exchange Act”). The trading price of our common stock could be adversely impacted if any of these certain significant stockholders sell, or indicate an intention to sell, substantial amounts of our common stock in the public market.
Transactions engaged in by our principal stockholders, our officers, or directors involving our common stock may have an adverse effect on the price of our stock.
Sales of our shares by our officers, directors, and principal stockholders could have the effect of lowering our stock price. The perceived risk associated with the possible sale of a large number of shares by these stockholders, or the adoption of significant short positions by hedge funds or other significant investors, could cause some of our stockholders to sell their stock, thus causing the price of our stock to decline. In addition, actual or anticipated downward pressure on our stock price due to actual or anticipated sales of stock by our
directors or officers could cause other institutions or individuals to engage in short sales of our common stock, which may further cause the price of our stock to decline.
From time to time, our directors and executive officers may sell shares of our common stock on the open market. These sales will be publicly disclosed in filings made with the SEC. In the future, our directors and executive officers may sell a significant number of shares for a variety of reasons unrelated to the performance of our business. Our stockholders may perceive these sales as a reflection on management’s view of the business and result in some stockholders selling their shares of our common stock. These sales could cause the price of our stock to drop.
We do not intend to pay dividends for the foreseeable future.
We currently intend to retain any future earnings to finance the operation and expansion of our business and we do not expect to declare or pay any dividends in the foreseeable future. As a result, stockholders must rely on sales of their common stock after price appreciation as the only way to realize any future gains on their investment.
Anti-takeover provisions in our charter documents and under Delaware law could make an acquisition of us more difficult, limit attempts by our stockholders to replace or remove our current management, and limit the market price of our common stock.
Provisions in our certificate of incorporation and bylaws may have the effect of delaying or preventing a change of control or changes in our management. Our amended and restated certificate of incorporation and amended and restated bylaws include provisions that:
•permit the board of directors to establish the number of directors and fill any vacancies and newly created directorships;
•provide that a director may be removed only for cause and only by the affirmative vote of the holders of at least 66 2/3% in voting power of all the then-outstanding shares of stock of the Company entitled to vote thereon, voting together as a single class;
•provide that the affirmative vote of the holders of at least 66 2/3% in voting power of all the then-outstanding shares of stock of the Company entitled to vote thereon, voting together as a single class, is required in order to amend certain provisions of our seventh amended and restated certificate of incorporation regarding the amendment of our seventh amended and restated certificate of incorporation, the composition and authority of our board of directors, the election and removal of directors, limitations of director liability, stockholder meetings, corporate opportunities, choice of forum and the interpretation of our seventh amended and restated certificate of incorporation;
•authorize the board of directors to amend our bylaws without the assent or vote of shareholders, provided that stockholders may amend the bylaws with the affirmative vote of the holders of at least 66 2/3% in voting power of all the then-outstanding shares of stock of the Company entitled to vote thereon, voting together as a single class;
•with the exception of actions required or permitted to be taken by the holders of preferred stock, prohibit stockholder action by written consent, instead requiring stockholder actions to be taken at a meeting of our stockholders;
•permit our board of directors, without further action by our stockholders, to fix the rights, preferences, privileges, and restrictions of preferred stock, the rights of which may be greater than the rights of our common stock;
•restrict the forum for certain litigation against us to Delaware; and
•establish advance notice requirements for nominations for election to our board of directors or for proposing matters that can be acted upon by stockholders at annual stockholder meetings.
These provisions may frustrate or prevent any attempts by our stockholders to replace or remove our current management by making it more difficult for stockholders to replace members of our board of directors, which is responsible for appointing the members of our management. As a result, these provisions may adversely affect the market price and market for our common stock if they are viewed as limiting the liquidity of our stock or as discouraging takeover attempts in the future.
The provision of our seventh amended and restated certificate of incorporation, requiring exclusive forum in certain courts in the State of Delaware or the federal district court for the District of Delaware for certain types of lawsuits, may have the effect of discouraging lawsuits against our directors and officers.
Our seventh amended and restated certificate of incorporation requires, to the fullest extent permitted by law, that (i) any derivative action or proceeding brought on our behalf, (ii) any action asserting a claim of breach of a fiduciary duty owed by any of our directors, officers, or other employees or stockholders to us or our stockholders, creditors or other constituents, or a claim of aiding and abetting any such breach of fiduciary duty, (iii) any action asserting a claim against us or our directors or officers arising pursuant to any provision of the Delaware General Corporation Law (“DGCL”) or our seventh amended and restated certificate of incorporation or our amended and restated bylaws or as to which the DGCL confers jurisdiction on the Court of Chancery of the State of Delaware, (iv) any action to interpret, apply, enforce or determine the validity of our seventh amended and restated certificate of incorporation or amended and restated bylaws, (v) any action asserting a claim against us or our directors or officers governed by the internal affairs doctrine or (vi) any action asserting an “internal corporate claim” as that term is defined in Section 115 of the DGCL will have to be brought only in the Court of Chancery of the State of Delaware (or if the Court of Chancery of the State of Delaware lacks subject matter jurisdiction, any other state court of the State of Delaware, or if no state court of the State of Delaware has subject matter jurisdiction, the federal district court for the District of Delaware), unless we consent in writing to the selection of an alternative forum. The foregoing provision will not apply to claims arising under the Exchange Act or the Securities Act of 1933, as amended (the “Securities Act”). Unless we consent in writing to the selection of an alternative forum, the federal district court for the District of Delaware shall be, to the fullest extent permitted by law, the exclusive forum for the resolution of any complaint asserting a cause of action arising under the Securities Act against us or any of our directors or officers. Although we believe these exclusive forum provisions benefit us by providing increased consistency in the application of Delaware law and federal securities laws in the types of lawsuits to which each applies, the exclusive forum provisions may limit a stockholder’s ability to bring a claim in a judicial forum that it finds favorable for disputes with us or any of our directors, officers, or stockholders, which may discourage lawsuits with respect to such claims. Our stockholders will not be deemed to have waived our compliance with the federal securities laws and the rules and regulations thereunder as a result of our exclusive forum provisions. Further, in the event a court finds either exclusive forum provision contained in our seventh amended and restated certificate of incorporation to be unenforceable or inapplicable in an action, we may incur additional costs associated with resolving such action in other jurisdictions, which could harm our business, operating results, and financial condition.
We will continue to incur increased costs as a result of being a public company, and our management will continue to be required to devote substantial time to compliance with our public company responsibilities and corporate governance practices.
As a company with publicly traded securities, we incur greater costs associated with corporate governance requirements that are applicable to us as a public company, including rules and regulations of the SEC, under the Sarbanes-Oxley Act of 2002 (“Sarbanes-Oxley Act”), the Dodd-Frank Wall Street Reform and Consumer Protection Act of 2010, the Exchange Act, as well as the Nasdaq listing requirements. These rules and regulations significantly increase our accounting, legal, and financial compliance costs and make some activities more time-consuming. These rules and regulations make it more expensive for us to maintain directors’ and officers’ liability insurance. As a result, it may be more difficult for us to attract and retain qualified persons to serve on our board of directors or as executive officers. Furthermore, these rules and regulations will continue to increase our legal and financial compliance costs and will make some activities more time-consuming and costly. We cannot predict or estimate the amount of additional costs we will continue to incur as a public company or the timing of such costs. Accordingly, increases in costs incurred as a result of being a publicly traded company may adversely affect our business, financial condition, and results of operations.
Our common stock may be delisted from The Nasdaq Global Select Market if we are unable to maintain compliance with Nasdaq's continued listing standards.
As previously disclosed, on April 24, 2025, we received notification from Nasdaq indicating that our common stock was subject to potential delisting from The Nasdaq Global Select Market because we were not in compliance with the requirement to maintain a minimum bid price of at least $1.00 (the “Bid Price Rule”). On September 26, 2025, we effected a 1-for-20 reverse stock split, and our common stock began trading on a reverse stock split-adjusted basis as of the open of trading on September 29, 2025. On October 14, 2025, we received a letter from the Listing Qualification Department (the “Staff”) of Nasdaq notifying us that we had regained compliance with the Bid Price Rule.
However, there can be no assurance that we will be able to maintain compliance with Nasdaq’s continued listing standards. If we do not maintain compliance with these standards, our common stock may be delisted from Nasdaq. Any delisting of our common stock would likely adversely affect the market liquidity and market price of our common stock and our ability to obtain financing for the continuation of our operations. Consequently, stockholders may not be able to sell our common stock at prices equal to or greater than the price paid.
We have identified material weaknesses in our internal control over financial reporting. If we are unable to remediate these material weaknesses, or if we experience additional material weaknesses or other deficiencies in the future or otherwise fail to maintain an
effective system of internal control over financial reporting, we may not be able to accurately or timely report our financial results, in which case our business may be harmed, investors may lose confidence in the accuracy and completeness of our financial reports, and our stock price could be adversely affected.
Our management is responsible for establishing and maintaining adequate internal control over financial reporting and for evaluating and reporting on the effectiveness of our system of internal control. As a public company, we are also required by Section 404 of the Sarbanes-Oxley Act to evaluate the effectiveness of our internal control over financial reporting. We must also include a report issued by our independent registered public accounting firm based on their audit of our internal control over financial reporting.
In connection with our year-end assessment of internal control over financial reporting as part of this Annual Report on Form 10-K as of October 4, 2025 and September 28, 2024, we did not maintain effective internal control over financial reporting. For a discussion of our internal control over financial reporting and description of the identified material weaknesses and our remedial efforts, see Item 9A, Controls and Procedures of this Annual Report.
Completion of remediation does not provide assurance that our remediation or other controls will continue to operate properly. If we are unable to maintain effective internal control over financial reporting or disclosure controls and procedures, our ability to record, process and report financial information accurately, and to prepare financial statements within required time periods could be adversely affected, which could subject us to litigation or investigations requiring management resources and payment of legal and other expenses, negatively affect investor confidence in our financial statements and adversely impact our stock price.
Any failure to maintain internal control over financial reporting could severely inhibit our ability to accurately report our financial condition or results of operations. The effectiveness of our controls and procedures may be limited by a variety of factors, including:
•faulty human judgment and simple errors, omissions, or mistakes;
•fraudulent action of an individual or collusion of two or more people;
•inappropriate management override of procedures; and
•the possibility that any enhancements to controls and procedures may still not be adequate to assure timely and accurate financial control.
Our ability to comply with the annual internal control report requirements will depend on the effectiveness of our financial reporting and data systems and controls across our Company. We expect the modification, enhancement, or replacement of these systems and controls to involve significant expenditures and to become increasingly complex as our business grows. To effectively manage this complexity, we will need to continue to improve our operational, financial, and management controls, and our reporting systems and procedures. Our inability to successfully remediate our existing or any future material weaknesses or other deficiencies in our internal control over financial reporting or any failure to implement required new or improved controls, or difficulties encountered in the implementation or operation of these controls, could harm our operating results and cause us to fail to meet our financial reporting obligations or result in material misstatements in our financial statements, which could limit our liquidity and access to capital markets, adversely affect our business and investor confidence in us, and reduce our stock price.
None.
Item 1C. Cybersecurity
We have implemented and continue to maintain a robust cybersecurity program intended to assess, identify, and manage risks from cybersecurity threats that may result in material adverse effects on the confidentiality, integrity, and availability of our information systems and the data residing therein.
Our board of directors, with assistance from the audit committee, oversees the Company’s management of risks arising from cybersecurity threats. The audit committee regularly reviews the measures implemented by the Company to help identify and mitigate risks from cybersecurity threats. As part of such reviews, the audit committee receives reports and presentations from the CIO and members of our team responsible for overseeing the Company’s cybersecurity risk management, including our legal team, which may address a wide range of topics. This includes recent developments, evolving standards, vulnerability assessments, third-party and independent reviews, the threat environment, compliance, privacy, technological trends and information security considerations arising with respect to the Company’s peers and third parties. The audit committee also reports to the board of directors at least annually on cybersecurity matters.
We have an incident response plan under which certain cybersecurity incidents are escalated within the Company to senior executives on the cybersecurity risk management committee, and, where appropriate, reported to the board of directors and audit committee in a timely manner. At the management level, our cybersecurity risk management committee, comprised of senior executives representing functional and business areas, including our legal team, has broad oversight of the Company’s risk management processes. Members of the Company’s cybersecurity risk management committee includes certain IT leadership and the General Counsel. The committee meets regularly to discuss the risk management measures implemented by the Company to help identify and mitigate data protection and cyber security risks. Certain IT leadership and the General Counsel attend each cybersecurity risk management committee meeting to report on ongoing cybersecurity matters. Our IT leadership also works closely with our legal team to oversee compliance with legal, regulatory and contractual security requirements.
Our CIO, Vice President of Infrastructure and Security, IT Security Director, and cybersecurity engineers have knowledge and experience to effectively implement, monitor, and maintain our cybersecurity posture. This team receives reports on cybersecurity threats from various business teams, and in conjunction with management, regularly reviews risk management measures implemented by the Company to help identify and mitigate data protection and cybersecurity risks.
Our cybersecurity processes include automated tools and technical safeguards managed and monitored by our cybersecurity team and include mechanisms, controls, technologies, systems, and other processes designed to prevent or mitigate data loss, theft, misuse, or other security incidents or vulnerabilities affecting the data and maintain a stable information technology environment. For example, we regularly conduct penetration and vulnerability testing, security audits, and tabletop exercises. We conduct regular employee training on cybersecurity and provide management reports to monitor training effectiveness. We also employ systems and processes designed to oversee, identify, and reduce the potential impact of a security incident at a third-party vendor, service provider or customer that otherwise implicates third-party technology and systems we use. In addition, we consult with outside advisors and experts, when appropriate, to assist with assessing, identifying, and managing cybersecurity risks, including to anticipate future threats and trends, and their impact on the Company’s risk environment.
Cybersecurity threats continue to evolve. We consider cybersecurity threats along with other significant risks that we face within our overall enterprise risk management framework. In the last fiscal year, we have not identified risks from known cybersecurity threats, including as a result of any prior cybersecurity incidents, that have materially affected us. However, cybersecurity attack techniques change frequently, and with increased volume and sophistication of such attacks, there can be no guarantee that we will not be the subject of future successful attacks, threats or incidents that could materially affect us.
Additional information on cybersecurity risks we face can be found in Part I, Item 1A “Risk Factors” of this Annual Report on Form 10-K.
Item 2. Properties.
Properties
As of October 4, 2025 we had over 1,000 locations in 39 states, two manufacturing facilities, and six distribution centers supporting our residential locations. In addition, we contract with third-party logistic providers under short-term agreements for additional capacity as needed. Most of our locations operate on five-year leases, which offer significant flexibility as they can be located in a variety of venues, including strip centers, lifestyle centers, and shopping centers. Our current physical network of store locations is summarized in the chart below:
|
|
|
|
|
State |
|
Number of
Locations |
|
Alabama |
|
|
8 |
|
Arizona |
|
|
97 |
|
Arkansas |
|
|
3 |
|
California |
|
|
172 |
|
Colorado |
|
|
4 |
|
Connecticut |
|
|
16 |
|
Delaware |
|
|
4 |
|
Florida |
|
|
92 |
|
Georgia |
|
|
34 |
|
Illinois |
|
|
10 |
|
Indiana |
|
|
11 |
|
Iowa |
|
|
1 |
|
Kansas |
|
|
6 |
|
Kentucky |
|
|
6 |
|
Louisiana |
|
|
17 |
|
Maryland |
|
|
11 |
|
Massachusetts |
|
|
11 |
|
Michigan |
|
|
6 |
|
Mississippi |
|
|
4 |
|
Missouri |
|
|
13 |
|
Nebraska |
|
|
2 |
|
Nevada |
|
|
29 |
|
New Hampshire |
|
|
3 |
|
New Jersey |
|
|
34 |
|
New Mexico |
|
|
3 |
|
New York |
|
|
36 |
|
North Carolina |
|
|
14 |
|
Ohio |
|
|
17 |
|
Oklahoma |
|
|
22 |
|
Oregon |
|
|
8 |
|
Pennsylvania |
|
|
46 |
|
Rhode Island |
|
|
2 |
|
South Carolina |
|
|
9 |
|
Tennessee |
|
|
13 |
|
Texas |
|
|
223 |
|
Utah |
|
|
3 |
|
Virginia |
|
|
18 |
|
Washington |
|
|
12 |
|
Wisconsin |
|
|
2 |
|
Total Locations |
|
|
1,022 |
|
Our corporate offices are located in Phoenix, Arizona. The 92,669 square foot office building has a current lease term through February 28, 2027, with our ability to exercise two five-year renewal options.
Item 3. Legal Proceedings.
On September 8, 2023, a class action complaint for violation of federal securities laws was filed by West Palm Beach Police Pension Fund in the U.S. District Court for the District of Arizona against us, our former Chief Executive Officer and our former Chief Financial Officer. The complaint alleges that the defendants violated federal securities laws by issuing materially false and misleading statements that failed to disclose adverse facts about our financial guidance, business operations and prospects, and seeks class certification, damages, interest, attorneys’ fees, and other relief. On April 22, 2024, the defendants filed a motion to dismiss the complaint. That court granted that motion and dismissed the claims on July 14, 2025. The court allowed the plaintiff to file a second amended complaint. On August 13, 2025, the plaintiff filed the second amended complaint. On September 12, 2025, the defendants filed a motion to dismiss the second amended complaint. That motion is fully briefed and pending before the court. Due to the early stage of this proceeding, we cannot reasonably estimate the potential range of loss, if any. We dispute the allegations of wrongdoing and intend to defend ourselves vigorously in this matter.
On March 13, 2024, March 14, 2024, and December 17, 2024, three derivative actions were separately filed in the U.S. District Courts for the Districts of Arizona and Delaware by John Clemens, Sally Flynn, and Ian Mednick, respectively, on behalf of the Company, and against its current and former officers and directors. Each of the three complaints include allegations similar to those in the securities class action, and allege that the defendant directors and officers harmed the Company by either making false or misleading statements, or allowing false or misleading statements to be made. The complaints seek the award of damages, costs, attorneys’ fees, and other declaratory relief. The two derivative actions pending in the U.S. District Court for the District of Arizona have been consolidated into a single proceeding. All of the derivative actions are stayed pending a decision on the motion to dismiss in the securities class action. Due to the early stage of these proceedings, we cannot reasonably estimate the potential range of loss, if any. We dispute the allegations of wrongdoing and intend to defend ourselves vigorously in these matters.
We are subject to other litigation, claims, and other proceedings that arise from time-to-time in the ordinary course of business. We believe these actions are routine and incidental to the business. As of October 4, 2025, we had established reserves for claims that are probable and estimable and such reserves were not significant. While we cannot feasibly predict the outcome of these matters with certainty, we believe, based on examination of these matters, experience to date and discussions with counsel, that the ultimate liability, individually or in the aggregate, will not have a material adverse effect on our business, financial position, results of operations, or cash flows.
Item 4. Mine Safety Disclosures.
Not applicable.
PART II
Item 5. Market for Registrant’s Common Equity, Related Stockholder Matters and Issuer Purchases of Equity Securities.
Our common stock is listed on Nasdaq under the “LESL” symbol and began “regular way” trading on Nasdaq on October 29, 2020. Prior to that date, there was no public trading market for our common stock.
As of December 5, 2025, there were two stockholders of record, although there is a much larger number of beneficial holders. The actual number of stockholders is greater than the number of record holders stated above, and includes stockholders who are beneficial owners, but whose shares are held in “street name” by brokers and other nominees.
Stock Performance Chart
This performance graph shall not be deemed “filed” with the SEC for purposes of Section 18 of the Exchange Act or incorporated by reference into any filing of Leslie’s, Inc. under the Securities Act or the Exchange Act.
The graph below presents our cumulative total shareholder returns on our common stock relative to the performance of the Nasdaq Global Composite Index and the S&P SmallCap 600 Index. The graph assumes $100 was invested at the market close on October 29, 2020, which was the first day our common stock began trading and its relative performance is tracked through October 4, 2025. Data for the Nasdaq Global Composite Index, and S&P SmallCap 600 Index assume reinvestment of dividends. The graph uses the closing market price on October 29, 2020 of $434.00 per share (as adjusted for the Reverse Stock Split) as the initial value of our common stock. The comparisons in the graph below are based upon historical data and are not indicative of, nor intended to forecast, future performance of our common stock:
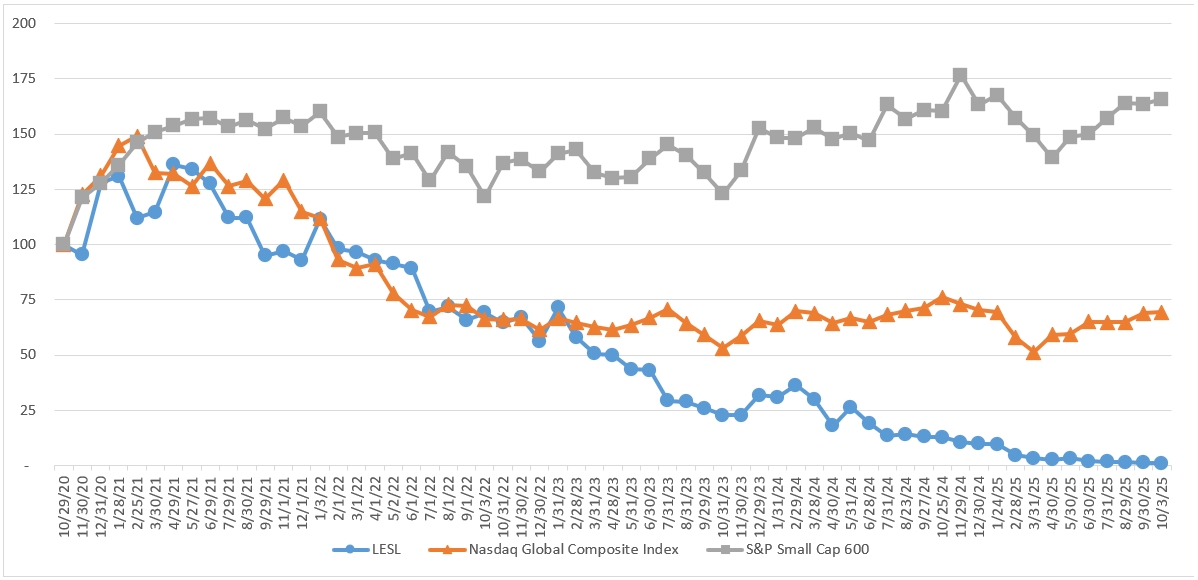
Dividends
We have never declared nor paid any cash dividends on our common stock. We currently do not expect to pay any dividends on our common stock in the foreseeable future. Any future determination relating to our dividend policy will be made by our board of directors and will depend on a number of factors, including: our actual and projected financial condition, liquidity, and results of operations; our capital levels and needs; tax considerations; any acquisitions or potential acquisitions; statutory and regulatory prohibitions and other limitations; the terms of any credit agreements or other borrowing arrangements that restrict the amount of cash dividends that we can pay; general economic conditions; and other factors deemed relevant by our board of directors. We are not obligated to pay dividends on our common stock.
Recent Sales of Unregistered Securities
None.
Item 6. [Reserved].
Item 7. Management’s Discussion and Analysis of Financial Condition and Results of Operations.
The following discussion and analysis of our financial condition and results of operations should be read together with our consolidated financial statements and related notes, which are included elsewhere in this Annual Report on Form 10-K. This discussion may contain forward-looking statements based upon current expectations that involve risks and uncertainties. Actual results or outcomes may differ materially from those anticipated in these forward-looking statements, which are subject to risks, uncertainties, and other factors, including those described in Part I, Item 1A, “Risk Factors” of this Annual Report on Form 10-K for the fiscal year ended October 4, 2025.
We operate on a fiscal calendar that results in a fiscal year consisting of a 52- or 53-week period ending on the Saturday closest to September 30th. In a 52-week fiscal year, each quarter contains 13 weeks of operations; in a 53-week fiscal year, each of the first, second, and third quarters includes 13 weeks of operations and the fourth quarter includes 14 weeks of operations. References to fiscal 2025, 2024, and 2023 refer to the fiscal years ended October 4, 2025, September 28, 2024, and September 30, 2023. Fiscal 2025 included 53 weeks of operations and 2024 and 2023, included 52 weeks of operations.
Our Company
Founded in 1963 by Phil Leslie Jr. in Southern California, the Company today known simply as “Leslie’s” has over six
decades of disruptive retail innovation in the $15 billion U.S. pool and spa care industry. Today, we are the largest and most trusted direct-to-consumer brand in our segment, serving residential consumers and pool professionals, and many of the largest commercial property operators in the country. With over 1,000 retail locations, an integrated, digitally forward omnichannel strategy, and a horizontally integrated, nationwide ecosystem under the Leslie’s and In the Swim® brands, among others, we have built a market-leading share of residential aftermarket product spend, based on 2024 industry analyst reports, and a physical network larger than the sum of our 20 largest competitors. We offer an extensive assortment of professional-grade products, the majority of which are exclusive to Leslie’s, manufacturer certified installation and repair services, and in some markets, weekly pool maintenance services. Our dedicated, knowledgeable team of associates, pool and spa care experts, and experienced service technicians, are passionate about empowering every single Leslie’s customer with the knowledge, products, and solutions necessary to confidently maintain and thoroughly enjoy their pools and spas. The considerable scale of our integrated marketing and distribution ecosystem, which is powered by our direct-to-consumer network, uniquely enables us to efficiently reach and service nearly every pool and spa in the continental United States.
We operate primarily in the pool and spa aftermarket industry, a fundamentally attractive category in retail, given its scale, historical predictability, and growth outlook. More than 85% of our product assortment is comprised of non-discretionary products essential to the care of residential and commercial pools and spas. This includes chemicals, new and replacement parts, cleaning and maintenance equipment, safety, recreational, and fitness-related products. We also offer important essential services, such as equipment installation and repair for residential and commercial customers. We have relationships with professional pool operators from major hotel and apartment owners to municipal, county and state governments, all the way to sole proprietors. In addition to a strong consumer and commercial retail and service presence, we operate a wholesale specialty pool and spa parts distribution business, giving us unique access to hard-to-find specialty parts; an integrated manufacturing plant, giving us vertical scale and competitive cost on parts of our chemical assortment; and a regionally located, hub-and-spoke distribution system throughout the continental United States.
We offer complimentary, commercial-grade in-store water testing and analysis via our proprietary AccuBlue® system, leading to increased consumer engagement, conversion, basket size, and loyalty, resulting in higher lifetime value. Our water treatment expertise is powered by data and intelligence accumulated from the millions of water tests we have performed over the years, positioning us as the most trusted water treatment service provider in the recreational pool and spa industry. We then brought AccuBlue® direct to pool owners’ backyards with AccuBlue Home®, a pioneering app-enabled water testing device. These differentiated capabilities allow us to meet the needs of any pool and spa owner, whether they care for their pool or spa themselves or rely on a professional, whenever, wherever, and however they choose to engage with us.
Key Factors and Measures We Use to Evaluate Our Business
We consider a variety of financial and operating measures in assessing the performance of our business. The key measures we use under United States generally accepted accounting principles (“GAAP”) are sales, gross profit and gross margin, selling, general, and administrative expenses (“SG&A”), and operating income (loss). The key non-GAAP measures and other operating measures we use are comparable sales, comparable sales growth, Adjusted EBITDA, Adjusted net income (loss), and Adjusted diluted earnings per share.
Sales
We offer a broad range of products that consists of regularly purchased, non-discretionary pool and spa maintenance items such as chemicals, equipment, cleaning accessories and parts, as well as installation and repair services for pool and spa equipment. Our offering of proprietary, owned, and third-party brands across diverse product categories drives sales growth by attracting new consumers and encouraging repeat visits from our existing consumers. Revenue from merchandise sales at retail locations is recognized at the point of sale, revenue from services is recognized when the services are rendered, and revenue from e-commerce merchandise sales is generally recognized upon shipment of the merchandise. Revenue is recorded net of related discounts and sales tax. Payment from retail customers is generally at the point of sale and payment terms for professional pool operator customers are based on our credit requirements and generally have terms of less than 60 days. When we receive payment from a consumer before the consumer has taken possession of the merchandise or the service has been performed, the amount received is recorded as deferred revenue or as a customer deposit until the sale or service is complete. Sales are impacted by weather, seasonality, product mix and availability, promotional and competitive activities and the spending habits of our consumers, as well as inflation and interest rates. Growth of our sales is primarily driven by comparable sales growth and expansion of our locations in existing and new markets.
Comparable Sales and Comparable Sales Growth
We measure comparable sales growth as the increase or decrease in sales recorded by the comparable base in any reporting period, compared to sales recorded by the comparable base in the prior reporting period. The comparable base includes sales through our locations and through our e-commerce websites and third-party marketplaces. Comparable sales growth is a key measure used by management and our board of directors to assess our financial performance.
We consider a new or acquired location comparable in the first full month after it has completed one year of sales. Closed locations become non-comparable during their last partial month of operation. Locations that are relocated are considered comparable at the time the relocation is complete. Comparable sales is not calculated in the same manner by all companies, and accordingly, is not necessarily comparable to similarly titled measures of other companies and may not be an appropriate measure for performance relative to other companies.
The number of new locations reflects the number of locations opened during a particular reporting period. New locations require an initial capital investment in location buildouts, fixtures, and equipment, which we amortize over time as well as cash required for inventory.
As of October 4, 2025, we operated over 1,000 locations in 39 states across the United States. We owned 27 locations and leased the remainder of our locations. Our initial lease terms are typically five years with options to renew for multiple successive five-year periods. We evaluate new opportunities in new and existing markets based on the number of pools and spas in the market, competition, our existing locations, availability and cost of real estate, and distribution and operating costs of our locations. We review the performance of our locations on a regular basis and evaluate opportunities to strategically close locations to improve our profitability. Our limited investment costs in individual locations and our ability to transfer sales to our extensive network of remaining locations and e-commerce websites allows us to improve profitability as a result of any strategic closures.
Gross Profit and Gross Margin
Gross profit is equal to our sales less our cost of merchandise and services sold. Cost of merchandise and services sold reflects the direct cost of purchased merchandise, costs to package certain chemical products, including direct materials and labor, costs to provide services, including labor and materials, as well as distribution and occupancy costs. The direct cost of purchased merchandise includes vendor rebates. We recognize vendor rebates based on an estimated recognition pattern using historical data. Distribution costs include warehousing and transportation expenses, including costs associated with third-party fulfillment centers used to ship merchandise to our e-commerce consumers. Occupancy costs include the rent, common area maintenance, real estate taxes, and depreciation and amortization costs of all retail locations. These costs are significant and are expected to continue to increase proportionate to our growth.
Gross margin is gross profit as a percentage of our sales. Gross margin is impacted by merchandise costs, pricing and promotions, product mix and availability, inflation, and service costs, which can vary. Our proprietary brands, custom-formulated products, and vertical integration provide us with cost savings, as well as greater control over product availability and quality as compared to other companies in the industry. Gross margin is also impacted by the costs of distribution and occupancy costs, which can vary.
Our gross profit is variable in nature and generally follows changes in sales. The components of our cost of merchandise and services sold may not be comparable to the components of cost of sales or similar measures of other companies. As a result, our gross profit and gross margin may not be comparable to similar data made available by other companies.
Selling, General and Administrative Expenses
Our SG&A includes selling and operating expenses across our retail locations and digital platform, and our corporate-level general and administrative expenses. Selling and operating expenses at retail locations include payroll, bonus and benefit costs for personnel, supplies, and credit and debit card processing costs. Corporate expenses include payroll, bonus, and benefit costs for our corporate and field support functions, equity-based compensation, marketing and advertising, insurance, utilities, occupancy costs related to our corporate office facilities, professional services, and depreciation and amortization for all assets, except those related to our retail locations and distribution operations, which are included in cost of merchandise and services sold. Selling and operating expenses generally vary proportionately with sales and the change in the number of locations. In contrast, general and administrative expenses are generally not directly proportional to sales and the change in the number of locations, but may increase over time to support our growth and public company obligations. The components of our SG&A may not be comparable to the components of similar measures of other companies.
Impairments
The impairments were non-cash charges resulting from a decline in our operating results, store performance, and market capitalization. These charges were due to (i) the carrying value of our single reporting unit’s goodwill being greater than the calculated fair value in the case of goodwill impairment and (i) the carrying value of our store assets being greater than the fair value in the case of asset impairment.
Operating Income (Loss)
Operating income (loss) is gross profit less SG&A. Operating income (loss) excludes interest expense, loss on debt extinguishment, income tax expense (benefit), and other (income) expenses, net. We use operating income (loss) as an indicator of the productivity of our business and our ability to manage expenses.
Adjusted EBITDA
Adjusted EBITDA is defined as earnings before interest (including amortization of debt issuance costs), taxes, depreciation and amortization, equity-based compensation expense, executive transition costs, severance, strategic project costs, merger and acquisition costs, and other non-recurring, non-cash or discrete items. Adjusted EBITDA is a key measure used by management and our board of directors to assess our financial performance. Adjusted EBITDA is also frequently used by analysts, investors, and other interested parties to evaluate companies in our industry, when considered alongside other GAAP measures. We use Adjusted EBITDA to supplement GAAP measures of performance to evaluate the effectiveness of our business strategies, to make budgeting decisions, and to compare our performance against that of other companies using similar measures.
Adjusted EBITDA is not a recognized measure of financial performance under GAAP but is used by some investors to determine a company’s ability to service or incur indebtedness. Adjusted EBITDA is not calculated in the same manner by all companies, and accordingly, is not necessarily comparable to similarly titled measures of other companies and may not be an appropriate measure for performance relative to other companies. Adjusted EBITDA should not be construed as an indicator of a company’s operating performance in isolation from, or as a substitute for, net income (loss), cash flows from operations or cash flow data, all of which are prepared in accordance with GAAP. We have presented Adjusted EBITDA solely as supplemental disclosure because we believe it allows for a more complete analysis of results of operations. Adjusted EBITDA is not intended to represent, and should not be considered more meaningful than, or as an alternative to, measures of operating performance as determined in accordance with GAAP. In the future, we may incur expenses or charges such as those added back to calculate Adjusted EBITDA. Our presentation of Adjusted EBITDA should not be construed as an inference that our future results will be unaffected by these items.
Adjusted Net Income (Loss) and Adjusted Diluted Earnings (loss) per Share
Adjusted net income (loss) and Adjusted diluted earnings (loss) per share are additional key measures used by management and our board of directors to assess our financial performance. Adjusted net income (loss) and Adjusted diluted earnings (loss) per share are also frequently used by analysts, investors, and other interested parties to evaluate companies in our industry, when considered alongside other GAAP measures.
Adjusted net income (loss) is defined as net income (loss) adjusted to exclude equity-based compensation expense, executive transition costs, severance, strategic project costs, merger and acquisition costs, change in valuation allowance for deferred taxes, and other non-recurring, non-cash, or discrete items. Adjusted diluted earnings (loss) per share is defined as Adjusted net income (loss) divided by the diluted weighted average number of common shares outstanding.
Factors Affecting the Comparability of our Results of Operations
Our reported results have been affected by, among other events, the following events, which must be understood in order to assess the comparability of our period-to-period financial performance and condition.
Impact of Macroeconomic Events and Uncertainties
Our financial performance and condition may be impacted to varying extents from period to period by macroeconomic and geopolitical developments, including public health crises, escalating global conflicts, tariffs, supply chain disruptions, labor market constraints, high rates of inflation, high interest rates, general economic slowdown, and potential failures among financial institutions. New or increased tariffs and other barriers to trade, especially in light of comments and executive orders made by the U.S. presidential administration, could further impact or exacerbate these conditions. The United States has announced tariffs on imports from most countries, including significant tariffs on imports from Canada, Mexico and China. In response to tariffs, other countries have implemented retaliatory tariffs on U.S. goods. There is substantial uncertainty about the duration of existing tariffs and whether additional tariffs may be imposed, modified or suspended, and the impacts of such actions on the Company’s business. Significant disruption to our supply chain for products we sell, as a result of geopolitical conflict, tariffs or trade policies or otherwise, can also have a material impact on our sales and earnings and cause unpredictable changes in results. In addition, we believe adverse macroeconomic trends and uncertainties including inflation, tariffs, and varying interest rates also increase consumers’ sensitivity to price and result in cost-conscious behavior inclusive of high ticket items, which can result in corresponding declines in sales and/or gross profit.
Additional uncertainties that can impact our results of operations are consumer purchasing patterns and consumer cost-consciousness. In the past, we believe some customers stockpiled chemicals, resulting in unexpected changes in demand. As a result of such behavior, our revenue may be higher than normal during the periods of stockpiling and may be lower than normal during the periods after stockpiling has occurred.
Reverse Stock Split
On September 10, 2025, our shareholders approved a series of amendments to our Seventh Amended and Restated Certificate of Incorporation (the “Certificate of Amendment”). On September 26, 2025, we filed a Certificate of Amendment with the Secretary of State of the State of Delaware to effect a reverse stock split of our comment stock at a ratio of 1-for-20 (the “Reverse Stock Split”) and proportionately decrease the number of authorized shares of the Company’s common stock, which became effective upon filing (the “Effective Time”). The Company’s common stock began trading on a Reverse Stock Split-adjusted basis on Nasdaq as of the open of trading on September 29, 2025 under the existing ticker symbol “LESL”. The Company’s common stock is now represented by a new CUSIP number, 527064 208.
As a result of the Reverse Stock Split, every 20 shares of our common stock issued and outstanding as of the Effective Time of the Reverse Stock Split was automatically converted into one share of common stock. No fractional shares were issued as a result of the Reverse Stock Split. The Company’s transfer agent aggregated all fractional shares of common stock that would otherwise have been issuable as a result of the Reverse Stock Split and sold them at the then prevailing prices on the open market on behalf of those shareholders who would otherwise be entitled to receive such fractional shares. Shareholders who otherwise would be entitled to receive fractional shares received their respective pro rata share of the total proceeds of such sale.
In addition, as of the Effective Time and as a result of the Reverse Stock Split, proportionate adjustments were made in accordance with the terms of the Company’s 2020 Omnibus Incentive Plan (the “Incentive Plan”), with respect to the number of shares of common stock issuable under outstanding stock options, restricted stock units and performance units, and any other equity-based awards, the per-share
exercise price with respect to such awards, and the number of shares of common stock reserved for future issuance under the Incentive Plan.
All share and per share amounts presented herein have been retroactively adjusted to reflect the Reverse Stock Split for all years.
Results of Operations
We derived our consolidated statements of operations for fiscal 2025, 2024, and 2023 from our consolidated financial statements. Our historical results are not necessarily indicative of the results that may be expected in the future. The following table summarizes key components of our results of operations for the years indicated, both in dollars and as a percentage of our sales (in thousands, except per share amounts and percentages):
|
|
|
|
|
|
|
|
|
|
|
|
|
|
|
Year Ended |
|
Statements of Operations Data: |
|
October 4, 2025 |
|
|
September 28, 2024 |
|
|
September 30, 2023 |
|
Sales |
|
$ |
1,241,915 |
|
|
$ |
1,330,121 |
|
|
$ |
1,451,209 |
|
Cost of merchandise and services sold |
|
|
802,268 |
|
|
|
853,331 |
|
|
|
902,986 |
|
Gross profit |
|
|
439,647 |
|
|
|
476,790 |
|
|
|
548,223 |
|
Selling, general and administrative expenses |
|
|
425,676 |
|
|
|
419,673 |
|
|
|
446,044 |
|
Impairment |
|
|
183,826 |
|
|
|
— |
|
|
|
— |
|
Operating (loss) income |
|
|
(169,855 |
) |
|
|
57,117 |
|
|
|
102,179 |
|
Interest expense |
|
|
62,919 |
|
|
|
70,395 |
|
|
|
65,438 |
|
(Loss) income before taxes |
|
|
(232,774 |
) |
|
|
(13,278 |
) |
|
|
36,741 |
|
Income tax expense |
|
|
4,196 |
|
|
|
10,101 |
|
|
|
9,499 |
|
Net (loss) income |
|
$ |
(236,970 |
) |
|
$ |
(23,379 |
) |
|
$ |
27,242 |
|
(Loss) earnings per share |
|
|
|
|
|
|
|
|
|
Basic |
|
$ |
(25.57 |
) |
|
$ |
(2.53 |
) |
|
$ |
2.96 |
|
Diluted |
|
$ |
(25.57 |
) |
|
$ |
(2.53 |
) |
|
$ |
2.95 |
|
Weighted average shares outstanding |
|
|
|
|
|
|
|
|
|
Basic |
|
|
9,268 |
|
|
|
9,234 |
|
|
|
9,191 |
|
Diluted |
|
|
9,268 |
|
|
|
9,234 |
|
|
|
9,234 |
|
|
|
|
|
|
|
|
|
|
|
Percentage of Sales(1) |
|
(%) |
|
|
(%) |
|
|
(%) |
|
Sales |
|
|
100.0 |
|
|
|
100.0 |
|
|
|
100.0 |
|
Cost of merchandise and services sold |
|
|
64.6 |
|
|
|
64.2 |
|
|
|
62.2 |
|
Gross margin |
|
|
35.4 |
|
|
|
35.8 |
|
|
|
37.8 |
|
Selling, general and administrative expenses |
|
|
34.3 |
|
|
|
31.6 |
|
|
|
30.7 |
|
Impairment |
|
|
14.8 |
|
|
|
— |
|
|
|
— |
|
Operating (loss) income |
|
|
(13.7 |
) |
|
|
4.3 |
|
|
|
7.0 |
|
Interest expense |
|
|
5.1 |
|
|
|
5.3 |
|
|
|
4.5 |
|
(Loss) income before taxes |
|
|
(18.7 |
) |
|
|
(1.0 |
) |
|
|
2.5 |
|
Income tax expense |
|
|
0.3 |
|
|
|
0.8 |
|
|
|
0.7 |
|
Net (loss) income |
|
|
(19.1 |
) |
|
|
(1.8 |
) |
|
|
1.9 |
|
Other Financial and Operations Data: |
|
|
|
|
|
|
|
|
|
Number of new and acquired locations, net |
|
|
1 |
|
|
|
13 |
|
|
|
18 |
|
Number of locations open at end of year |
|
|
1,022 |
|
|
|
1,021 |
|
|
|
1,008 |
|
Comparable sales growth(2) |
|
|
(6.8 |
)% |
|
|
(8.8 |
)% |
|
|
(11.0 |
)% |
Adjusted EBITDA(3) |
|
$ |
61,356 |
|
|
$ |
108,744 |
|
|
$ |
168,149 |
|
Adjusted EBITDA as a percentage of sales(3) |
|
|
4.9 |
% |
|
|
8.2 |
% |
|
|
11.6 |
% |
Adjusted net (loss) income(3) |
|
$ |
(43,664 |
) |
|
$ |
(1,085 |
) |
|
$ |
51,113 |
|
Adjusted diluted (loss) earnings per share |
|
$ |
(4.71 |
) |
|
$ |
(0.12 |
) |
|
$ |
5.54 |
|
(1)Components may not add to totals due to rounding.
(2)See the section titled “Management’s Discussion and Analysis of Financial Condition and Results of Operations—Key Factors and Measures We Use to Evaluate Our Business.”
(3)The tables below provide a reconciliation from our net (loss) income to Adjusted EBITDA and net (loss) income to Adjusted net (loss) income for fiscal 2025, 2024, and 2023 (in thousands).
|
|
|
|
|
|
|
|
|
|
|
|
|
|
|
Year Ended |
|
|
|
October 4, 2025 |
|
|
September 28, 2024 |
|
|
September 30, 2023 |
|
Net (loss) income |
|
$ |
(236,970 |
) |
|
$ |
(23,379 |
) |
|
$ |
27,242 |
|
Interest expense |
|
|
62,919 |
|
|
|
70,395 |
|
|
|
65,438 |
|
Income tax expense |
|
|
4,196 |
|
|
|
10,101 |
|
|
|
9,499 |
|
Impairment(1) |
|
|
183,826 |
|
|
|
— |
|
|
|
— |
|
Depreciation and amortization expense(2) |
|
|
33,467 |
|
|
|
33,078 |
|
|
|
34,142 |
|
Equity-based compensation expense(3) |
|
|
6,254 |
|
|
|
8,650 |
|
|
|
12,067 |
|
Strategic project costs(4) |
|
|
2,614 |
|
|
|
2,083 |
|
|
|
3,004 |
|
Executive transition costs and other(5) |
|
|
5,050 |
|
|
|
7,816 |
|
|
|
16,757 |
|
Adjusted EBITDA |
|
$ |
61,356 |
|
|
$ |
108,744 |
|
|
$ |
168,149 |
|
|
|
|
|
|
|
|
|
|
|
|
|
|
|
|
Year Ended |
|
|
|
October 4, 2025 |
|
|
September 28, 2024 |
|
|
September 30, 2023 |
|
Net (loss) income |
|
$ |
(236,970 |
) |
|
$ |
(23,379 |
) |
|
$ |
27,242 |
|
Impairment(1) |
|
|
183,826 |
|
|
|
— |
|
|
|
— |
|
Equity-based compensation expense(3) |
|
|
6,254 |
|
|
|
8,650 |
|
|
|
12,067 |
|
Strategic project costs(4) |
|
|
2,614 |
|
|
|
2,083 |
|
|
|
3,004 |
|
Executive transition costs and other (5) |
|
|
5,050 |
|
|
|
7,816 |
|
|
|
16,757 |
|
Changes in valuation allowance (6) |
|
|
44,998 |
|
|
|
11,177 |
|
|
|
— |
|
Tax effects of these adjustments(7) |
|
|
(49,436 |
) |
|
|
(7,432 |
) |
|
|
(7,957 |
) |
Adjusted net (loss) income |
|
$ |
(43,664 |
) |
|
$ |
(1,085 |
) |
|
$ |
51,113 |
|
(1)Represents non-cash charges related to the write-off of our goodwill given recent operating and market capitalization declines and asset write offs for certain underperforming stores.
(2)Includes depreciation related to our distribution centers and store locations, which is reported in cost of merchandise and services sold and SG&A in our consolidated statements of operations.
(3)Represents charges related to equity-based compensation and our related payroll tax expense, which are reported in SG&A in our consolidated statements of operations.
(4)Represents non-recurring costs, such as third-party consulting costs related to first-generation technology initiatives, replacements of systems that are no longer supported by our vendors, investment in and development of new products outside of the course of continuing operations, or other discrete strategic projects that are infrequent or unusual in nature and potentially distortive to continuing operations. These items are reported in SG&A in our consolidated statements of operations.
(5)Includes certain senior executive transition costs and severance associated with completed corporate restructuring activities across the organization, losses on asset dispositions, merger and acquisition costs, and other non-recurring, non-cash, or discrete items as determined by management. Amounts are reported in SG&A in our consolidated statements of operations.
(6)Represents a non-cash change in valuation allowance for deferred taxes. This item is reported in income tax benefit (expense) in our consolidated statements of operations.
(7)Represents the tax effect of the total adjustments based on our combined U.S. federal and state statutory tax rates. Amounts are reported in income tax expense in our consolidated statements of operations.
Comparison of Fiscal 2025 and 2024
Sales
Sales decreased to $1,241.9 million in fiscal 2025 compared to $1,330.1 million in fiscal 2024, a decrease of $88.2 million, or 6.6%. The decrease was primarily driven by reductions in traffic and a lower number of transactions. Comparable sales decreased $91.4
million, or 6.8%, compared to fiscal 2024, primarily driven by declines in traffic and average order value. Non-comparable sales, including acquisitions and new stores, were $3.2 million in fiscal 2025.
Gross Profit and Gross Margin
Gross profit decreased to $439.6 million in fiscal 2025 compared to $476.8 million in fiscal 2024, a decrease of $37.1 million or 7.8%. Gross margin decreased to 35.4% compared to 35.8% in fiscal 2024, a decrease of 40 basis points. The decrease in gross margin was primarily driven by negative impacts of 100 basis points from deleverage on occupancy costs partially offset by 60 basis point benefit from product rate.
Selling, General and Administrative Expenses
SG&A increased to $425.7 million in fiscal 2025 compared to $419.7 million in fiscal 2024, an increase of $6.0 million or 1.4%. This increase in SG&A was primarily related to increases of $7.7 million in compensation expenses, $4.4 million in professional fees and consulting expenses, $1.9 million in direct store expenses, and $1.4 million in information and technology spend. These increases were partially offset by decreases of $3.6 million in merchant fees, and $2.9 million in marketing fees.
Impairment
Impairment charges increased to $183.8 million in fiscal 2025. The impairment was comprised of a $180.7 million impairment to goodwill and $3.1 million asset write offs for underperforming stores. No impairment charges were recorded in the prior year.
Interest Expense
Interest expense decreased to $62.9 million in fiscal 2025 compared to $70.4 million in fiscal 2024, a decrease of $7.5 million. This decrease was primarily due to lower interest rates on our Term Loan and Revolving Credit Facility combined with a lower balance on the Term Loan.
Income Taxes
Income tax expense was $4.2 million in fiscal 2025 compared to $10.1 million in fiscal 2024, a decrease of $5.9 million. The change in income tax expense was the result of the $45.0 million increase in the non-cash valuation allowance against our deferred tax assets, plus the permanent effects of the goodwill impairment recorded during fiscal 2025, partially offset by a larger pretax loss in fiscal 2025 compared to fiscal 2024. Our effective tax rate was (1.8%) for fiscal 2025 compared to (76.1%) for fiscal 2024.
Net Loss and Diluted Loss per Share
Net loss was $237.0 million in fiscal 2025 compared to net loss of $23.4 million in fiscal 2024, a change of $213.6 million. The increase in net loss was primarily driven by lower sales volume during fiscal 2025, combined with impairments recorded during the year. Diluted earnings per share decreased to $(25.57) in fiscal 2025 compared to $(2.53) in fiscal 2024.
Adjusted net loss was $43.7 million in fiscal 2025 compared to a loss of $1.1 million in fiscal 2024, a change of $42.6 million. Adjusted diluted loss per share was $(4.71) in fiscal 2025 compared to $(0.12) in fiscal 2024.
Adjusted EBITDA
Adjusted EBITDA decreased to $61.4 million in fiscal 2025 compared to $108.7 million in fiscal 2024, an decrease of $47.4 million. The decrease was primarily driven by lower sales volume during fiscal 2025, combined with decreases in occupancy deleverage and higher SG&A. These impacts were partially offset by higher product rate.
Comparison of Fiscal 2024 and 2023
Sales
Sales decreased to $1,330.1 million in fiscal 2024 compared to $1,451.2 million in fiscal 2023, a decrease of $121.1 million, or 8.3%, primarily driven by declines in traffic and average order value. Comparable sales decreased $127.4 million, or 8.8%, compared to fiscal 2023, Non-comparable sales including acquisitions and new stores were $7.9 million in fiscal 2024.
Gross Profit and Gross Margin
Gross profit decreased to $476.8 million in fiscal 2024 compared to $548.2 million in fiscal 2023, a decrease of $71.4 million or 13.0%. Gross margin decreased to 35.8% compared to 37.8% in fiscal 2023, a decrease of 200 basis points. The decrease in gross margin was primarily driven by negative impacts of 121 basis points from product rate, 94 basis points from deleverage on occupancy costs and 50 basis points from the expensing of previously capitalized distribution center costs due to significant reductions in inventory during fiscal 2024. Additionally, there was a one-time item of approximately $5.0 million related to rebates and warranties on a contract that has subsequently been revised. The impacts discussed above were partially offset by a 72 basis point reduction related to inventory adjustments and distribution costs.
Selling, General and Administrative Expenses
SG&A decreased to $419.7 million in fiscal 2024 compared to $446.0 million in fiscal 2023, a decrease of $26.3 million or 5.9%. This decrease in SG&A was primarily related to a decrease merchant fees of $6.0 million associated with lower sales, a decrease in payroll costs of $4.0 million mainly due to lower headcount, a decrease in asset write offs of $5.9 million, a decrease in equity compensation of $3.4 million, a decrease in bonus and commissions of $1.9 million, and a decrease in marketing expenses of $1.6 million.
Interest Expense
Interest expense increased to $70.4 million in fiscal 2024 compared to $65.4 million in fiscal 2023, an increase of $5.0 million. This increase was primarily due to higher interest rates on our Term Loan and Revolving Credit Facility.
Income Taxes
Income tax expense was $10.1 million in fiscal 2024 compared to $9.5 million in fiscal 2023, an increase of $0.6 million. The change in income tax expense was the result of the impact of limitations on interest expense deductibility requiring us to record a $11.2 million non-cash valuation allowance against our deferred tax asset, partially offset by pretax loss in 2024, compared to pretax income in 2023. Our effective tax rate was -76.1% for fiscal 2024 compared to 25.9% for fiscal 2023.
Net (Loss) Income and Diluted Earnings per Share
Net loss was $23.4 million in fiscal 2024 compared to net income of $27.2 million in fiscal 2023, a change of $50.6 million. Diluted earnings per share decreased to $(2.53) in fiscal 2024 compared to $2.95 in fiscal 2023.
Adjusted net loss was $1.1 million in fiscal 2024 compared to income of $51.1 million in fiscal 2023, a change of $52.2 million. Adjusted diluted earnings per share decreased to $(0.12) in fiscal 2024 compared to $5.54 in fiscal 2023.
Adjusted EBITDA
Adjusted EBITDA decreased to $108.7 million in fiscal 2024 compared to $168.1 million in fiscal 2023, a decrease of $59.4 million. The decrease was primarily driven by lower sales volume during fiscal 2024, combined with decreases in gross margin, driven by higher product rate and occupancy deleverage. These decreases were partially offset by lower SG&A and inventory adjustments.
Seasonality and Quarterly Fluctuations
Our business is highly seasonal. Sales and earnings are highest during the third and fourth fiscal quarters, which include April through September, and represent the peak months of swimming pool use. Sales are substantially lower during our first and second fiscal quarters when we typically generate net losses and we realize negative operating cash flows. We have a long track record of investing in our business throughout the year, including in operating expenses, working capital, and capital expenditures related to new locations and other growth initiatives. While these investments drive performance during the primary selling season in our third and fourth fiscal quarters, they have a negative impact on our earnings and cash flow during our first and second fiscal quarters.
We typically experience a build-up of inventory and accounts payable during the first and second fiscal quarters in anticipation of the peak swimming pool supply selling season. We negotiate extended payment terms with certain of our primary suppliers as we receive merchandise in December through March, and we pay for merchandise in April through July.
The principal external factor affecting our business is weather. Hot weather can increase purchases of chemicals and other non-discretionary products as well as purchases of discretionary products and can drive increased purchases of installation and repair services.
Unseasonably cool weather or significant amounts of rainfall during the peak pool sales season can reduce chemical consumption in pools and spas and decrease consumer purchases of our products and services. In addition, unseasonably early or late warming trends can increase or decrease the length of the pool season and impact timing around pool openings and closings and, therefore, our total sales and timing of our sales. Further, we generally close locations after our peak selling season ends. During this year, we experienced unseasonably cold and rainy weather in the North East in May and June, which we believe delayed the start to the pool season and pool openings.
Liquidity and Capital Resources
Overview
Our primary sources of liquidity are net cash provided by operating activities and borrowing availability under our Revolving Credit Facility. Historically, we have funded working capital requirements, capital expenditures, payments related to acquisitions, and debt service requirements with internally generated cash on hand and through our Revolving Credit Facility.
Cash and cash equivalents consist primarily of cash on deposit with banks. Cash and cash equivalents totaled $64.3 million and $108.5 million as of October 4, 2025 and September 28, 2024. As of October 4, 2025 and September 28, 2024, we did not have any outstanding borrowings under our Revolving Credit Facility.
Our primary working capital requirements are for the purchase of inventory, payroll, rent, other facility costs, distribution costs, and general and administrative costs. Our working capital requirements fluctuate during the year, driven primarily by seasonality and the timing of inventory purchases.
Our capital expenditures are primarily related to infrastructure-related investments, including investments related to upgrading and maintaining our information technology systems, ongoing location improvements, expenditures related to our distribution centers, and new location openings. We expect to fund capital expenditures from net cash provided by operating activities.
Based on our growth plans, we believe our cash and cash equivalents position, net cash provided by operating activities and borrowing availability under our Revolving Credit Facility will be adequate to finance our working capital requirements, planned capital expenditures, strategic acquisitions, share repurchases, and debt service over the next 12 months and thereafter. If cash provided by operating activities and borrowings under our Revolving Credit Facility are not sufficient or available to meet our capital requirements, then we may need to obtain additional equity or debt financing. There can be no assurance that equity or debt financing will be available to us if we need it or, if available, whether the terms will be satisfactory to us.
As of October 4, 2025, outstanding standby letters of credit totaled $11.7 million, and after considering borrowing base restrictions we had $167.9 million of availability from cash on hand and available borrowing capacity under the terms of the Revolving Credit Facility. As of October 4, 2025, we were in compliance with the covenants under the Revolving Credit Facility and our Term Loan agreements. Additionally, during the first quarter of fiscal 2025, we repaid $25.0 million on our Term Loan.
During the quarter ended October 4, 2025, the Company received downgraded credit ratings from both Moody’s to (Caa3 from Caa1) and Standard and Poor’s (“S&P”) Global Ratings to (B- from B).
Summary of Cash Flows
A summary of our cash flows from operating, investing, and financing activities is presented in the following table (in thousands):
|
|
|
|
|
|
|
|
|
|
|
|
|
|
|
Year Ended |
|
|
|
October 4, 2025 |
|
|
September 28, 2024 |
|
|
September 30, 2023 |
|
Net cash provided by operating activities |
|
$ |
8,822 |
|
|
$ |
107,466 |
|
|
$ |
6,470 |
|
Net cash used in investing activities |
|
|
(25,350 |
) |
|
|
(47,163 |
) |
|
|
(52,539 |
) |
Net cash used in financing activities |
|
|
(27,637 |
) |
|
|
(7,218 |
) |
|
|
(10,804 |
) |
Net (decrease) increase in cash and cash equivalents |
|
$ |
(44,165 |
) |
|
$ |
53,085 |
|
|
$ |
(56,873 |
) |
Cash Provided by Operating Activities
Net cash provided by operating activities was $8.8 million in fiscal 2025 compared to $107.5 million in fiscal 2024. This decrease was driven by the higher net loss in 2025 due to lower sales during fiscal 2025 combined with higher uses of cash for net working capital.
Net cash provided by operating activities was $107.5 million in fiscal 2024 compared to $6.5 million in fiscal 2023. This increase was primarily driven by changes in working capital related to reductions in inventories of $85.9 million, increases in accounts payable and accrued expenses of $6.7 million, partially offset by an increase in accounts receivable of $18.7 million.
Cash Used in Investing Activities
Net cash used in investing activities was $25.4 million in fiscal 2025 compared to $47.2 million in fiscal 2024. This decrease was driven by a decrease in purchases of property and equipment.
Net cash used in investing activities was $47.2 million in fiscal 2024 compared to $52.5 million in fiscal 2023. This decrease was driven by lower investments for business acquisitions, partially offset by increased purchases of property and equipment.
Cash Used in Financing Activities
Net cash used in financing activities was $27.6 million in fiscal 2025 compared to $7.2 million in fiscal 2024. This increase was primarily driven by higher repayments of long-term debt in fiscal 2025.
Net cash used in financing activities was $7.2 million in fiscal 2024 compared to $10.8 million in fiscal 2023. This decrease was primarily driven by lower payments of employee tax withholding related to restricted stock vesting.
Contractual Obligations and Other Commitments
The following table summarizes our contractual cash obligations as of October 4, 2025 (in thousands):
|
|
|
|
|
|
|
|
|
|
|
|
|
|
|
|
|
|
|
|
|
|
|
|
|
|
|
|
|
|
|
|
Payments Due By Period |
|
|
|
Total |
|
|
|
2026 |
|
|
2027 |
|
|
2028 |
|
|
2029 |
|
|
2030 |
|
|
Thereafter |
|
Long-term debt, net (1) |
|
$ |
756,650 |
|
|
|
$ |
— |
|
|
$ |
— |
|
|
$ |
756,650 |
|
|
$ |
— |
|
|
$ |
— |
|
|
$ |
— |
|
Purchase commitments (2) |
|
|
22,176 |
|
|
|
|
10,135 |
|
|
|
7,068 |
|
|
|
3,027 |
|
|
|
1,946 |
|
|
|
— |
|
|
|
— |
|
Operating lease obligations (3) |
|
|
314,457 |
|
|
|
|
89,454 |
|
|
|
75,314 |
|
|
|
51,615 |
|
|
|
37,052 |
|
|
|
19,195 |
|
|
|
41,827 |
|
Financing lease obligations (4) |
|
|
1,570 |
|
|
|
|
315 |
|
|
|
209 |
|
|
|
209 |
|
|
|
209 |
|
|
|
209 |
|
|
|
419 |
|
Total |
|
$ |
1,094,853 |
|
|
|
$ |
99,904 |
|
|
$ |
82,591 |
|
|
$ |
811,501 |
|
|
$ |
39,207 |
|
|
$ |
19,404 |
|
|
$ |
42,246 |
|
(1)We are required to pay a commitment fee of 0.25% based on the unused portion of the Revolving Credit Facility, which is not included in the table above due to the unknown nature of future borrowings.
(2)Purchase obligations include all legally binding contracts and primarily relate to firm commitments for inventory purchases. Purchase orders that are not binding agreements are excluded from the table above.
(3)Operating lease obligations relate to our locations, office, distribution, and manufacturing facilities. We are obligated to make cash payments in connection with various lease obligations and purchase commitments and all obligations require cash payments to be made by us over varying periods of time. Certain leases are renewable at our option typically for periods of five or more years and some require payments upon early termination.
(4)Financing lease obligations relate to equipment leases. We are obligated to make cash payments in connection with various lease obligations and purchase commitments and all obligations require cash payments to be made by us over varying periods of time. Certain leases have purchase option at the conclusion of the lease agreement.
Critical Accounting Estimates
The preparation of our consolidated financial statements in accordance with GAAP requires management to make estimates and assumptions that affect the reported amounts of assets and liabilities, disclosures of contingent assets and liabilities at the date of the financial statements, and the reported amounts of sales and expenses during the reported periods. The SEC has defined a company’s critical accounting policies as the ones that are most important to the portrayal of a company’s financial condition and results of operations, and which require a company to make its most difficult and subjective judgments. Based on this definition, we have identified the critical accounting policies and judgments, which are disclosed in this Annual Report on Form 10-K for the fiscal year ended September 28, 2024. We base these estimates on historical results and various other assumptions we believe to be reasonable, all of which form the basis for making estimates concerning the carrying values of assets and liabilities that are not readily available from other sources. Actual results may differ from these estimates.
Vendor Rebates
Many of our vendor arrangements provide for us to receive specified amounts of consideration meet the criteria defined in the agreement. Generally, the criteria relate to the volume level of purchases. We calculate the amount earned based on actual purchases, recorded as a reduction of the prices of the vendor’s products and therefore a reduction of inventory at the end of each period based on a detailed analysis of inventory and of the facts and circumstances of various contractual agreements with vendors. We recognize rebates based on an estimated recognition pattern using historical data, and we record this as a reduction of cost of merchandise and services sold in our consolidated statements of operations. We do not believe there is a reasonable likelihood there will be a material change in the future estimates or assumptions we use to calculate our reduction of inventory.
Inventories
Inventories are stated at the lower of cost or net realizable value. We value inventory using the average cost method which includes costs incurred to deliver inventory to our distribution centers including transportation, warehousing and distribution costs. We evaluate inventory for excess and obsolescence and record necessary reserves. We provide provisions for losses related to inventories based on management’s judgment regarding historical purchase cost, selling price, margin, and current business trends. If actual demand or market conditions are different than those projected by management, future margins may be unfavorably or favorably affected by adjustments to these estimates. When an inventory item is sold or disposed, the associated reserve is released at that time. We do not believe there is a reasonable likelihood that there will be a material change in the future estimates or assumptions used to calculate our inventory reserve.
Goodwill and Other Intangibles, Net
Goodwill and intangible assets are recorded at their estimated fair values at the date of acquisition. We review goodwill and indefinite-lived intangible assets for impairment annually (in the fourth quarter) or more frequently if impairment indicators arise. Goodwill can be evaluated for impairment, at our option, by first performing a qualitative assessment to determine whether a quantitative goodwill test is necessary. If it is determined, based on qualitative factors, that the fair value of the reporting unit may be more likely than not less than the carrying amount, a quantitative goodwill impairment test would be required. Additionally, we can elect to forgo a qualitative assessment and perform a quantitative test. The quantitative test is to identify if a potential impairment exists by comparing the fair value of a reporting unit with its carrying amount, including goodwill. If the carrying amount of the reporting unit exceeds the fair value, an impairment loss is recognized in an amount equal to that excess, not to exceed the carrying amount of goodwill.
If a quantitative test is performed, we would estimate the value considering the use of various valuation techniques which may use significant unobservable inputs, or Level 3 inputs, as defined by the fair value hierarchy. We include assumptions about sales growth, operating margins, discount rates and valuations multiples which consider our budgets, business plans, economic projections and marketplace data, and are believed to reflect market participant views which would exist in an exit transaction. Some of the inherent estimates and assumptions used in this analysis are outside the control of management, including cost of capital, tax rates and market EBITDA comparable financial metrics.
For our indefinite life intangible assets, a qualitative assessment can also be performed to determine whether the existence of events and circumstances indicates it is more likely than not the intangible asset is impaired. Similar to goodwill, we can also elect to forgo a qualitative test for indefinite life intangible assets and perform a quantitative test. Upon performing the quantitative test, if the carrying value of the intangible asset exceeds its fair value, an impairment loss is recognized in an amount equal to that excess. We evaluate whether certain trade names continue to have an indefinite life annually.
We performed a quantitative assessment of goodwill during the fourth quarter of 2025 and recorded a $180.7 million impairment. See Note 3 - Goodwill and Other Intangibles, Net to our consolidated financial statements included elsewhere in this Annual Report on Form
10-K for further discussion.
Recent Accounting Pronouncements
For information regarding recent accounting pronouncements, see Note 2—Summary of Significant Accounting Policies to our consolidated financial statements included elsewhere in this Annual Report on Form 10-K.
Item 7A. Quantitative and Qualitative Disclosures About Market Risk.
Interest Rate Risk
The interest rates on borrowings under our Revolving Credit Facility and Term Loan were LIBOR-based rates prior to March 2023 and June 2023. Due to the discontinuation of LIBOR-based rates, we have transitioned the impacted interest rate benchmarks to Term SOFR-based rates. See Note 9—Long-Term Debt, Net to our consolidated financial statements included elsewhere in this Annual Report on Form 10-K for additional information. Accordingly, we are subject to interest rate risk in connection with borrowings under our Revolving Credit Facility and Term Loan, both of which bear interest at variable rates. As of October 4, 2025, we had $756.7 million outstanding on our Term Loan. No amounts were outstanding on our Revolving Credit Facility as of such date. The impact of a 1.0% rate change on our outstanding balance less contractual amortization would total approximately $7.6 million over the next 12 months.
Impact of Inflation and Deflation
We experience inflation and deflation related to our purchase of certain products. This price volatility could potentially have a material impact on our financial condition and/or our results of operations. We actively manage the impact of inflation, including tariffs, through strong relationships with our diverse supplier base, vendor negotiation, and promotion management. We also strategically invest through inventory purchases in order to obtain favorable pricing ahead of any vendor price increases. In order to mitigate price volatility, we monitor price fluctuations and may adjust our selling prices accordingly; however, our ability to recover higher costs through increased pricing may be limited by the competitive environment in which we operate. Although we may experience periodic effects on sales, gross profit, gross margins, and cash flows as a result of changing prices, we do not expect the effect of inflation or deflation to have a material impact on our ability to execute our long-term business strategy. We currently do not use derivative instruments to manage these risks.
Item 8. Financial Statements and Supplementary Data.
LESLIE’S, INC.
INDEX TO CONSOLIDATED FINANCIAL STATEMENTS
Audited Consolidated Financial Statements for the fiscal years ended October 4, 2025, September 28, 2024, and September 30, 2023
Report of Independent Registered Public Accounting Firm
To the Stockholders and the Board of Directors of Leslie’s, Inc.
Opinion on the Financial Statements
We have audited the accompanying consolidated balance sheets of Leslie’s, Inc. (the Company) as of October 4, 2025 and September 28, 2024, the related consolidated statements of operations, stockholders’ deficit and cash flows for each of the three years in the period ended October 4, 2025, and the related notes (collectively referred to as the “consolidated financial statements”). In our opinion, the consolidated financial statements present fairly, in all material respects, the financial position of the Company at October 4, 2025 and September 28, 2024, and the results of its operations and its cash flows for each of the three years in the period ended October 4, 2025, in conformity with U.S. generally accepted accounting principles.
We also have audited, in accordance with the standards of the Public Company Accounting Oversight Board (United States) (PCAOB), the Company’s internal control over financial reporting as of October 4, 2025, based on criteria established in Internal Control-Integrated Framework issued by the Committee of Sponsoring Organizations of the Treadway Commission (2013 framework), and our report dated December 18, 2025 expressed an adverse opinion thereon.
Basis for Opinion
These financial statements are the responsibility of the Company's management. Our responsibility is to express an opinion on the Company’s financial statements based on our audits. We are a public accounting firm registered with the PCAOB and are required to be independent with respect to the Company in accordance with the U.S. federal securities laws and the applicable rules and regulations of the Securities and Exchange Commission and the PCAOB.
We conducted our audits in accordance with the standards of the PCAOB. Those standards require that we plan and perform the audit to obtain reasonable assurance about whether the financial statements are free of material misstatement, whether due to error or fraud. Our audits included performing procedures to assess the risks of material misstatement of the financial statements, whether due to error or fraud, and performing procedures that respond to those risks. Such procedures included examining, on a test basis, evidence regarding the amounts and disclosures in the financial statements. Our audits also included evaluating the accounting principles used and significant estimates made by management, as well as evaluating the overall presentation of the financial statements. We believe that our audits provide a reasonable basis for our opinion.
Critical Audit Matters
The critical audit matters communicated below are matters arising from the current period audit of the financial statements that were communicated or required to be communicated to the audit committee and that: (1) relate to accounts or disclosures that are material to the financial statements and (2) involved our especially challenging, subjective or complex judgments. The communication of critical audit matters does not alter in any way our opinion on the consolidated financial statements, taken as a whole, and we are not, by communicating the critical audit matters below, providing separate opinions on the critical audit matters or on the accounts or disclosures to which they relate.
Vendor Rebates
|
|
Description of the Matter |
As discussed in Note 2 to the consolidated financial statements, certain of the Company’s arrangements with vendors provide for consideration when the Company meets the criteria defined in the vendor agreements. Such consideration is generally based on purchase volume. The Company accounts for vendor rebate programs as a reduction of the prices of the vendor’s products and therefore a reduction of the cost of inventory. The Company estimates the recognition pattern of vendor rebate income based on historical trending and data and recognizes such consideration as a reduction of cost of merchandise and services sold. The Company had $4.6 million of vendor rebate receivables as of October 4, 2025. |
|
|
How We Addressed the Matter in Our Audit |
Auditing vendor rebates was challenging due to the extent of audit effort required resulting from the volume of individual transactions and the subjective assumptions used in the recognition of the vendor rebate income. We obtained an understanding, evaluated the design and tested the operating effectiveness of the Company’s controls over vendor rebates process, including controls over management’s review of the data used to calculate the earned vendor rebate and the assumptions used in the recognition of the vendor rebate income. To test the vendor rebates, we performed audit procedures that included, among others, assessing the estimation methodology used by management. We agreed inputs used in the Company’s model to a sample of vendor rebate agreements and evaluated the relevant terms of the agreements. We recalculated the amount of vendor rebate income earned and the related reduction of the carrying cost of inventory based on the inputs and the terms of the agreements. We tested the Company’s pattern of recognition of vendor rebate income as a reduction of cost of merchandise and services sold and tested deferred rebate income for appropriateness and consistency with authoritative accounting guidance. In addition, we selected a sample of vendor rebate receivables and confirmed the amount outstanding directly with the vendors. |
Description of the Matter How We Addressed the Matter in Our Audit |
Goodwill As discussed in Notes 2 and 3 to the consolidated financial statements, the Company’s goodwill is evaluated for impairment at least annually, or more frequently if impairment indicators arise. If goodwill is determined to be impaired, an impairment loss is measured as the amount by which the reporting unit’s carrying amount exceeds its fair value, not to exceed the carrying amount of goodwill. As a result of identifying impairment indicators, the Company performed quantitative impairment tests during the third and fourth quarters and, in the fourth quarter, concluded that the estimated fair value of its single reporting unit exceeded the carrying value, resulting in a full goodwill impairment loss of $180.7 million. Significant, subjective assumptions used in the Company’s fair value estimate included debt fair value, the discount rate and forecasted revenue growth, cost of merchandise and services sold and selling, general and administrative expenses. Auditing the Company’s goodwill impairment test was subjective due to the significant estimation required to determine fair value and required the involvement of a specialist in estimating the fair value of the single reporting unit. In particular, the fair value estimate was sensitive to the significant assumptions described above applied in estimating the reporting unit’s fair value which may be affected by future market conditions. Additionally, auditing the Company's goodwill impairment test was impacted by a material weakness in internal controls over the accounting for asset impairments. After giving consideration to the material weakness, our audit procedures to test the estimated fair value of the reporting unit, specifically using the income approach, included, among others, assessing the valuation methodology used to determine the fair value, testing the significant assumptions discussed above and testing the completeness and accuracy of the underlying data used by the Company. For example, we evaluated management’s forecasted cash flows used in the fair value estimate by comparing those assumptions to the historical results of the Company. Additionally, we performed sensitivity analyses of the significant assumptions to evaluate the effect on the fair value estimate of the reporting unit. We audited the reconciliation of that fair value estimate to the total invested capital (including market capitalization) of its reporting unit in consideration of a market-participant control premium based on observable market information. We also involved a valuation specialist to assist in reviewing the valuation methodology and testing whether assumptions such as the discount rate were comparable to observable market data. |
/s/ Ernst & Young LLP
We have served as the Company’s auditor since 2000.
Phoenix, Arizona
December 18, 2025
LESLIE’S, INC.
Consolidated Balance Sheets
(Amounts in Thousands, Except Share and Per Share Amounts)
|
|
|
|
|
|
|
|
|
|
|
October 4, 2025 |
|
|
September 28, 2024 |
|
Assets |
|
|
|
|
|
|
Current assets |
|
|
|
|
|
|
Cash and cash equivalents |
|
$ |
64,340 |
|
|
$ |
108,505 |
|
Accounts and other receivables, net |
|
|
23,217 |
|
|
|
45,467 |
|
Inventories, net |
|
|
207,983 |
|
|
|
234,283 |
|
Prepaid expenses and other current assets |
|
|
33,249 |
|
|
|
34,179 |
|
Total current assets |
|
|
328,789 |
|
|
|
422,434 |
|
Property and equipment, net |
|
|
92,544 |
|
|
|
98,447 |
|
Operating lease right-of-use assets |
|
|
252,988 |
|
|
|
270,488 |
|
Goodwill and other intangibles, net |
|
|
30,732 |
|
|
|
215,127 |
|
Deferred tax assets |
|
|
— |
|
|
|
4,168 |
|
Other assets |
|
|
36,422 |
|
|
|
39,661 |
|
Total assets |
|
$ |
741,475 |
|
|
$ |
1,050,325 |
|
Liabilities and stockholders’ deficit |
|
|
|
|
|
|
Current liabilities |
|
|
|
|
|
|
Accounts payable |
|
$ |
51,894 |
|
|
$ |
67,622 |
|
Accrued expenses and other current liabilities |
|
|
82,447 |
|
|
|
106,713 |
|
Operating lease liabilities |
|
|
74,720 |
|
|
|
63,357 |
|
Income taxes payable |
|
|
— |
|
|
|
1,127 |
|
Current portion of long-term debt |
|
|
— |
|
|
|
8,100 |
|
Total current liabilities |
|
|
209,061 |
|
|
|
246,919 |
|
Deferred tax liabilities |
|
|
287 |
|
|
|
— |
|
Operating lease liabilities, noncurrent |
|
|
185,076 |
|
|
|
209,067 |
|
Long-term debt, net |
|
|
752,055 |
|
|
|
769,065 |
|
Other long-term liabilities |
|
|
2,988 |
|
|
|
2,423 |
|
Total liabilities |
|
|
1,149,467 |
|
|
|
1,227,474 |
|
Commitments and contingencies |
|
|
|
|
|
|
Stockholders’ deficit |
|
|
|
|
|
|
Common stock, $0.001 par value, 50,000,000 shares authorized and 9,290,311 and 9,248,464 issued and outstanding as of October 4, 2025 and September 28, 2024 |
|
|
9 |
|
|
|
9 |
|
Additional paid in capital |
|
|
113,174 |
|
|
|
107,047 |
|
Retained deficit |
|
|
(521,175 |
) |
|
|
(284,205 |
) |
Total stockholders’ deficit |
|
|
(407,992 |
) |
|
|
(177,149 |
) |
Total liabilities and stockholders’ deficit |
|
$ |
741,475 |
|
|
$ |
1,050,325 |
|
See accompanying notes which are an integral part of these consolidated financial statements.
LESLIE’S, INC.
Consolidated Statements of Operations
(Amounts in Thousands, Except Per Share Amounts)
|
|
|
|
|
|
|
|
|
|
|
|
|
|
|
Year Ended |
|
|
|
October 4, 2025 |
|
|
September 28, 2024 |
|
|
September 30, 2023 |
|
Sales |
|
$ |
1,241,915 |
|
|
$ |
1,330,121 |
|
|
$ |
1,451,209 |
|
Cost of merchandise and services sold |
|
|
802,268 |
|
|
|
853,331 |
|
|
|
902,986 |
|
Gross profit |
|
|
439,647 |
|
|
|
476,790 |
|
|
|
548,223 |
|
Selling, general and administrative expenses |
|
|
425,676 |
|
|
|
419,673 |
|
|
|
446,044 |
|
Impairment |
|
|
183,826 |
|
|
|
— |
|
|
|
— |
|
Operating (loss) income |
|
|
(169,855 |
) |
|
|
57,117 |
|
|
|
102,179 |
|
Interest expense |
|
|
62,919 |
|
|
|
70,395 |
|
|
|
65,438 |
|
Net (loss) income before taxes |
|
|
(232,774 |
) |
|
|
(13,278 |
) |
|
|
36,741 |
|
Income tax expense |
|
|
4,196 |
|
|
|
10,101 |
|
|
|
9,499 |
|
Net (loss) income |
|
$ |
(236,970 |
) |
|
$ |
(23,379 |
) |
|
$ |
27,242 |
|
(Loss) earnings per share: |
|
|
|
|
|
|
|
|
|
Basic |
|
$ |
(25.57 |
) |
|
|
(2.53 |
) |
|
$ |
2.96 |
|
Diluted |
|
$ |
(25.57 |
) |
|
$ |
(2.53 |
) |
|
$ |
2.95 |
|
Weighted average shares outstanding: |
|
|
|
|
|
|
|
|
|
Basic |
|
|
9,268 |
|
|
|
9,234 |
|
|
|
9,191 |
|
Diluted |
|
|
9,268 |
|
|
|
9,234 |
|
|
|
9,234 |
|
See accompanying notes which are an integral part of these consolidated financial statements.
LESLIE’S, INC.
Consolidated Statements of Stockholders’ Deficit
(Amounts in Thousands)
|
|
|
|
|
|
|
|
|
|
|
|
|
|
|
|
|
|
|
|
|
|
|
Common Stock |
|
|
Additional
Paid in
Capital |
|
|
Retained |
|
|
Total
Stockholders’ |
|
|
|
Shares |
|
|
Amount |
|
|
(Deficit) |
|
|
Deficit |
|
|
Deficit |
|
Balance, October 1, 2022 |
|
|
9,174 |
|
|
$ |
9 |
|
|
$ |
90,109 |
|
|
$ |
(288,068 |
) |
|
$ |
(197,950 |
) |
Issuance of common stock under the Incentive Plan |
|
|
52 |
|
|
|
— |
|
|
|
— |
|
|
|
— |
|
|
|
— |
|
Equity-based compensation |
|
|
— |
|
|
|
— |
|
|
|
11,703 |
|
|
|
— |
|
|
|
11,703 |
|
Restricted stock units surrendered in lieu of withholding taxes |
|
|
(9 |
) |
|
|
— |
|
|
|
(2,357 |
) |
|
|
— |
|
|
|
(2,357 |
) |
Net income |
|
|
— |
|
|
|
— |
|
|
|
— |
|
|
|
27,242 |
|
|
|
27,242 |
|
Balance, September 30, 2023 |
|
|
9,217 |
|
|
$ |
9 |
|
|
$ |
99,455 |
|
|
$ |
(260,826 |
) |
|
$ |
(161,362 |
) |
Issuance of common stock under the Incentive Plan |
|
|
39 |
|
|
|
— |
|
|
|
— |
|
|
|
— |
|
|
|
- |
|
Equity-based compensation |
|
|
— |
|
|
|
— |
|
|
|
8,589 |
|
|
|
— |
|
|
|
8,589 |
|
Restricted stock units surrendered in lieu of withholding taxes |
|
|
(8 |
) |
|
|
— |
|
|
|
(997 |
) |
|
|
— |
|
|
|
(997 |
) |
Net loss |
|
|
— |
|
|
|
— |
|
|
|
— |
|
|
|
(23,379 |
) |
|
|
(23,379 |
) |
Balance, September 28, 2024 |
|
|
9,248 |
|
|
$ |
9 |
|
|
$ |
107,047 |
|
|
$ |
(284,205 |
) |
|
$ |
(177,149 |
) |
Issuance of common stock under the incentive Plan |
|
|
46 |
|
|
|
— |
|
|
|
— |
|
|
|
— |
|
|
|
— |
|
Equity-based compensation |
|
|
— |
|
|
|
— |
|
|
|
6,203 |
|
|
|
— |
|
|
|
6,203 |
|
Restricted stock units surrendered in lieu of withholding taxes |
|
|
(4 |
) |
|
|
— |
|
|
|
(76 |
) |
|
|
— |
|
|
|
(76 |
) |
Net loss |
|
|
— |
|
|
|
— |
|
|
|
— |
|
|
|
(236,970 |
) |
|
|
(236,970 |
) |
Balance, October 4, 2025 |
|
|
9,290 |
|
|
$ |
9 |
|
|
$ |
113,174 |
|
|
$ |
(521,175 |
) |
|
$ |
(407,992 |
) |
See accompanying notes which are an integral part of these consolidated financial statements.
LESLIE’S, INC.
Consolidated Statements of Cash Flows
(Amounts in Thousands)
|
|
|
|
|
|
|
|
|
|
|
|
|
|
|
Year Ended |
|
|
|
October 4, 2025 |
|
|
September 28, 2024 |
|
|
September 30, 2023 |
|
Operating Activities |
|
|
|
|
|
|
|
|
|
Net (loss) income |
|
$ |
(236,970 |
) |
|
$ |
(23,379 |
) |
|
$ |
27,242 |
|
Adjustments to reconcile net (loss) income to net cash provided by operating activities: |
|
|
|
|
|
|
|
|
|
Depreciation and amortization |
|
|
33,467 |
|
|
|
33,078 |
|
|
|
34,142 |
|
Equity-based compensation |
|
|
6,203 |
|
|
|
8,589 |
|
|
|
11,703 |
|
Amortization of deferred financing costs and debt discounts |
|
|
2,198 |
|
|
|
2,191 |
|
|
|
2,100 |
|
Impairments |
|
|
183,826 |
|
|
|
— |
|
|
|
— |
|
Provision for credit losses |
|
|
(1,401 |
) |
|
|
1,466 |
|
|
|
193 |
|
Deferred income taxes |
|
|
4,455 |
|
|
|
3,430 |
|
|
|
(6,330 |
) |
Loss on asset dispositions |
|
|
192 |
|
|
|
464 |
|
|
|
6,396 |
|
Changes in operating assets and liabilities: |
|
|
|
|
|
|
|
|
|
Accounts and other receivables |
|
|
23,651 |
|
|
|
(18,684 |
) |
|
|
16,101 |
|
Inventories |
|
|
26,300 |
|
|
|
85,879 |
|
|
|
54,331 |
|
Prepaid expenses and other current assets |
|
|
1,898 |
|
|
|
(1,019 |
) |
|
|
(3,466 |
) |
Other assets |
|
|
2,956 |
|
|
|
6,861 |
|
|
|
(9,990 |
) |
Accounts payable |
|
|
(15,728 |
) |
|
|
1,889 |
|
|
|
(97,900 |
) |
Accrued expenses |
|
|
(22,842 |
) |
|
|
5,209 |
|
|
|
(22,148 |
) |
Income taxes payable |
|
|
(1,127 |
) |
|
|
(4,655 |
) |
|
|
(6,729 |
) |
Operating lease assets and liabilities, net |
|
|
1,744 |
|
|
|
6,147 |
|
|
|
825 |
|
Net cash provided by operating activities |
|
|
8,822 |
|
|
|
107,466 |
|
|
|
6,470 |
|
Investing Activities |
|
|
|
|
|
|
|
|
|
Purchases of property and equipment |
|
|
(25,491 |
) |
|
|
(47,244 |
) |
|
|
(38,577 |
) |
Business acquisitions, net of cash acquired |
|
|
— |
|
|
|
— |
|
|
|
(15,549 |
) |
Proceeds from asset dispositions |
|
|
141 |
|
|
|
81 |
|
|
|
1,587 |
|
Net cash used in investing activities |
|
|
(25,350 |
) |
|
|
(47,163 |
) |
|
|
(52,539 |
) |
Financing Activities |
|
|
|
|
|
|
|
|
|
Borrowings on Revolving Credit Facility |
|
|
159,500 |
|
|
|
140,500 |
|
|
|
264,000 |
|
Payments on Revolving Credit Facility |
|
|
(159,500 |
) |
|
|
(140,500 |
) |
|
|
(264,000 |
) |
Repayment of long-term debt |
|
|
(27,025 |
) |
|
|
(6,075 |
) |
|
|
(8,100 |
) |
Payment on finance lease |
|
|
(536 |
) |
|
|
(145 |
) |
|
|
(347 |
) |
Payments of employee tax withholdings related to restricted stock vesting |
|
|
(76 |
) |
|
|
(998 |
) |
|
|
(2,357 |
) |
Net cash used in financing activities |
|
|
(27,637 |
) |
|
|
(7,218 |
) |
|
|
(10,804 |
) |
Net (decrease) increase in cash and cash equivalents |
|
|
(44,165 |
) |
|
|
53,085 |
|
|
|
(56,873 |
) |
Cash and cash equivalents, beginning of year |
|
|
108,505 |
|
|
|
55,420 |
|
|
|
112,293 |
|
Cash and cash equivalents, end of year |
|
$ |
64,340 |
|
|
$ |
108,505 |
|
|
$ |
55,420 |
|
Supplemental Information: |
|
|
|
|
|
|
|
|
|
Interest |
|
$ |
65,415 |
|
|
$ |
63,242 |
|
|
$ |
63,059 |
|
Income taxes, net of refunds received |
|
|
3,386 |
|
|
|
10,933 |
|
|
|
22,559 |
|
See accompanying notes which are an integral part of these consolidated financial statements.
LESLIE’S, INC.
NOTES TO THE CONSOLIDATED FINANCIAL STATEMENTS
Note 1—Business and Operations
Leslie’s, Inc. (“Leslie’s,” “we,” “our,” “us,” “its,” or the “Company”) is the leading direct-to-consumer pool and spa care brand. We market and sell pool and spa supplies and related products and services, which primarily consist of maintenance items such as chemicals, equipment and parts, and cleaning accessories, as well as safety, recreational, and fitness-related products. We currently market our products through over 1,000 company-operated locations in 39 states and e-commerce websites.
Reverse Stock Split
On September 10, 2025, our shareholders approved a series of amendments to our Seventh Amended and Restated Certificate of Incorporation (the “Certificate of Amendment”). On September 26, 2025, we filed a Certificate of Amendment with the Secretary of State of the State of Delaware to effect a reverse stock split of our comment stock at a ratio of 1-for-20 (the “Reverse Stock Split”) and proportionately decrease the number of authorized shares of the Company’s common stock, which became effective upon filing (the “Effective Time”). The Company’s common stock began trading on a Reverse Stock Split-adjusted basis on the Nasdaq Global Select Market (“Nasdaq”) as of the open of trading on September 29, 2025 under the existing ticker symbol “LESL”. The Company’s common stock is now represented by a new CUSIP number, 527064 208.
As a result of the Reverse Stock Split, every 20 shares of our common stock issued and outstanding as of the Effective Time of the Reverse Stock Split was automatically converted into one share of common stock. No fractional shares were issued as a result of the Reverse Stock Split. The Company’s transfer agent aggregated all fractional shares of common stock that would otherwise have been issuable as a result of the Reverse Stock Split and sold them at the then prevailing prices on the open market on behalf of those shareholders who would otherwise be entitled to receive such fractional shares. Shareholders who otherwise would be entitled to receive fractional shares received their respective pro rata share of the total proceeds of such sale.
In addition, as of the Effective Time and as a result of the Reverse Stock Split, proportionate adjustments were made in accordance with the terms of the Company’s 2020 Omnibus Incentive Plan (the “Incentive Plan”), with respect to the number of shares of common stock issuable under outstanding stock options, restricted stock units and performance units, and any other equity-based awards, the per-share exercise price with respect to such awards, and the number of shares of common stock reserved for future issuance under the Incentive Plan.
All share and per share amounts in the accompanying consolidated financial statements and notes to the financial statements have been retroactively adjusted to reflect the Reverse Stock Split for all periods.
Note 2—Summary of Significant Accounting Policies
Basis of Presentation and Principles of Consolidation
We prepared the accompanying consolidated financial statements following United States generally accepted accounting principles (“GAAP”). The financial statements include all normal and recurring adjustments that are necessary for a fair presentation of our financial position and operating results. The consolidated financial statements include the accounts of Leslie’s, Inc. and our subsidiaries. All significant intercompany accounts and transactions have been eliminated.
Fiscal Periods
We operate on a fiscal calendar that results in a fiscal year consisting of a 52- or 53-week period ending on the Saturday closest to September 30th. In a 52-week fiscal year, each quarter contains 13 weeks of operations; in a 53-week fiscal year, each of the first, second and third quarters includes 13 weeks of operations and the fourth quarter includes 14 weeks of operations. Fiscal 2025 is defined as the 53 weeks ended October 4, 2025, and fiscal 2024 and fiscal 2023 is defined as the 52 weeks ended September 28, 2024 and September 30, 2023.
Segment Reporting
Our Chief Operating Decision Maker is our Chief Executive Officer, who reviews financial information presented on a consolidated basis for purposes of allocating resources and assessing performance. We operate all of our locations in the United States and offer consumers similar products, services, and methods of distribution through our retail locations and e-commerce websites. As a result, we have a single reportable segment.
Seasonality
Our business is highly seasonal. Sales and earnings are highest during our third and fourth fiscal quarters, which include April through September, which represent the peak months of swimming pool use. Sales are substantially lower during our first and second fiscal quarters, when we typically generate net losses and we realize negative operating cash flow.
Use of Estimates
Management is required to make certain estimates and assumptions during the preparation of the consolidated financial statements in accordance with GAAP. These estimates and assumptions impact the reported amount of assets and liabilities and disclosures of contingent assets and liabilities as of the date of the consolidated financial statements. They also impact the reported amount of net income (loss) during any period. Actual results could differ from those estimates.
Significant estimates underlying the accompanying consolidated financial statements include inventory reserves, lease assumptions, vendor rebate programs, sales returns reserve, self-insurance liabilities, and the recoverability of intangible assets and goodwill.
Cash and Cash Equivalents
Cash and cash equivalents include cash on hand, demand deposits, money market funds and credit and debit card transactions. Our cash balance at financial institutions may exceed the FDIC insurance coverage limit. We consider all investments with an original maturity of three months or less and money market funds to be cash equivalents. All credit card and debit card transactions that process in less than seven days are classified as cash and cash equivalents.
Fair Value Measurements
We use fair value measurements to record the fair value of certain assets and to estimate the fair value of financial instruments not recorded at fair value but required to be disclosed at fair value.
To determine the fair value, we maximize the use of observable inputs and minimize the use of unobservable inputs by requiring that the most observable inputs be used when available. Observable inputs are inputs market participants would use to value an asset or liability and are developed based on market data obtained from independent sources. Unobservable inputs are inputs based on assumptions about the factors market participants would use to value an asset or liability.
The fair value hierarchy is as follows, of which the first two are considered observable and the last unobservable:
•Level 1—Quoted prices in active markets for identical assets or liabilities.
•Level 2—Inputs other than Level 1 that are observable for the asset or liability, either directly or indirectly, such as quoted prices for similar assets and liabilities in active markets; quoted prices for identical or similar assets or liabilities in markets that are not active; or other inputs that are observable or can be corroborated by observable market data by correlation or other means.
•Level 3—Unobservable inputs that are supported by little or no market activity and that are significant to the fair value of the assets or liabilities. Value is determined using pricing models, discounted cash flow methodologies, or similar techniques and also includes instruments for which the determination of fair value requires significant judgment or estimation.
As of October 4, 2025 and September 28, 2024, we held no assets that were required to be measured at fair value on a recurring basis. There were no transfers between levels in the fair value hierarchy during fiscal 2025, 2024, and 2023.
The fair value of our Amended and Restated Term Loan Credit Agreement (“Term Loan”) due in 2028 was determined to be $208.6 million and $758.2 million as of October 4, 2025 and September 28, 2024. These fair value estimates, determined to be
Level 2, are subjective in nature and involve uncertainties and matters of judgment and therefore cannot be determined with precision. Changes in assumptions could significantly affect these estimates.
We estimated the fair value of our one reporting unit in our goodwill impairment test performed using a combination of the income approach (discounted cash flow method) and market approach (comparable company multiples). Key assumptions used in the valuation techniques include future cash flow projections, long-term growth rates, and discount rates. The fair value estimates used in the goodwill impairment analysis are classified as Level 3 within the fair value hierarchy, due to significant unobservable inputs.
The carrying amounts of cash, cash equivalents, accounts receivable, accounts payable and accrued expenses approximate fair value due to the short-term maturity of these instruments.
Vendor Rebates
Many of our vendor arrangements provide for us to receive specified amounts of consideration when we meet the criteria defined in the agreement. Generally, the criteria relate to the volume level of purchases. We calculate the amount earned based on actual purchases, recorded as a reduction of the prices of the vendor’s products and therefore a reduction of inventory value at the end of each period based on a detailed analysis of inventory and of the facts and circumstances of various contractual agreements with vendors. We recognize rebates based on an estimated recognition pattern that assumes the oldest inventory is sold first, and we record this as a reduction of cost of merchandise and services sold in our consolidated statements of operations. Accounts and other receivables include vendor rebate receivables of $4.6 million and $21.8 million as of October 4, 2025 and September 28, 2024.
Allowance for Credit Losses
Allowance for credit losses is calculated based on historical experience, counterparty credit risk, consumer credit risk and application of the specific identification method.
Inventories
Inventories are stated at the lower of cost or net realizable value. We value inventory using the average cost method which includes costs incurred to deliver inventory to our distribution centers including transportation, warehousing and distribution costs. We evaluate inventory for excess and obsolescence and record necessary reserves. We provide provisions for losses related to inventories based on management’s judgment regarding historical purchase cost, selling price, margin, movements, and current business trends. If actual demand or market conditions are different than those projected by management, future margins may be unfavorably or favorably affected by adjustments to these estimates. When an inventory item is sold or disposed, the associated reserve is released at that time.
Property and Equipment, Net
Property and equipment are stated at cost, less accumulated depreciation and amortization. Costs of normal maintenance and repairs are charged to expense as incurred. Major replacements or improvements of property and equipment are capitalized. When items are sold or otherwise disposed of, the cost and related accumulated depreciation or amortization are removed from the accounts, and any resulting gain or loss is included in our consolidated statements of operations.
Depreciation and amortization are computed using the straight-line method. These charges are based on the following range of useful lives:
|
|
Building and improvements |
5-40 years |
Vehicles, machinery and equipment |
3-10 years |
Office furniture, computers and software |
3-7 years |
Leasehold improvements |
5 years, not to exceed the lease life |
We evaluate our long-lived assets for potential impairment whenever events or changes in circumstances indicate that the carrying amount of an asset group may not be recoverable. The evaluation for long-lived assets (asset group) is performed at the lowest level of identifiable cash flows, which, for location assets, is the individual location level. The assets of a physical location with indicators of impairment are evaluated for recoverability by comparing its undiscounted future cash flows with its carrying value. If the carrying value is greater than the undiscounted future cash flows, we then measure the asset’s fair value to determine whether an impairment loss should be recognized. If the resulting fair value is less than the carrying value, an impairment loss is recognized for the difference between the carrying value and the estimated fair value. Impairment charges are recorded in SG&A in our consolidated statements of operations.
We use estimates of market participant rents to calculate fair value of lease ROU assets and discounted future cash flows of the asset group to quantify fair value for other long-lived assets. These nonrecurring fair value measurements are considered Level 3 inputs as defined elsewhere in Note 2 Summary of Significant Accounting Policies - Fair Value Measurements of the notes to our consolidated financial statements. The impairment loss calculations require management to apply judgment estimating, among other things, market participant rents, future cash flows, and the discount rates that reflect the risk inherent in future cash flows. Future expected cash flows for assets in regular retail locations are based on management’s estimates of future cash flows over the remaining lease period or expected life, if shorter. For expected location closures, we evaluate whether it is necessary to shorten the useful life for any of the assets within the respective asset group.
Cloud Computing Arrangements
From time-to-time, we enter into various agreements with unaffiliated third parties for assistance with technical development work related to our security-related software and systems and other ongoing projects. Expenditures for implementation, set-up, and other upfront costs incurred in a cloud computing arrangement that is hosted by the vendor are capitalized generally in the same manner as internal use software and are recorded as other assets in our consolidated balance sheets. Such costs are amortized over the life of the related cloud computing arrangement. As of October 4, 2025 and September 28, 2024, $10.9 million and $9.4 million associated with these agreements are included in prepaid expenses and other current assets in our consolidated balance sheets, along with $34.4 million and $37.2 million associated with these agreements included in other assets in our consolidated balance sheets as of October 4, 2025 and September 28, 2024. In addition, for the year ended September 30, 2023, the Company recognized $6.3 million of expense in connection with the discontinued use of certain software subscriptions which is recorded in SG&A in our consolidated statements of operations and a corresponding $4.4 million liability for future obligations associated with these subscriptions. For the year ended October 4, 2025, there was $1.8 million liability remaining for those future obligations included in accrued expenses and other current liabilities in our consolidated balance sheets.
Goodwill and Other Intangibles, Net
Goodwill and intangible assets are recorded at their estimated fair values at the date of acquisition. We review goodwill and indefinite-lived intangible assets for impairment annually (in the fourth quarter) or more frequently if impairment indicators arise. Goodwill can be evaluated for impairment, at our option, by first performing a qualitative assessment to determine whether a quantitative goodwill test is necessary. If it is determined, based on qualitative factors, the fair value of the reporting unit may be more likely than not less than the carrying amount, a quantitative goodwill impairment test would be required. Additionally, we can elect to forgo a qualitative assessment and perform a quantitative test. The quantitative test is to identify if a potential impairment exists by comparing the fair value of a reporting unit with its carrying amount, including goodwill. If the carrying amount of the reporting unit exceeds the fair value, an impairment loss is recognized in an amount equal to that excess, not to exceed the carrying amount of goodwill.
If a quantitative test is performed, we would estimate the value considering our enterprise value and additionally the use of various valuation techniques which may use significant unobservable inputs, or Level 3 inputs, as defined by the fair value hierarchy. We include assumptions about sales growth, operating margins, discount rates and valuations multiples which consider our budgets, business plans, economic projections and marketplace data, and are believed to reflect market participant views which would exist in an exit transaction. Some of the inherent estimates and assumptions used in this analysis are outside the control of management, including cost of capital, tax rates and market EBITDA comparable financial metrics.
Finite-lived intangible assets are amortized to reflect the pattern of economic benefits consumed. We evaluate amortizable intangible assets for potential impairment whenever events or changes in circumstances indicate that the carrying amounts of the assets may not be fully recoverable. Intangible assets useful lives are reviewed annually.
For our indefinite life intangible assets, a qualitative assessment can also be performed to determine whether the existence of events and circumstances indicates it is more likely than not the intangible asset is impaired. Similar to goodwill, we can also elect to
forgo a qualitative test for indefinite life intangible assets and perform a quantitative test. Upon performing the quantitative test, if the carrying value of the intangible asset exceeds its fair value, an impairment loss is recognized in an amount equal to that excess. We evaluate whether certain trade names continue to have an indefinite life annually.
After we made our assessments, it was determined that there was no impairment related to other intangible assets in fiscal 2025, however we did record $180.7 million impairment on our goodwill during fiscal 2025. During fiscal 2024 and 2023 there was no impairment related to goodwill or other intangible assets. See Note 3 Goodwill and Other Intangibles, Net below for further details.
Leases
We enter into contractual arrangements for the utilization of certain non-owned assets which are evaluated as finance or operating leases upon commencement and are accounted for accordingly. Specifically, a contract is or contains a lease when (1) the contract contains an explicitly or implicitly identified asset and (2) we obtain substantially all of the economic benefits from the use of that underlying asset and direct how and for what purpose the asset is used during the term of the contract in exchange for consideration. We assess whether an arrangement is or contains a lease at inception of the contract.
We lease certain retail locations, warehouse and distribution space, office space, equipment, and vehicles. A substantial majority of our leases have an initial lease term of five years, typically with the option to extend the lease for at least one additional five-year term. Some of our leases may include the option to terminate in less than five years. The lease term used to calculate the right-of-use asset and lease liability at commencement includes the impacts of options to extend or terminate the lease when it is reasonably certain that we will exercise that option. When determining whether it is reasonably certain that we will exercise an option at commencement, we consider various existing economic factors, including market conditions, real estate strategies, the nature, length, and terms of the agreement, as well as the uncertainty of the condition of leased equipment at the end of the lease term. Based on these considerations, we generally conclude that the exercise of renewal options would not be reasonably certain in calculating our operating lease liability at commencement. The discount rate used to calculate the present value of lease payments is the rate implicit in the lease, when readily determinable. As the rate implicit in the lease is rarely readily determinable, we use a secured incremental borrowing rate, which is updated on a periodic basis as the discount rate for the present value of lease payments. Real estate taxes, insurance, maintenance, and operating expenses applicable to the leased property are generally our obligations under our lease agreements. In instances where these payments are fixed, they are included in the measurement of our lease liabilities, and when variable, are excluded and recognized in the period in which the obligation for those payments is incurred. For variable payments dependent upon an index or rate, we apply the active index or rate as of the lease commencement date. Variable lease payments not based on an index or rate are not included in the measurement of our operating lease liabilities as they cannot be reasonably estimated and are recognized in the period in which the obligation for those payments is incurred. Leases that have a term of 12 months or less upon commencement are considered short-term in nature and as such are not included in the measurement of our operating lease right-of-use assets and operating lease liabilities on the consolidated balance sheets and are expensed on a straight-line basis over the lease term. In addition, we do not separate lease and non-lease components (e.g., common area maintenance). Our lease agreements do not contain any material residual value guarantees or material restrictive covenants.
Revenue Recognition
Revenue is recognized when control of the promised goods or services is transferred to our customer, in an amount that reflects the consideration we expect to be entitled to in exchange for such goods or services. Revenue from merchandise sales at retail locations is recognized at the point of sale and revenue from services is recognized when the services are rendered. Revenue from e-commerce merchandise sales is recognized either at the time of pick-up at one of our locations or at the time of shipment, depending on the customer’s order designation. Revenue is recorded net of related discounts, loyalty point deferrals, and sales tax. Payment from retail customers is generally at the point of sale and payment terms for professional pool operators are based on our credit requirements and generally have terms of less than 60 days. When we receive payment from a consumer before the consumer has taken possession of the merchandise or the service has been performed, the amount received is recorded as deferred revenue or as a customer deposit until the sale or service is complete. Shipping and handling are treated as costs to fulfill the contract and not a separate performance obligation.
We estimate a liability for sales returns based on current sales levels and historical return trends. At each financial reporting date, we assess our estimates of expected returns, and a corresponding adjustment to cost of sales for our right to recover the goods returned by the customer, net of any expected recovery cost. Adjustments related to changes in return estimates were immaterial in all periods presented.
Pool Perks® allows members to earn reward points based on their purchases. Members’ spending level determines the threshold that points convert to awards. The awards may be used on future purchases. Points and awards are valid for 270 days from issuance. We defer revenue related to earned points and awards that have not yet been redeemed. The amount of deferred revenue is based on the estimated standalone selling price of points and awards earned by members and reduced by the percentage of points and awards expected to be redeemed. Estimating future redemption rates requires judgment based on current trends and historical patterns. Revenue is recognized when the rewards are redeemed and expired. To the extent we have a change in our breakage estimates, the corresponding amount of change is recognized in revenue. As of October 4, 2025 and September 28, 2024, deferred revenue related to the loyalty program was $3.5 million and $4.4 million, and is included in accrued expenses in our consolidated balance sheets.
Cost of Merchandise and Services Sold
Cost of merchandise and services sold reflects the direct cost of purchased merchandise, costs to package certain chemical products, including direct materials and labor, costs to provide services, including labor and materials, as well as distribution and occupancy costs. Distribution costs include warehousing and transportation expenses, including costs associated with third-party fulfillment centers. Occupancy costs include the rent, common area maintenance, real estate taxes, and depreciation and amortization costs of all retail locations.
Selling, General and Administrative Expenses
Our SG&A includes selling and operating expenses at our retail locations and corporate level general and administrative expenses. Selling and operating expenses at retail locations include payroll, bonus and benefit costs for personnel, supplies, and credit and debit card processing costs. Corporate expenses include payroll, bonus, and benefit costs for our corporate and field support functions, equity-based compensation, marketing and advertising, insurance, utilities, occupancy costs related to our corporate office facilities, professional services, and depreciation and amortization for all assets, except those related to our retail locations and distribution operations, which are included in cost of merchandise and services sold.
Advertising
We expense advertising costs as incurred. Advertising costs for fiscal 2025, 2024, and 2023 were $30.2 million, $33.4 million, and $35.1 million.
Income Taxes
We account for income taxes under the asset and liability method, which requires the recognition of deferred tax assets and liabilities for the future tax consequences attributable to differences between the financial statement carrying amounts and tax bases of existing assets and liabilities. Deferred tax assets, including the benefit of net operating loss and tax credit carryforwards, are evaluated based on the guidelines for realization and are reduced by a valuation allowance if it is deemed more likely than not that such assets will not be realized. We consider several factors in evaluating the realizability of our deferred tax assets, including the nature, frequency and severity of recent losses, the remaining years available for carryforwards, the timing of the reversals of year end deferred tax assets and liabilities, changes in tax laws, the future profitability of the operations in the jurisdiction, and tax planning strategies. Our judgments and estimates concerning realizability of deferred tax assets could change if any of the evaluation factors change, resulting in an increase or decrease to income tax expense in any period.
The ultimate realization of deferred tax assets can be dependent upon the generation of future taxable income during the periods in which the associated temporary differences become deductible. On a quarterly basis, we evaluate whether it is more likely than not that our deferred tax assets will be realized in the future and conclude whether a valuation allowance must be established.
We record a liability for uncertain tax positions to the extent a tax position taken or expected to be taken in a tax return does not meet certain recognition or measurement criteria. Considerable management judgment is necessary to assess the inherent uncertainties related to the interpretations of complex tax laws, regulations and taxing authority rulings. Our judgments and estimates may change as a result of the evaluation of new information, such as the outcome of tax audits or changes to or further interpretations of tax laws and regulations, resulting in an increase or decrease to income tax expense in any period. Interest and penalties accrued, if any, relating to uncertain tax positions will be recognized as a component of the income tax provision.
Equity-Based Compensation
Stock-based compensation expense is measured at grant date, based on the fair value of the award, and is recognized on a straight-line basis over the requisite service period for awards expected to vest. See Note 14—Equity-Based Compensation for further discussion.
We are self-insured for losses relating to workers’ compensation, general liability, and employee medical. Stop-loss coverage has been purchased to limit exposure to any material level of claims. Liabilities for self-insurance reserves are estimated based on independent actuarial estimates, which are based on historical information and assumptions about future events. We utilize various techniques, including analysis of historical trends and actuarial valuation methods, to estimate the cost to settle reported claims and claims incurred but not yet reported as of the balance sheet date. The actuarial valuation methods consider loss development factors, which include the development time frame and expected claim reporting and settlement patterns, and expected loss costs, which include the expected frequency and severity of claim activity.
Earnings per Share
Basic earnings per share is calculated by dividing net income by the weighted average number of shares outstanding during the period. Diluted earnings per share is computed giving effect to all potentially dilutive shares, unless their effect is antidilutive. We apply the treasury stock method for dilutive share-based awards. Performance-based share-based awards are included in diluted shares only if the related performance conditions have been considered satisfied as of the end of the reporting period. Additionally, all per share amounts have been recast to account for the Reverse Stock Split.
Recent Accounting Pronouncements
In September 2025, the Financial Accounting Standards Board (“FASB”) issued Accounting Standards Update (“ASU”) No. 2025-06, Intangibles - Goodwill and Other - Internal-Use Software (Subtopic 335-40): Targeted Improvements to the Accounting for Internal-Use Software. The guidance modernizes and clarifies the threshold for when an entity is required to start capitalizing software costs and is based on when (i) management has authorized and committed to funding the software project and (ii) it is probable that the project will be completed and the software will be used to perform the function intended. The amendments in ASU 2025-06 are effective for fiscal years beginning after December 15, 2027, and interim reporting periods within those annual reporting periods. We are currently evaluating the ASU to determine its impact on our consolidated financial statements and disclosures; however, we do not expect there to be a material impact.
In January 2025, FASB issued ASU No. 2025-01, Income Statement-Reporting Comprehensive Income-Expense Disaggregation Disclosures (Subtopic 2020-40): Disaggregation of Income Statement Expenses. This update clarifies the initial effective date for entities that do not have an annual reporting period that ends on December 31 to be the first annual reporting period beginning after December 15, 2026, and interim reporting periods beginning after December 15, 2027. We are currently evaluating the ASU to determine its impact on our disclosures; however, we do not expect there to be a material impact.
In November 2024, FASB issued ASU No. 2024-03, Income Statement-Reporting Comprehensive Income-Expense Disaggregation Disclosures (Subtopic 220-40): Disaggregation of Income Statement Expenses. This update requires additional disclosures over certain expenses, including purchases of inventory, employee compensation, depreciation, intangible asset amortization, and other specific expense categories. This standard also requires disclosure of the total amount of selling expenses and the Company's definition of selling expenses. This update is effective for fiscal years beginning after December 15, 2026, and interim periods within fiscal years beginning after December 15, 2027. Early adoption is permitted. We are currently evaluating the ASU to determine its impact on our disclosures; however, we do not expect there to be a material impact.
In December 2023, FASB issued ASU No. 2023-09, Income Taxes (Topic 740): Improvements to Income Tax Disclosures, which includes amendments that further enhance income tax disclosures, primarily through standardization and disaggregation of rate reconciliation categories and income taxes paid by jurisdiction. This update is effective for annual periods beginning after December 15, 2024, though early adoption is permitted. We are currently evaluating the ASU to determine its impact on our disclosures; however, we do not expect there to be a material impact.
In November 2023, the FASB issued ASU 2023-07, Segment Reporting (Topic 280): Improvements to Reportable Segment Disclosures. The amended guidance requires incremental reportable segment disclosures, primarily about significant segment expenses. The amendments also require entities with a single reportable segment to provide all disclosures required by these amendments, and all existing segment disclosures. The amendments will be applied retrospectively to all prior periods presented in the financial statements and is effective for fiscal years beginning after December 15, 2023, and interim periods in fiscal years
beginning after December 15, 2024, with early adoption permitted. We adopted this guidance in the fourth quarter of 2025. For additional information, see Note 16—Segment Reporting.
There are other new accounting pronouncements issued by the FASB that we have adopted or will adopt, as applicable. We do not believe any of these new accounting pronouncements have had, or will have, a material impact on our consolidated financial statements or disclosures.
Note 3—Goodwill and Other Intangibles, Net
Goodwill
The following table details the changes in goodwill (in thousands):
|
|
|
|
|
|
|
|
|
|
|
October 4, 2025 |
|
|
September 28, 2024 |
|
Balance at beginning of the year |
|
$ |
180,698 |
|
|
$ |
180,698 |
|
Acquisitions, net of measurement period adjustments |
|
|
— |
|
|
|
— |
|
Impairment |
|
|
(180,698 |
) |
|
|
— |
|
Balance at the end of the year |
|
$ |
- |
|
|
$ |
180,698 |
|
Goodwill Impairment
During our review of goodwill for impairment during the fourth quarter, management identified certain continued indicators (i.e., decline in market capitalization and reduced operating performance), which required further goodwill impairment evaluation.
As a result, we a performed a quantitative impairment test for our only reporting unit under ASC 350, Intangibles - Goodwill and Other. The fair value of the reporting unit was estimated using a combined discounted cash flow model and market approach, consistent with valuation methodologies used historically.
Key assumptions of the analysis included:
•Long-term growth rate: 2%
During the fourth quarter of 2025, we identified a decline in market capitalization and reduced operating performance as compared to the prior year and determined that indicators of impairment existed and that a quantitative test should be performed for the one reporting unit. In determining fair value, management utilized valuation techniques that maximize the use of observable inputs and minimize the use of unobservable inputs to the extent possible. The fair value technique used in this instance was classified as Level 3, where unobservable inputs are used when little or no market data was available.
In performing the quantitative test of goodwill, management primarily used the income approach method of valuation. Under the income approach, our future cash flows were estimated and present valued based on a discount rate reflecting a market participant risk-adjusted rate of return.
Significant assumptions used to determine fair value included expected sales trends, cost of sales, operating expenses, and an appropriate discount rate based on the Company's estimated cost of equity capital and after-tax cost of debt. We selected estimates used in the discounted cash flow projections using historical data as well as current and anticipated market conditions, and estimated growth rates with consideration of published industry trends. We also compared the total invested capital (including
market capitalization) to the fair value of its reporting unit to assess the reasonableness of fair value after consideration of a control premium based on observable comparable company transactions.
Based on the results of this analysis we determined that the carrying value of the reporting unit exceeded the fair value, and therefore we recorded a goodwill impairment charge of $180.7 million during fiscal 2025.
Other Intangible Assets
Other intangible assets consisted of the following as of October 4, 2025 (in thousands, except weighted average remaining useful life):
|
|
|
|
|
|
|
|
|
|
|
|
|
|
|
|
|
|
|
Weighted
Average
Remaining
Useful Life
(in Years) |
|
|
Gross
Carrying
Value |
|
|
Accumulated
Amortization |
|
|
Net
Carrying
Amount |
|
Trade name and trademarks (finite life) |
|
|
8.0 |
|
|
$ |
22,100 |
|
|
$ |
(7,366 |
) |
|
$ |
14,734 |
|
Trade name and trademarks (indefinite life) |
|
Indefinite |
|
|
|
9,350 |
|
|
|
— |
|
|
|
9,350 |
|
Non-compete agreements |
|
|
3.4 |
|
|
|
2,260 |
|
|
|
(1,578 |
) |
|
|
682 |
|
Consumer relationships |
|
|
5.9 |
|
|
|
15,400 |
|
|
|
(9,477 |
) |
|
|
5,923 |
|
Other intangibles |
|
|
3.1 |
|
|
|
4,000 |
|
|
|
(3,957 |
) |
|
|
43 |
|
Total |
|
|
|
|
$ |
53,110 |
|
|
$ |
(22,378 |
) |
|
$ |
30,732 |
|
Other intangible assets consisted of the following as of September 28, 2024 (in thousands, except weighted average remaining useful life):
|
|
|
|
|
|
|
|
|
|
|
|
|
|
|
|
|
|
|
Weighted
Average
Remaining
Useful Life
(in Years) |
|
|
Gross
Carrying
Value |
|
|
Accumulated
Amortization |
|
|
Net
Carrying
Amount |
|
Trade name and trademarks (finite life) |
|
|
8.9 |
|
|
$ |
22,100 |
|
|
$ |
(5,355 |
) |
|
$ |
16,745 |
|
Trade name and trademarks (indefinite life) |
|
Indefinite |
|
|
|
9,350 |
|
|
|
— |
|
|
|
9,350 |
|
Non-compete agreements |
|
|
4.4 |
|
|
|
2,260 |
|
|
|
(1,368 |
) |
|
|
892 |
|
Consumer relationships |
|
|
6.6 |
|
|
|
15,400 |
|
|
|
(8,038 |
) |
|
|
7,362 |
|
Other intangibles |
|
|
4.1 |
|
|
|
4,000 |
|
|
|
(3,920 |
) |
|
|
80 |
|
Total |
|
|
|
|
$ |
53,110 |
|
|
$ |
(18,681 |
) |
|
$ |
34,429 |
|
Amortization expense was $3.7 million, $3.7 million, and $4.3 million in fiscal 2025, 2024, and 2023. No impairment of other intangible assets was recorded during fiscal 2025, 2024, and 2023. No impairment of goodwill was recorded in fiscal 2024 and 2023. See above for discussion of fiscal 2025 goodwill impairment.
The following table summarizes the estimated future amortization expense related to finite-lived intangible assets on our consolidated balance sheet as of October 4, 2025 (in thousands):
|
|
|
|
|
|
|
Amount |
|
2026 |
|
|
3,379 |
|
2027 |
|
|
3,262 |
|
2028 |
|
|
3,157 |
|
2029 |
|
|
2,899 |
|
Thereafter |
|
|
8,685 |
|
Total |
|
$ |
21,382 |
|
Note 4—Accounts and Other Receivables, Net
Accounts and other receivables, net consisted of the following (in thousands):
|
|
|
|
|
|
|
|
|
|
|
October 4, 2025 |
|
|
September 28, 2024 |
|
Vendor and other rebates receivable |
|
$ |
4,463 |
|
|
$ |
24,713 |
|
Customer receivables |
|
|
16,273 |
|
|
|
18,262 |
|
Other receivables |
|
|
4,707 |
|
|
|
4,723 |
|
Allowance for credit losses |
|
|
(2,226 |
) |
|
|
(2,231 |
) |
Total |
|
$ |
23,217 |
|
|
$ |
45,467 |
|
Note 5—Inventories, net
Inventories, net consisted of the following (in thousands):
|
|
|
|
|
|
|
|
|
|
|
October 4, 2025 |
|
|
September 28, 2024 |
|
Raw materials |
|
$ |
2,022 |
|
|
$ |
3,381 |
|
Finished goods |
|
|
205,961 |
|
|
|
230,902 |
|
Total |
|
$ |
207,983 |
|
|
$ |
234,283 |
|
Changes in inventory excess and obsolescence reserves were as follows (in thousands):
|
|
|
|
|
|
|
|
|
|
|
|
|
|
|
|
|
|
|
|
|
|
Additions |
|
|
Deductions |
|
|
|
|
|
|
Balance at Beginning of Year |
|
|
Charged to Costs and Expenses |
|
|
Sale or Disposal of Inventories |
|
|
Balance at
End of Year |
|
Fiscal 2025 |
|
$ |
15,337 |
|
|
$ |
925 |
|
|
$ |
(1,670 |
) |
|
$ |
14,592 |
|
Fiscal 2024 |
|
$ |
6,924 |
|
|
$ |
8,413 |
|
|
$ |
— |
|
|
$ |
15,337 |
|
Fiscal 2023 |
|
$ |
5,871 |
|
|
$ |
4,387 |
|
|
$ |
(3,334 |
) |
|
$ |
6,924 |
|
Note 6—Prepaid Expenses and Other Current Assets
Prepaid expenses and other current assets consisted of the following (in thousands):
|
|
|
|
|
|
|
|
|
|
|
October 4, 2025 |
|
|
September 28, 2024 |
|
Prepaid insurance |
|
$ |
962 |
|
|
$ |
1,120 |
|
Prepaid occupancy costs |
|
|
2,222 |
|
|
|
2,132 |
|
Prepaid sales tax |
|
|
3,450 |
|
|
|
3,719 |
|
Prepaid maintenance |
|
|
4,644 |
|
|
|
4,388 |
|
Prepaid other |
|
|
7,736 |
|
|
|
13,380 |
|
Income tax receivable |
|
|
3,302 |
|
|
|
— |
|
Other current assets |
|
|
10,933 |
|
|
|
9,440 |
|
Total |
|
$ |
33,249 |
|
|
$ |
34,179 |
|
Note 7—Property and Equipment
Property and equipment consist of the following (in thousands):
|
|
|
|
|
|
|
|
|
|
|
October 4, 2025 |
|
|
September 28, 2024 |
|
Land |
|
$ |
5,401 |
|
|
$ |
5,401 |
|
Buildings and improvements |
|
|
10,290 |
|
|
|
10,141 |
|
Vehicles, machinery and equipment |
|
|
45,984 |
|
|
|
44,925 |
|
Leasehold improvements |
|
|
207,782 |
|
|
|
199,402 |
|
Office furniture, computers and software |
|
|
126,492 |
|
|
|
115,129 |
|
Construction in process |
|
|
5,840 |
|
|
|
9,886 |
|
Equipment under finance lease |
|
|
1,860 |
|
|
|
565 |
|
|
|
$ |
403,649 |
|
|
$ |
385,449 |
|
Less: accumulated depreciation and amortization |
|
|
(311,105 |
) |
|
|
(287,002 |
) |
Total |
|
$ |
92,544 |
|
|
$ |
98,447 |
|
Depreciation and amortization expense on property and equipment was $29.3 million, $29.2 million, and $29.8 million in fiscal 2025, 2024, and 2023. Construction in process primarily consisted of leasehold improvements related to new or remodeled locations where construction had not been completed by the end of the period and internal use software as of October 4, 2025 and September 28, 2024.
Capitalized software additions placed into service was $5.7 million and $2.1 million in fiscal 2025 and 2024. Amortization expense on capitalized software was $3.0 million, $3.9 million, and $4.9 million in fiscal 2025, 2024, and 2023. Capitalized software accumulated amortization totaled $22.1 million and $19.2 million as of October 4, 2025 and September 28, 2024. Capitalized software and development costs remaining to be amortized were $8.7 million and $6.0 million as of October 4, 2025 and September 28, 2024.
Note 8—Accrued Expenses
Accrued expenses consisted of the following (in thousands):
|
|
|
|
|
|
|
|
|
|
|
October 4, 2025 |
|
|
September 28, 2024 |
|
Accrued payroll and employee benefits |
|
$ |
20,025 |
|
|
$ |
20,813 |
|
Customer deposits |
|
|
6,406 |
|
|
|
5,289 |
|
Interest |
|
|
998 |
|
|
|
5,545 |
|
Inventory related accruals |
|
|
8,318 |
|
|
|
13,586 |
|
Loyalty and deferred revenue |
|
|
7,204 |
|
|
|
6,269 |
|
Sales tax |
|
|
9,097 |
|
|
|
8,282 |
|
Self-insurance reserves |
|
|
10,096 |
|
|
|
9,287 |
|
Other accrued liabilities |
|
|
20,303 |
|
|
|
37,642 |
|
Total |
|
$ |
82,447 |
|
|
$ |
106,713 |
|
As of October 4, 2025 and September 28, 2024, $1.4 million and $1.0 million of capital expenditures were included in other accrued liabilities.
Note 9—Long-Term Debt, Net
Our long-term debt, net consisted of the following (in thousands, except interest rates):
|
|
|
|
|
|
|
|
|
|
|
|
|
|
|
Effective
Interest Rate (1) |
|
|
October 4, 2025 |
|
|
September 28, 2024 |
|
Term Loan |
|
|
7.03 |
% |
(2) |
$ |
756,650 |
|
|
$ |
783,675 |
|
Revolving Credit Facility |
|
|
— |
% |
(3) |
|
— |
|
|
|
— |
|
Total long-term debt |
|
|
|
|
|
756,650 |
|
|
|
783,675 |
|
Less: current portion of long-term debt |
|
|
|
|
|
— |
|
|
|
(8,100 |
) |
Less: unamortized discount |
|
|
|
|
|
(1,297 |
) |
|
|
(1,818 |
) |
Less: deferred financing charges |
|
|
|
|
|
(3,298 |
) |
|
|
(4,692 |
) |
Total long-term debt, net |
|
|
|
|
$ |
752,055 |
|
|
$ |
769,065 |
|
(1)Effective interest rates as of October 4, 2025.
(2)Carries interest at a specified margin over the Term Secured Overnight Financing Rate (“SOFR”) between 2.50% and 2.75% with a minimum SOFR of 0.50% plus a SOFR adjustment.
(3)Carries interest at a specific margin between 0.25% and 0.75% with respect to base rate loans and between 1.25% and 1.75% with respect to Term SOFR loans, with a SOFR adjustment.
Term Loan
In June 2023, we entered into Amendment No. 1 (“Term Loan Amendment”) to our Term Loan. The Term Loan Amendment (i) replaced the existing LIBOR-based interest rate benchmark with a Term SOFR-based benchmark and (ii) amended certain other related terms and provisions, including the addition of a SOFR adjustment of (a) 0.11448% per annum for one-month, (b) 0.26161% per annum for three months, and (c) 0.42826% per annum for six months. The other material terms of the Term Loan remained substantially unchanged.
The Term Loan provides for an $810.0 million secured term loan facility with a maturity date of March 9, 2028. Borrowings under the Term Loan have an initial applicable rate, at our option, of (i) 2.75% for loans that are Term SOFR loans and (ii) 1.75% for loans that are Alternate Base Rate, (“ABR”) loans (the “Applicable Rate”). The Applicable Rate of the Term Loan is based on our first lien leverage ratio as follows: (a) if the first lien leverage ratio is greater than 2.75 to 1.00, the applicable rate will be 2.75% for Term SOFR loans and 1.75% for ABR loans and (b) if the first lien leverage ratio is less than or equal to 2.75 to 1.00, the applicable rate will be 2.50% for Term SOFR loans and 1.50% for ABR loans. For Term SOFR loans, the loans will bear interest at the Term SOFR-based benchmark rate plus the Applicable Rate and the SOFR adjustment, as defined above.
Revolving Credit Facility
In March 2023, we entered into Amendment No. 6 to our $200.0 million credit facility (“Revolving Credit Facility”) maturing on August 13, 2025 (the “Amendment”). The Amendment (i) increased the revolving credit commitments under the Revolving Credit Facility in the amount of $50.0 million, such that the aggregate commitments are $250.0 million and (ii) replaced the existing LIBOR-based rate with a Term SOFR-based rate, as an interest rate benchmark. The Revolving Credit Facility has (i) an applicable margin on base rate loans with a range of 0.25% to 0.75%, (ii) an applicable margin on Term SOFR loans with a range of 1.25% and 1.75%, (iii) a SOFR Adjustment of 0.10% for all borrowing periods, (iv) a floor of 0% per annum, and (v) a commitment fee rate of 0.25% per annum. The other material terms of the Revolving Credit Facility prior to the Amendment remained substantially unchanged.
On April 3, 2024, we entered into Amendment No. 7 to our Revolving Credit Facility (the “2024 Amendment”). The 2024 Amendment (i) extended the maturity date to April 3, 2029 and (ii) revised the applicable margin on Term SOFR and base rate loans. The other material terms of the Revolving Credit Facility prior to the 2024 Amendment remained substantially unchanged.
As of October 4, 2025 and September 28, 2024, no amounts were outstanding under the Revolving Credit Facility. The amount available under our Revolving Credit Facility increased by $11.7 million and $10.4 million of existing standby letters of credit as of October 4, 2025 and September 28, 2024.
Representations and Covenants
Substantially all of our assets are pledged as collateral to secure our indebtedness. The Term Loan does not require us to comply with any financial covenants. The Term Loan and the Revolving Credit Facility contain customary representations and warranties, covenants, and conditions to borrowing. No events of default occurred as of October 4, 2025 and September 28, 2024.
Future Debt Maturities
The following table summarizes the debt maturities and scheduled principal repayments of our indebtedness as of October 4, 2025 (in thousands):
|
|
|
|
|
|
|
Amount |
|
2026 |
|
|
— |
|
2027 |
|
|
— |
|
2028 |
|
|
756,650 |
|
2029 |
|
|
— |
|
Thereafter |
|
|
— |
|
Total |
|
$ |
756,650 |
|
Note 10—Leases
Leases
We lease certain locations, office, distribution, and manufacturing facilities under operating leases that expire at various dates through May 2049. We are obligated to make cash payments in connection with various lease obligations and purchase commitments. All of these obligations require cash payments to be made by us over varying periods of time. Certain leases are renewable at our option typically for periods of five or more years. Certain of these arrangements are cancelable on short notice and others require payments upon early termination. Our lease expense is recorded in cost of goods sold for our store related leases and SG&A for all others.
The following table summarizes the components of lease expense (in thousands):
|
|
|
|
|
|
|
|
|
|
|
Year Ended |
|
|
|
October 4, 2025 |
|
|
September 28, 2024 |
|
Operating lease expense |
|
$ |
89,211 |
|
|
$ |
83,982 |
|
Finance lease amortization of ROU asset |
|
|
456 |
|
|
|
165 |
|
Finance lease interest on lease liability |
|
|
90 |
|
|
|
15 |
|
Total net lease expense |
|
$ |
89,757 |
|
|
$ |
84,162 |
|
As of October 4, 2025 and September 28, 2024, operating lease right-of-use assets obtained in exchange for operating lease liabilities totaled $3.9 million and $12.3 million.
As of October 4, 2025 and September 28, 2024, finance lease right-of-use assets obtained in exchange for finance lease liabilities totaled $1.3 million and $0.6 million.
During the year ended October 4, 2025 we recorded $3.1 million in impairment on right-of-use assets related to underperforming stores, which had a aggregated fair value of $2.0 million at the time of impairment. During the year ended September 28, 2024 there were no impairments.
The following table presents the weighted-average remaining lease term and discount rate for both operating and financing leases:
|
|
|
|
|
|
|
|
|
|
|
October 4, 2025 |
|
|
September 28, 2024 |
|
Weighted-average remaining operating lease term |
|
5.0 years |
|
|
5.3 years |
|
Weighted-average discount rate - operating leases |
|
|
6.5 |
% |
|
|
6.4 |
% |
Weighted-average remaining finance lease term |
|
5.5 years |
|
|
1.4 years |
|
Weighted-average discount rate - finance leases |
|
|
6.4 |
% |
|
|
5.0 |
% |
The following table summarizes the future annual minimum lease payments for both operating and financing leases as of October 4, 2025 (in thousands):
|
|
|
|
|
|
|
|
|
|
|
Operating |
|
|
Financing |
|
2026 |
|
$ |
89,454 |
|
|
$ |
315 |
|
2027 |
|
|
75,314 |
|
|
|
209 |
|
2028 |
|
|
51,615 |
|
|
|
209 |
|
2029 |
|
|
37,052 |
|
|
|
209 |
|
2030 |
|
|
19,195 |
|
|
|
209 |
|
Thereafter |
|
|
41,827 |
|
|
|
419 |
|
Total |
|
$ |
314,457 |
|
|
$ |
1,570 |
|
Less: amount of lease payments representing imputed interest |
|
|
54,661 |
|
|
|
289 |
|
Present value of future minimum lease payments |
|
|
259,796 |
|
|
|
1,281 |
|
Less: current lease liabilities |
|
|
74,720 |
|
|
|
243 |
|
Lease liabilities, noncurrent |
|
$ |
185,076 |
|
|
$ |
1,038 |
|
Note 11—Income Taxes
The provision for income taxes consists of the following (in thousands):
|
|
|
|
|
|
|
|
|
|
|
|
|
|
|
Year Ended |
|
|
|
October 4, 2025 |
|
|
September 28, 2024 |
|
|
September 30, 2023 |
|
Current: |
|
|
|
|
|
|
|
|
|
Federal |
|
$ |
684 |
|
|
$ |
5,517 |
|
|
$ |
13,425 |
|
State |
|
|
(943 |
) |
|
|
1,154 |
|
|
|
2,404 |
|
Total Current |
|
|
(259 |
) |
|
|
6,671 |
|
|
|
15,829 |
|
Deferred: |
|
|
|
|
|
|
|
|
|
Federal |
|
|
1,119 |
|
|
|
2,879 |
|
|
|
(5,608 |
) |
State |
|
|
3,336 |
|
|
|
551 |
|
|
|
(722 |
) |
Total Deferred |
|
|
4,455 |
|
|
|
3,430 |
|
|
|
(6,330 |
) |
Total income tax provision |
|
$ |
4,196 |
|
|
$ |
10,101 |
|
|
$ |
9,499 |
|
A reconciliation of the provision for income taxes to the amount computed at the federal statutory rate is as follows (in thousands):
|
|
|
|
|
|
|
|
|
|
|
|
|
|
|
Year Ended |
|
|
|
October 4, 2025 |
|
|
September 28, 2024 |
|
|
September 30, 2023 |
|
Federal income tax at statutory rate |
|
$ |
(48,883 |
) |
|
$ |
(2,788 |
) |
|
$ |
7,716 |
|
Equity-based compensation |
|
|
1,409 |
|
|
|
1,430 |
|
|
|
129 |
|
Section 162(m) limitation |
|
|
193 |
|
|
|
651 |
|
|
|
520 |
|
Goodwill impairment |
|
|
13,421 |
|
|
|
— |
|
|
|
— |
|
Permanent differences |
|
|
92 |
|
|
|
87 |
|
|
|
82 |
|
Change in valuation allowance |
|
|
44,998 |
|
|
|
11,177 |
|
|
|
— |
|
State taxes, net of federal benefit |
|
|
(6,949 |
) |
|
|
(82 |
) |
|
|
1,109 |
|
Credits |
|
|
(264 |
) |
|
|
(318 |
) |
|
|
— |
|
Other |
|
|
179 |
|
|
|
(56 |
) |
|
|
(57 |
) |
Total income tax provision |
|
$ |
4,196 |
|
|
$ |
10,101 |
|
|
$ |
9,499 |
|
Our effective income tax rate for fiscal 2025 was (1.8)% as compared to (76.1)% in fiscal 2024.
The tax effects of temporary differences that give rise to significant portions of deferred tax assets and liabilities are summarized below (in thousands):
|
|
|
|
|
|
|
|
|
|
|
October 4, 2025 |
|
|
September 28, 2024 |
|
Deferred tax assets: |
|
|
|
|
|
|
Compensation accruals |
|
$ |
3,076 |
|
|
$ |
2,063 |
|
Inventories |
|
|
4,553 |
|
|
|
4,564 |
|
Lease liabilities |
|
|
64,063 |
|
|
|
67,046 |
|
Equity-based compensation |
|
|
1,415 |
|
|
|
1,996 |
|
Intangibles |
|
|
20,599 |
|
|
|
— |
|
Reserves and other accruals |
|
|
5,578 |
|
|
|
6,590 |
|
Interest limitation |
|
|
23,621 |
|
|
|
14,858 |
|
Capitalized research expenditures |
|
|
3,447 |
|
|
|
1,646 |
|
Other |
|
|
778 |
|
|
|
— |
|
Total deferred tax assets |
|
|
127,130 |
|
|
|
98,763 |
|
Deferred tax liabilities: |
|
|
|
|
|
|
Property, plant, and equipment |
|
|
(5,268 |
) |
|
|
(4,649 |
) |
Intangibles |
|
|
(2,050 |
) |
|
|
(8,299 |
) |
Lease assets |
|
|
(61,496 |
) |
|
|
(65,646 |
) |
Deferred financing cost |
|
|
(202 |
) |
|
|
(218 |
) |
Other |
|
|
(2,226 |
) |
|
|
(4,606 |
) |
Total deferred tax liabilities |
|
|
(71,242 |
) |
|
|
(83,418 |
) |
Valuation allowance |
|
|
(56,175 |
) |
|
|
(11,177 |
) |
Deferred tax assets (liabilities), net |
|
$ |
(287 |
) |
|
$ |
4,168 |
|
Management assesses the available positive and negative evidence to estimate if sufficient future taxable income will be generated to realize the existing deferred tax assets. The interest expense limitation passed in the Tax Cuts and Jobs Act created a deferred tax asset for the year ended September 28, 2024, and we recorded a valuation allowance of $11.2 million. We performed an analysis of the reversal of the deferred tax assets and liabilities, considered the historical earnings and overall business environment, as well as positive and negative evidence of the realizability of deferred tax assets for the year ended October 4, 2025. Based on this analysis, we do not believe it is more likely than not that the net deferred tax assets would be realized, which resulted in a valuation allowance of $56.2 million as of October 4, 2025.
As of October 4, 2025, we had $1.9 million and $12.7 million in net operating losses for federal and state tax return purposes, respectively. The federal and certain state net operating losses can be carried forward indefinitely, while most state net operating losses will expire at various dates beginning in fiscal 2036.
We are subject to United States federal and state taxes in the normal course of business and our income tax returns are subject to examination by the relevant tax authorities. We are no longer subject to United States federal examinations by taxing authorities for fiscal years before 2022, and, with few exceptions, are no longer subject to state examinations for fiscal years before 2021.
Our liability for unrecognized tax benefits is as follows (in thousands):
|
|
|
|
|
|
|
|
|
|
|
October 4, 2025 |
|
|
September 28, 2024 |
|
Balance at beginning of period |
|
$ |
392 |
|
|
$ |
— |
|
Gross increases - tax positions in prior period |
|
|
658 |
|
|
|
— |
|
Gross increases - tax positions in current period |
|
|
669 |
|
|
|
392 |
|
Balance at end of period |
|
$ |
1,719 |
|
|
$ |
392 |
|
The total amount of gross unrecognized tax benefits was $1.7 million as of October 4, 2025. The portion of unrecognized tax benefits that if recognized would affect the annual effective tax rate was $1.6 million and $0.3 million as of October 4, 2025 and September 28, 2024, respectively, before consideration of the valuation allowance. The portion of unrecognized tax benefits after consideration of the valuation allowance that if recognized would affect the annual effective tax rate was $1.1 million, and $0.3 million as of October 4, 2025 and September 28, 2024, respectively.
We recognize interest accrued related to unrecognized tax benefits and penalties as income tax expense. No material amounts were recognized during any of the periods presented. We do not expect a significant increase or significant decrease in our liability for unrecognized tax benefits in the next 12 months.
In August 2022, the Inflation Reduction Act of 2022 was signed into law and contains provisions effective January 1, 2023 which were not material to the Company's income tax provision.
On July 4, 2025, the One Big Beautiful Bill Act was signed into law but did not have a material impact on our fiscal 2025 financial results. Among other provisions, this act includes permanently extending and modifying certain expiring provisions of the 2017 Tax Cuts and Jobs Act and immediate expensing of domestic research and development expenses. The benefit resulting from the reinstatement of 100% bonus depreciation on assets placed in service after January 19, 2025, has been reflected in the provision. Due to the effective dates of certain provisions in the bill, the immediate expensing of domestic research and development expenses and the return of the EBITDA threshold in the calculation of the interest limitation will not be applicable until fiscal 2026.
Note 12—Commitments & Contingencies
Contingencies
On September 8, 2023, a class action complaint for violation of federal securities laws was filed by West Palm Beach Police Pension Fund in the U.S. District Court for the District of Arizona against us, our former Chief Executive Officer and our former Chief Financial Officer. The complaint alleges that the defendants violated federal securities laws by issuing materially false and misleading statements that failed to disclose adverse facts about our financial guidance, business operations and prospects, and seeks class certification, damages, interest, attorneys’ fees, and other relief. On April 22, 2024, the defendants filed a motion to dismiss the complaint. That court granted that motion and dismissed the claims on July 14, 2025. The court allowed the plaintiff to file a second amended complaint. On August 13, 2025, the plaintiff filed the second amended complaint. On September 12, 2025, the defendants filed a motion to dismiss the second amended complaint. That motion is fully briefed and pending before the court. Due to the early stage of this proceeding, we cannot reasonably estimate the potential range of loss, if any. We dispute the allegations of wrongdoing and intend to defend ourselves vigorously in this matter.
On March 13, 2024, March 14, 2024, and December 17, 2024, three derivative actions were separately filed in the U.S. District Courts for the Districts of Arizona and Delaware by John Clemens, Sally Flynn, and Ian Mednick, respectively, on behalf of the Company, and against its current and former officers and directors. Each of the three complaints include allegations similar to those in the securities class action, and allege that the defendant directors and officers harmed the Company by either making false or misleading statements, or allowing false or misleading statements to be made. The complaints seek the award of damages, costs, attorneys’ fees, and other declaratory relief. The two derivative actions pending in the U.S. District Court for the District of Arizona have been consolidated into a single proceeding. All of the derivative actions are stayed pending a decision on the motion to dismiss in the securities class action. Due to the early stage of these proceedings, we cannot reasonably estimate the potential range of loss, if any. We dispute the allegations of wrongdoing and intend to defend ourselves vigorously in these matters.
We are subject to other litigation, claims, and other proceedings that arise from time-to-time in the ordinary course of business. We believe these actions are routine and incidental to the business. As of October 4, 2025, we had established reserves for claims that are probable and estimable and such reserves were not significant. While we cannot feasibly predict the outcome of these matters with certainty, we believe, based on examination of these matters, experience to date and discussions with counsel, that the ultimate liability, individually or in the aggregate, will not have a material adverse effect on our business, financial position, results of operations, or cash flows.
Our workers’ compensation insurance program, general liability insurance program, and employee group medical plan have self-insurance retention features of up to $0.4 million per event. We had standby letters of credit outstanding in the amount of $11.7 million and $10.5 million as of October 4, 2025 and September 28, 2024, for the purpose of securing such obligations under our workers’ compensation self-insurance programs.
Vendor Guarantee
In August 2024, the Company entered into an amended agreement with one of its vendors in which the Company provided a guarantee of certain existing and future warranty obligations of the vendor’s products. In exchange for providing the guarantee, the Company was provided additional rebates on past and future purchases from the vendor. The amended agreement was retroactive to January 1, 2024 with a term of four years.
Under the terms of the guarantee, the Company was required to reimburse the vendor for parts used for warranty work performed. The guarantee had no limitation on the maximum potential future payment of warranty costs under the agreement. The Company recognized a liability in accrued expenses associated with this guarantee at an estimated fair value of $10.7 million. The corresponding asset related to the expected discounts on future purchases is recorded in prepaid expenses and other current assets. The amortization of this balance would have been recorded as cost of goods sold during the term of the amended agreement. As of September 28, 2024, the liability related to the guarantee was $9.5 million.
In November 2024, the Company and the vendor amended the agreement effective September 29, 2024 to eliminate the guarantee and reduce rebates on future purchases. As a result, the Company derecognized the warranty guarantee liability and the other current asset balance in the first quarter of fiscal 2025. Additionally, the Company received credit for $1.8 million of previous warranty-related expense which was recorded as a reduction to cost of goods sold.
Purchase Commitments
In addition to our lease obligations, we maintain future purchase commitments related to inventory and operational requirements.
The following table summarizes the future minimum purchase commitments as of October 4, 2025 (in thousands):
|
|
|
|
|
|
|
Amount |
|
2026 |
|
|
10,135 |
|
2027 |
|
|
7,068 |
|
2028 |
|
|
3,027 |
|
2029 |
|
|
1,946 |
|
2030 |
|
|
— |
|
Thereafter |
|
|
— |
|
Total |
|
$ |
22,176 |
|
Note 13—401(K) Plan
We provide for the benefit of our employees a voluntary defined contribution retirement plan under Section 401(k) of the Internal Revenue Code. The plan covers all eligible employees and provides for a matching contribution by us of 50% of each participant’s contribution of up to 4% of the individual’s compensation as defined. The expenses related to this plan were $1.5 million, $1.3 million, and $1.5 million in fiscals 2025, 2024 and 2023.
Note 14—Equity-Based Compensation
Equity-Based Compensation
2020 Omnibus Incentive Plan
In October 2020, we adopted the Incentive Plan, which was amended and restated by our shareholders at our 2024 Annual Meeting of Shareholders. The Plan provides for various types of awards, including non-qualified stock options to purchase Leslie’s common stock (each, a “Stock Option”), restricted stock units (“RSUs”) and performance stock units (“PSUs”) which may settle in Leslie’s, Inc. common stock to our directors, executives, and eligible employees of the Company. As of October 4, 2025, we had 0.6 million shares of common stock available for future grants under the Incentive Plan.
As of October 4, 2025, the aggregate unamortized value of all outstanding equity-based compensation awards was $7.7 million, which is expected to be recognized over a weighted average period of 2.0 years.
Stock Options
Stock Options granted under the Incentive Plan generally expire ten years from the date of grant and consist of Stock Options that vest upon satisfaction of time-based requirements. The following tables summarize our Stock Option activity under the Incentive Plan (in thousands, except per share amounts):
|
|
|
|
|
|
|
|
|
|
|
|
|
|
|
|
|
|
|
Year Ended |
|
|
|
October 4, 2025 |
|
|
September 28, 2024 |
|
|
|
Number of Options |
|
|
Weighted Average
Exercise Price |
|
|
Number of Options |
|
|
Weighted Average
Exercise Price |
|
Outstanding, Beginning |
|
|
94 |
|
|
$ |
369.15 |
|
|
|
165 |
|
|
$ |
362.00 |
|
Granted |
|
|
— |
|
|
|
— |
|
|
|
— |
|
|
|
— |
|
Exercised |
|
|
— |
|
|
|
— |
|
|
|
— |
|
|
|
— |
|
Forfeited/Expired |
|
|
(54 |
) |
|
|
350.30 |
|
|
|
(71 |
) |
|
|
352.80 |
|
Balance, Ending |
|
|
40 |
|
|
$ |
394.35 |
|
|
|
94 |
|
|
$ |
369.15 |
|
|
|
|
|
|
|
|
|
|
|
|
|
|
Vested and exercisable as of October 4, 2025 |
|
|
40 |
|
|
$ |
394.35 |
|
|
|
81 |
|
|
$ |
366.60 |
|
|
|
|
|
|
|
|
October 4, 2025 |
|
Aggregate intrinsic value of Stock Options outstanding |
|
$ |
— |
|
Unamortized value of unvested Stock Options |
|
$ |
— |
|
Weighted average years that expense is expected to be recognized |
|
|
— |
|
Weighted average remaining contractual years outstanding |
|
|
5.2 |
|
Restricted Stock Units and Performance Units
RSUs represent grants that vest ratably upon the satisfaction of time-based requirements. PSUs represent grants potentially issuable in the future based upon the Company’s achievement of certain performance conditions. The fair value of our RSUs and PSUs are calculated based on the Company’s stock price on the date of the grant.
The following table summarizes our RSU and PSU activity under the Incentive Plan (in thousands, except per share amounts):
|
|
|
|
|
|
|
|
|
|
|
|
|
|
|
|
|
|
|
Year Ended |
|
|
|
October 4, 2025 |
|
|
September 28, 2024 |
|
|
|
Number of RSUs/PSUs |
|
|
Weighted Average
Grant Date Fair Value |
|
|
Number of RSUs/PSUs |
|
|
Weighted Average
Grant Date Fair Value |
|
Outstanding, Beginning |
|
|
152 |
|
|
$ |
135.18 |
|
|
|
104 |
|
|
$ |
238.40 |
|
Granted (1) |
|
|
237 |
|
|
|
33.71 |
|
|
|
146 |
|
|
|
94.60 |
|
Vested |
|
|
(46 |
) |
|
|
148.54 |
|
|
|
(39 |
) |
|
|
186.00 |
|
Forfeited |
|
|
(89 |
) |
|
|
100.72 |
|
|
|
(59 |
) |
|
|
180.80 |
|
Balance, Ending |
|
|
254 |
|
|
$ |
50.21 |
|
|
|
152 |
|
|
$ |
135.18 |
|
(1) During the year ended October 4, 2025, 45,000 PSUs were granted subject to the Company achieving certain adjusted sales and adjusted EBITDA performance targets on a cumulative basis during fiscal years 2025, 2026, and 2027. The criteria are based on a range of performance targets in which participants may earn between 0% to 200% of the base number of awards granted. The weighted average grant date fair value of the PSUs was $48.80. The Company assesses the attainment of target payout rates each reporting period. Equity-based compensation expense is recognized for awards deemed probable of vesting.
For the year ended September 28, 2024, the Company granted 20,000 PSUs subject to the Company achieving certain adjusted net income and sales performance targets on a cumulative basis during fiscal years 2024 and 2025. The criteria are based on a range of these performance targets in which participants may earn between 0% to 200% of the base number of awards granted. The weighted average grant date fair value of the PSUs was $108.60. The Company assesses the attainment of target payout rates each reporting period. Equity-based compensation expense is recognized for awards deemed probable of vesting.
|
|
|
|
|
|
|
October 4, 2025 |
|
Unamortized value of unvested RSUs/PSUs (in thousands): |
|
$ |
7,709 |
|
Weighted average period (years) expense is expected to be recognized |
|
|
2.0 |
|
During the fiscal years ended October 4, 2025 and September 28, 2024 equity-based compensation expense was $6.2 million and $8.6 million. Equity-based compensation expense is reported in SG&A in our consolidated statements of operations.
Note 15—Earnings (Loss) Per Share
The following is a reconciliation of basic weighted average common shares outstanding to diluted weighted average common shares outstanding (in thousands, except per share amounts):
|
|
|
|
|
|
|
|
|
|
|
|
|
|
|
Year Ended |
|
|
|
October 4, 2025 |
|
|
September 28, 2024 |
|
|
September 30, 2023 |
|
Numerator: |
|
|
|
|
|
|
|
|
|
Net (loss) income |
|
$ |
(236,970 |
) |
|
$ |
(23,379 |
) |
|
$ |
27,242 |
|
Denominator: |
|
|
|
|
|
|
|
|
|
Weighted average shares outstanding - basic |
|
|
9,268 |
|
|
|
9,234 |
|
|
|
9,191 |
|
Effect of dilutive securities: |
|
|
|
|
|
|
|
|
|
Stock Options |
|
|
— |
|
|
|
— |
|
|
|
— |
|
RSUs |
|
|
— |
|
|
|
— |
|
|
|
43 |
|
Weighted average shares outstanding - diluted |
|
|
9,268 |
|
|
|
9,234 |
|
|
|
9,234 |
|
|
|
|
|
|
|
|
|
|
|
Basic (loss) earnings per share |
|
$ |
(25.57 |
) |
|
$ |
(2.53 |
) |
|
$ |
2.96 |
|
Diluted (loss) earnings per share |
|
$ |
(25.57 |
) |
|
$ |
(2.53 |
) |
|
$ |
2.95 |
|
The following number of weighted-average potentially dilutive shares were excluded from the calculation of diluted earnings (loss) per share because the effect of including such shares would have been antidilutive (in thousands):
|
|
|
|
|
|
|
|
|
|
|
|
|
|
|
Year Ended |
|
|
|
October 4, 2025 |
|
|
September 28, 2024 |
|
|
September 30, 2023 |
|
Stock Options |
|
|
52 |
|
|
|
129 |
|
|
|
176 |
|
RSUs |
|
|
178 |
|
|
|
69 |
|
|
|
107 |
|
Total |
|
|
230 |
|
|
|
198 |
|
|
|
283 |
|
Note 16—Segment Reporting
We manage our business activities on a consolidated basis and operate as a single operating segment. We derive our revenue in the United States by providing pool related goods and services to our customers through a variety of channels. The accounting policies of our operating segment are the same as those that are described in Note 2 – Summary of Significant Accounting Policies.
Our chief operating decision maker (“CODM”) is our chief executive officer, who reviews financial information presented on a consolidated basis. The CODM uses consolidated net income to assess financial performance and allocate resources. The CODM does not review assets in evaluating the results of our operating segment, and therefore such information is not presented.
The following table presents the significant segment expenses and other segment items regularly reviewed by our CODM (in thousands):
|
|
|
|
|
|
|
|
|
|
|
|
|
|
|
Year Ended |
|
|
|
October 4, 2025 |
|
|
September 28, 2024 |
|
|
September 30, 2023 |
|
Sales |
|
$ |
1,241,915 |
|
|
$ |
1,330,121 |
|
|
$ |
1,451,209 |
|
Less: |
|
|
|
|
|
|
|
|
|
Cost of merchandise and services sold(1) |
|
|
802,268 |
|
|
|
853,331 |
|
|
|
902,986 |
|
Store labor and fringe |
|
|
125,854 |
|
|
|
122,937 |
|
|
|
124,645 |
|
Merchant fees |
|
|
49,295 |
|
|
|
52,916 |
|
|
|
58,956 |
|
Direct store expense |
|
|
41,993 |
|
|
|
40,531 |
|
|
|
39,811 |
|
Marketing |
|
|
33,537 |
|
|
|
36,429 |
|
|
|
37,987 |
|
Information technology |
|
|
31,764 |
|
|
|
30,337 |
|
|
|
29,991 |
|
Other segment expense(2) |
|
|
143,233 |
|
|
|
136,523 |
|
|
|
154,654 |
|
Impairment |
|
|
183,826 |
|
|
|
— |
|
|
|
— |
|
Interest expense |
|
|
62,919 |
|
|
|
70,395 |
|
|
|
65,438 |
|
Income tax expense |
|
|
4,196 |
|
|
|
10,101 |
|
|
|
9,499 |
|
Segment net (loss) income |
|
$ |
(236,970 |
) |
|
$ |
(23,379 |
) |
|
$ |
27,242 |
|
(1) Included within cost of merchandise and services sold and other segment expenses is depreciation and amortization expense of $19.3 million, $18.1 million, and $17.8 million in fiscal years 2025, 2024, and 2023, respectively, as described in Note 2, Summary of Significant Accounting Policies.
(2) Included within other segment expense are items related to corporate payroll and bonus expense and general and regional administrative expenses.
Note 17—Subsequent Events
On November 25, 2025, subsequent to the October 4, 2025 balance sheet date, management committed to a plan to close approximately 80-90 U.S. stores that were identified as underperforming stores and one distribution center. The store closures are expected to be substantially completed by the end of first fiscal quarter of 2026. As the decision was made after the reporting date, no adjustments have been made to the accompanying financial statements. We expect to incur approximately $12.0 million to $20.0 million in one-time costs in the first quarter of 2026, primarily related to asset impairments and inventory write downs.
Item 9. Changes in and Disagreements with Accountants on Accounting and Financial Disclosure.
None.
Item 9A. Controls and Procedures.
Management’s Evaluation of Disclosure Controls and Procedures
Our disclosure controls and procedures (as defined in Rules 13a-15(e) and 15d-15(e)) are designed to ensure that information required to be disclosed by us in reports we file or submit under the Exchange Act is recorded, processed, summarized, and reported within the appropriate time periods specified in SEC rules and forms, and that such information is accumulated and communicated to our management, including our Chief Executive Officer and Chief Financial Officer, as appropriate, to allow timely discussions regarding required disclosure. We under the supervision of and with the participation of our management, including our Chief Executive Officer and Chief Financial Officer, have evaluated the effectiveness of our disclosure controls and procedures, as of October 4, 2025. Based on that evaluation, our Chief Executive Officer (Principal Executive Officer) and Chief Financial Officer (Principal Financial Officer and Principal Accounting Officer) have concluded that our disclosure controls and procedures were not effective as of October 4, 2025, due to the material weaknesses in our internal control over financial reporting described below. (We previously disclosed the inventory material weaknesses in our Annual Report on Form 10-K for the fiscal years ended September 28, 2024 and September 30, 2023.)
Limitations on Effectiveness of Controls and Procedures
In designing and evaluating our disclosure controls and procedures, management recognizes that any controls and procedures, no matter how well designed and operated, can provide only reasonable, not absolute, assurance of achieving the desired control objectives. In addition, the design of disclosure controls and procedures must reflect the fact that there are resource constraints and management is required to apply its judgment in evaluating the benefits of possible controls and procedures relative to their costs. The design of any disclosure controls and procedures is also based in part upon certain assumptions about the likelihood of future events, and there can be no assurance that any design will succeed in achieving its stated goals under all potential future conditions.
Management’s Report on Internal Control over Financial Reporting
Our management is responsible for establishing and maintaining adequate internal control over financial reporting (as defined in Rules 13a-15(f) and 15d-15(f) of the Exchange Act). Our internal control over financial reporting is a process designed to provide reasonable assurance regarding the reliability of financial reporting and the preparation of financial statements for external purposes in accordance with GAAP and includes those policies and procedures that (i) pertain to the maintenance of records that in reasonable detail accurately and fairly reflect our transactions and the dispositions of our assets; (ii) provide reasonable assurance that our transactions are recorded as necessary to permit preparation of financial statements in accordance with GAAP and that our receipts and expenditures are being made only in accordance with appropriate authorizations; and (iii) provide reasonable assurance regarding prevention or timely detection of unauthorized acquisition, use or disposition of our assets that could have a material effect on our financial statements.
Under the supervision of and with the participation of our management, we assessed the effectiveness of our internal control over financial reporting as of October 4, 2025, using the criteria set forth by the Committee of Sponsoring Organizations of the Treadway Commission in Internal Control—Integrated Framework (2013). Based on our assessment, our management concluded that we did not maintain effective internal control over financial reporting as of October 4, 2025 due to the material weaknesses described below. A material weakness is a deficiency, or a combination of deficiencies, in internal control over financial reporting, such that there is a reasonable possibility that a material misstatement of the annual or interim financial statements will not be prevented or detected on a timely basis.
As previously disclosed in our Annual Report on Form 10-K for the fiscal year ended September 28, 2024 and September 30, 2023, we identified a material weaknesses in the Company’s internal control over financial reporting related to the validation of inventory levels and the completeness and accuracy of data used in validating the appropriateness of inventory costing for a subset of the Company’s inventories and inventory reserves. We continued to identify deficiencies as of October 4, 2025, related to the appropriate cutoff of inventory in-transit from vendors and the precision of review of capitalized costs into inventory. Additionally, certain control deficiencies comprising the previously reported material weaknesses in this area continued throughout a significant portion of the year, which did not allow for a sufficient period of time to conclude on operating effectiveness of the related controls. Based on the factors considered in the aggregate, we determined the material weaknesses was not remediated and continued to exist as of October 4, 2025.
We also identified a new material weakness in the Company’s internal control over financial reporting related to the design and operation of controls over the goodwill and other long-lived asset impairments recorded as of October 4, 2025, which included deficiencies related to the design of controls for evaluating the aforementioned assets for impairment, specifically around the sequencing of evaluating these assets for impairment required under the applicable accounting literature, the timely performance and sufficiency of contemporaneous evidence of review of projected financial information provided to management’s specialist, and the precision of the review of the estimation of fair value of asset groups (primarily lease right-of-use assets and property and equipment) evaluated for impairment under Accounting Standards Codification 360-10, Impairment and Disposal of Long-Lived Assets.
These material weaknesses created a reasonable possibility that material misstatements to the consolidated financial statements would not be prevented or detected on a timely basis.
Management has analyzed the material weaknesses and performed additional analysis and procedures in preparing our consolidated financial statements. We have concluded that our consolidated financial statements fairly present, in all material respects, our financial condition, results of operations and cash flows at and for the periods presented. Ernst & Young LLP, an independent registered public accounting firm who audited and reported on our consolidated financial statements included in this report, has issued an adverse report on the effectiveness of our internal control over financial reporting as of October 4, 2025, included in their report below.
Ongoing Remediation Efforts
As previously disclosed in Part II, Item 9A. “Controls and Procedures” of our Annual Report on Form 10-K for the fiscal year ended September 28, 2024 and September 30, 2023 and in this Annual Report on Form 10-K, we continue to implement a plan to address the material weaknesses in internal control over financial reporting that are described above. We have devoted and intend to continue to devote significant time and resources to enhance the design and implementation of our existing controls and procedures and to create new complementary and compensating controls as needed. With respect to inventory controls, the following remediation activities, amongst others, have taken place as of October 4, 2025:
• examined our current controls and identified the root cause(s) for the deficiencies;
•examined and enhanced the procedures regarding certain of inventory balances, including the augmentation of employee training and validation of system generated reports utilized in performing certain reconciliations and clarification of instructions as to the process for recording adjustments to inventory as a result of physical counts and validation of data used in inventory costing;
•backfilled open roles with individuals who have the requisite accounting and internal controls knowledge and experience to complement the existing accounting team;
•examined and enhanced the procedures regarding certain of our annual physical inventory counts, including the enhancement of employee training, validation of system generated reports utilized in performing certain annual physical counts, and clarification of instructions regarding the process for recording adjustments to inventory as a result of physical counts and validation of data used in inventory costing;
•enhanced supervision of personnel during and subsequent to physical inventory counts to confirm compliance with our established policies; and,
•examined and enhanced the procedures regarding the completeness and accuracy of data utilized in computing inventory reserves.
We are further enhancing the execution of inventory controls as follows:
•assessing the specific training needs for newly hired and existing personnel and developing and delivering training programs designed to uphold our internal control standards.
With respect to asset impairments, the following remediation activities, among others, have taken place as of October 4, 2025:
•examined our current controls and identified the root cause(s) for the deficiencies; and
•implemented and enhanced controls that aid in the detection of potential material deviations that may impact our financial reporting.
We are further enhancing the design and execution of existing controls and creating new controls as needed regarding asset impairments as follows:
•enhancing management review controls to adequately document management’s review of the completeness and accuracy of the key financial and non-financial data utilized in the assessment and recognition of asset impairments;
•implementing and enhancing controls, policies and procedures related to the key financial data used in the management reviews when evaluating assets for impairment under the applicable accounting literature; and
•assessing the specific training needs for newly hired and existing personnel and developing and delivering training programs designed to uphold our internal control standards.
The actions we are taking are subject to continued senior management review as well as audit committee oversight. We intend to remediate these material weaknesses as soon as possible, and we believe the measures described above will help remediate the material weaknesses and strengthen our internal control over financial reporting. These material weaknesses will not be considered remediated until the applicable controls operate for a sufficient period of time and management has concluded through testing that these controls are operating effectively. We anticipate that our remediation activities will be completed during fiscal year 2026. We are committed to continuing to improve our internal control processes, and, as we continue to evaluate and work to improve our internal control over financial reporting, we may take additional measures to address control deficiencies, or we may modify certain remediation measures described above.
Details on Prior Material Weakness Fully Remediated During the Period
The Company has devoted significant time and resources to complete its remediation of the material weakness in its internal control over financial reporting related to the vendor rebate process disclosed in our Annual Report on Form 10-K for the fiscal years ended September 28, 2024 and September 30, 2023. With respect to the design and operation of controls over the vendor rebates process, we made the following improvements:
•examined our current controls and identified the root cause(s) for deficiencies;
•backfilled open roles with individuals who have the requisite accounting and internal controls knowledge and experience to complement the existing accounting team; and
•assessed the specific training needs for newly hired and existing personnel and developed and delivered training designed to uphold our internal control standards,
•implemented and enhanced controls that aid in the detection of potential material deviations in vendor rebates that may impact our financial reporting;
•enhanced controls to detect potential material misstatements in the data utilized to calculate vendor rebates earned and the timing of vendor rebate income recognition; and,
•implemented and enhanced controls related to technical accounting reviews of top vendor rebate agreements prior to contract execution.
Changes in Internal Control Over Financial Reporting
Our Chief Executive Officer and Chief Financial Officer, with other members of management, evaluated the changes in our internal control over financial reporting during the quarter ended October 4, 2025. Except as described above, we determined that there were no changes in our internal control over financial reporting during the quarter ended October 4, 2025 that materially affected, or are reasonably likely to materially affect, our internal control over financial reporting.
Report of Independent Registered Public Accounting Firm
To the Stockholders and the Board of Directors of Leslie’s, Inc.
Opinion on Internal Control Over Financial Reporting
We have audited Leslie’s, Inc.’s internal control over financial reporting as of October 4, 2025, based on criteria established in Internal Control—Integrated Framework issued by the Committee of Sponsoring Organizations of the Treadway Commission (2013 framework) (the COSO criteria). In our opinion, because of the effect of the material weaknesses described below on the achievement of the objectives of the control criteria, Leslie’s, Inc. (the Company) has not maintained effective internal control over financial reporting as of October 4, 2025, based on the COSO criteria.
A material weakness is a deficiency, or combination of deficiencies, in internal control over financial reporting, such that there is a reasonable possibility that a material misstatement of the company’s annual or interim financial statements will not be prevented or detected on a timely basis. The following material weaknesses were identified and included in management’s assessment. Management has identified material weaknesses in controls related to the Company’s inventory and asset impairment processes.
We also have audited, in accordance with the standards of the Public Company Accounting Oversight Board (United States) (PCAOB), the consolidated balance sheets of the Company as of October 4, 2025 and September 28, 2024, the related consolidated statements of operations, stockholders’ deficit and cash flows for each of the three years in the period ended October 4, 2025, and the related notes. These material weaknesses were considered in determining the nature, timing and extent of audit tests applied in our audit of the 2025 consolidated financial statements, and this report does not affect our report dated December 18, 2025, which expressed an unqualified opinion thereon.
Basis for Opinion
The Company’s management is responsible for maintaining effective internal control over financial reporting and for its assessment of the effectiveness of internal control over financial reporting included in the accompanying Management’s Report on Internal Control over Financial Reporting. Our responsibility is to express an opinion on the Company’s internal control over financial reporting based on our audit. We are a public accounting firm registered with the PCAOB and are required to be independent with respect to the Company in accordance with the U.S. federal securities laws and the applicable rules and regulations of the Securities and Exchange Commission and the PCAOB.
We conducted our audit in accordance with the standards of the PCAOB. Those standards require that we plan and perform the audit to obtain reasonable assurance about whether effective internal control over financial reporting was maintained in all material respects.
Our audit included obtaining an understanding of internal control over financial reporting, assessing the risk that a material weakness exists, testing and evaluating the design and operating effectiveness of internal control based on the assessed risk, and performing such other procedures as we considered necessary in the circumstances. We believe that our audit provides a reasonable basis for our opinion.
Definition and Limitations of Internal Control Over Financial Reporting
A company’s internal control over financial reporting is a process designed to provide reasonable assurance regarding the reliability of financial reporting and the preparation of financial statements for external purposes in accordance with generally accepted accounting principles. A company’s internal control over financial reporting includes those policies and procedures that (1) pertain to the maintenance of records that, in reasonable detail, accurately and fairly reflect the transactions and dispositions of the assets of the company; (2) provide reasonable assurance that transactions are recorded as necessary to permit preparation of financial statements in accordance with generally accepted accounting principles, and that receipts and expenditures of the company are being made only in accordance with authorizations of management and directors of the company; and (3) provide reasonable assurance regarding prevention or timely detection of unauthorized acquisition, use, or disposition of the company’s assets that could have a material effect on the financial statements.
Because of its inherent limitations, internal control over financial reporting may not prevent or detect misstatements. Also, projections of any evaluation of effectiveness to future periods are subject to the risk that controls may become inadequate because of changes in conditions, or that the degree of compliance with the policies or procedures may deteriorate.
/s/ Ernst & Young LLP
Phoenix, Arizona
December 18, 2025
Item 9B. Other Information.
(a) Information Required to be Disclosed on Form 8-K
None.
(b) Trading Plans
During the quarter ended October 4, 2025 no director or Section 16 officer adopted or terminated any Rule 10b5-1 trading arrangements or non-Rule 10b5-1 trading arrangements (in each case, as defined in Item 408(a) of Regulation S-K).
Item 9C. Disclosure Regarding Foreign Jurisdictions that Prevent Inspections.
Not applicable.
PART III
Item 10. Directors, Executive Officers and Corporate Governance.
Except as indicated below, information responsive to this item is incorporated herein by reference to our Proxy Statement with respect to our 2026 Annual Meeting of Shareholders to be filed with the SEC within 120 days after the end of our fiscal year covered by this Annual Report on Form 10-K, including under the headings “Corporate Governance,” “Insider Trading Policy and Policies Prohibiting Hedging or Pledging,” “Proposal 1: Election of Directors,” “Information about Our Executive Officers,” and, if applicable, “Delinquent Section 16(a) Reports.”
We have adopted a Code of Ethics that applies to all of our directors, officers, and employees, including our Principal Executive, Principal Financial, and Principal Accounting Officers, or persons performing similar functions. Our Code of Ethics is posted on the investor relations page of our website: www.lesliespool.com. We intend to disclose future amendments to certain provisions of the Code of Ethics, and waivers of the Code of Ethics granted to executive officers and directors, on the website within four business days following the date of the amendment or waiver.
Item 11. Executive Compensation.
Information responsive to this item is incorporated herein by reference to our Proxy Statement with respect to our 2026 Annual Meeting of Shareholders to be filed with the SEC within 120 days after the end of our fiscal year covered by this Annual Report on Form 10-K, including under the headings “Compensation Discussion and Analysis”, “Director Compensation,” and “Compensation Committee Interlocks and Insider Participation.”
Item 12. Security Ownership of Certain Beneficial Owners and Management and Related Stockholder Matters.
Information responsive to this item is incorporated herein by reference to our Proxy Statement with respect to our 2026 Annual Meeting of Shareholders to be filed with the SEC within 120 days after the end of our fiscal year covered by this Annual Report on Form 10-K, including under the headings “Beneficial Ownership of Securities” and “Compensation Discussion and Analysis.”
Item 13. Certain Relationships and Related Transactions, and Director Independence.
Information responsive to this item is incorporated herein by reference to our Proxy Statement with respect to our 2026 Annual Meeting of Shareholders to be filed with the SEC within 120 days after the end of our fiscal year covered by this Annual Report on Form 10-K, including under the headings “Certain Relationships and Related Party Transactions” and “Director Independence.”
Item 14. Principal Accountant Fees and Services.
Information responsive to this item is incorporated herein by reference to our Proxy Statement with respect to our 2026 Annual Meeting of Shareholders to be filed with the SEC within 120 days after the end of our fiscal year covered by this Annual Report on Form 10-K, including under the heading “Proposal 2: Ratification of Selection of Independent Registered Public Accounting Firm.”
PART IV
Item 15. Exhibits, Financial Statements Schedules.
(a)The following documents are filed as a part of this report:
(1)Financial Statements. The Company’s financial statements are included in Part II, Item 8, Financial Statements and Supplementary Data.
(2)Financial Statements Schedules. All schedules are omitted since they are not applicable, not required, or the information required to be set forth therein is included under Part II, Item 8, Financial Statements and Supplementary Data.
(3)Exhibits. The exhibits listed in the Exhibit Index immediately below are filed as part of this Annual Report on Form 10-K.
|
|
|
|
|
|
|
|
|
|
|
|
|
Incorporated by Reference |
Exhibit Number |
|
Exhibit Description |
|
Form |
|
Exhibit |
|
Filing Date/ Period End Date |
3.1 |
|
Seventh Amended and Restated Certificate of Incorporation, effective as of March 16, 2023 |
|
8-K |
|
3.1 |
|
3/17/2025 |
3.2 |
|
Certificate of Amendment to the Seventh Amended and Restated Certificate of Incorporation, effective as of September 26, 2025 |
|
8-K |
|
3.1 |
|
9/29/2025 |
3.3 |
|
Amended and Restated Bylaws, effective as of August 13, 2024 |
|
8-K |
|
3.1 |
|
8/15/2024 |
4.1 |
|
Indenture, dated as of August 16, 2016, by and among Leslie’s Poolmart, Inc., Leslie’s Holdings, Inc., the other guarantors party thereto and U.S. Bank National Association, as Trustee |
|
S-1/A |
|
4.1 |
|
10/22/2020 |
4.2 |
|
First Supplemental Indenture, dated as of October 26, 2016, by and among Leslie’s Poolmart, Inc., Leslie’s Holdings, Inc., the other guarantors party thereto and U.S. Bank National Association, as Trustee |
|
S-1/A |
|
4.2 |
|
10/22/2020 |
4.3 |
|
Second Supplemental Indenture, dated as of February 3, 2017, by and among Leslie’s Poolmart, Inc., Leslie’s Holdings, Inc., the other guarantors party thereto and U.S. Bank National Association, as Trustee |
|
S-1/A |
|
4.3 |
|
10/22/2020 |
4.8 |
|
Description of Securities Registered under Section 12 of the Securities Exchange Act of 1934 |
|
10-K |
|
4.5 |
|
12/23/2020 |
10.1# |
|
Form of Indemnification Agreement between Leslie’s, Inc. and its directors and officers |
|
S-1/A |
|
10.1 |
|
10/22/2020 |
10.2# |
|
2020 Amended and Restated Omnibus Incentive Plan |
|
8-K |
|
10.1 |
|
3/19/2024 |
10.3# |
|
Form of Stock Option Agreement pursuant to 2020 Omnibus Incentive Plan |
|
S-1/A |
|
10.3 |
|
10/22/2020 |
10.4# |
|
Form of Restricted Stock Unit Agreement pursuant to 2020 Omnibus Incentive Plan |
|
10-Q |
|
10.2 |
|
2/3/2023 |
10.5# |
|
2025 Form of Performance Unit Award Agreement pursuant to 2020 Omnibus Incentive Plan |
|
10-Q |
|
10.1 |
|
2/6/2025 |
10.6# |
|
2024 Form of Performance Unit Award Agreement pursuant to 2020 Omnibus Incentive Plan |
|
10-Q |
|
10.1 |
|
2/2/2024 |
10.7* |
|
Incremental Amendment No. 1, dated as of June 8, 2023, to the Term Loan Credit Agreement among Leslie’s Poolmart, Inc., Leslie’s Holdings, Inc., the lenders party thereto from time-to-time and Alter Domus (us) LLC, as administrative agent and as collateral agent |
|
|
|
|
|
|
10.8 |
|
Amendment No. 7, dated as of April 3, 2024, to the Credit Agreement among Leslie’s Poolmart, Inc., Leslie’s, Inc., and the subsidiary borrowers named therein, Bank of America, N.A., as Administrative Agent, and U.S. Bank National Association, Co-Collateral Agent |
|
8-K |
|
10.1 |
|
4/9/2024 |
10.9# |
|
Leslie’s, Inc. Annual Incentive Plan |
|
10-Q |
|
10.1 |
|
2/3/2023 |
10.10# |
|
Executive Severance Pay Plan, dated July 17, 2023, by and between Leslie’s Poolmart, Inc. and Scott Bowman |
|
10-Q |
|
10.3 |
|
8/3/2023 |
10.11# |
|
Executive Severance Pay Plan, dated October 19, 2022, by and between Leslie’s Poolmart, Inc. and Naomi Cramer |
|
10-K |
|
10.31 |
|
11/29/2023 |
|
|
|
|
|
|
|
|
|
10.12# |
|
Executive Severance Pay Plan, dated April 23, 2024, by and between Leslie’s Poolmart, Inc and Benjamin Lindquist |
|
10-Q |
|
10.2 |
|
5/9/2024 |
10.13# |
|
Executive Severance Pay Plan, dated August 20, 2024 by and between Leslie’s Poolmart, Inc. and Jason McDonell |
|
10-K |
|
10.33 |
|
11/27/2024 |
10.14#* |
|
Executive Severance Pay Plan |
|
|
|
|
|
|
10.15# |
|
Deferred Compensation Plan |
|
10-K |
|
10.34 |
|
11/27/2024 |
10.16# |
|
Offer Letter, dated as of March 12, 2025, by and between Leslie’s Poolmart, Inc. and Tony Iskander |
|
10-Q |
|
10.1 |
|
5/8/2025 |
10.17# |
|
Offer Letter, dated as of March 13, 2025, by and between Leslie’s Poolmart, Inc. and Naomi Cramer |
|
10-Q |
|
10.2 |
|
5/8/2025 |
10.18# |
|
Offer Letter, dated as of July 10 2025, by and between Leslie’s Poolmart, Inc. and Amy College |
|
8-K |
|
10.1 |
|
7/15/2025 |
10.19# |
|
Offer Letter, dated as of September 12, 2025, by and between Leslie’s Poolmart, Inc. and Jeff White |
|
8-K |
|
10.1 |
|
9/16/2025 |
10.20# |
|
Offer Letter, dated as of September 16, 2025, by and between Leslie’s Poolmart, Inc. and Tony Iskander |
|
8-K |
|
10.2 |
|
9/16/2025 |
19.1 |
|
Insider Trading Policy |
|
10-K |
|
19.1 |
|
11/27/2024 |
21.1* |
|
Subsidiaries of Registrant |
|
|
|
|
|
|
23.1* |
|
Consent of Independent Registered Public Accounting Firm |
|
|
|
|
|
|
31.1* |
|
Certification of Principal Executive Officer Pursuant to Rules 13a-14(a) and 15d-14(a) under the Securities Exchange Act of 1934 |
|
|
|
|
|
|
31.2* |
|
Certification of Principal Financial Officer Pursuant to Rules 13a-14(a) and 15d-14(a) under the Securities Exchange Act of 1934 |
|
|
|
|
|
|
32.1*+ |
|
Certification of Principal Executive Officer Pursuant to 18 U.S.C. Section 1350 |
|
|
|
|
|
|
32.2*+ |
|
Certification of Principal Financial Officer Pursuant to 18 U.S.C. Section 1350 |
|
|
|
|
|
|
97.1# |
|
Leslie’s, Inc. Compensation Recovery Policy |
|
10-K |
|
97.1 |
|
11/29/2023 |
101.INS* |
|
Inline XBRL Instance Document |
|
|
|
|
|
|
101.SCH* |
|
Inline XBRL Schema Document |
|
|
|
|
|
|
101.CAL* |
|
Inline XBRL Calculation Linkbase Document |
|
|
|
|
|
|
101.LAB* |
|
Inline XBRL Label Linkbase Document |
|
|
|
|
|
|
104* |
|
The cover page from the Company’s Annual Report on Form 10-K for the year ended October 4, 2025, formatted in Inline XBRL (included as Exhibit 101) |
|
|
|
|
|
|
* Filed herewith.
# Indicates a management contract or compensatory plan or arrangement.
+ Furnished herewith and not deemed to be “filed” for purposes of Section 18 of the Securities Exchange Act of 1934, as amended, and shall not be deemed to be incorporated by reference into any filing under the Securities Act of 1933, as amended, or the Securities Exchange Act of 1934, as amended.
Item 16. Form 10-K Summary.
None.
SIGNATURES
Pursuant to the requirements of Section 13 or 15(d) of the Securities Exchange Act of 1934, as amended, the Registrant has duly caused this Report to be signed on its behalf by the undersigned, thereunto duly authorized.
|
|
|
|
|
|
LESLIE’S, INC. |
|
|
|
|
Date: December 18, 2025 |
|
By: |
/s/ Jason McDonell |
|
|
|
Jason McDonell |
|
|
|
Chief Executive Officer |
|
|
|
(Principal Executive Officer) |
Pursuant to the requirements of the Securities Exchange Act of 1934, as amended, this Report has been signed below by the following persons on behalf of the Registrant in the capacities and on the dates indicated.
|
|
|
|
|
Name |
|
Title |
|
Date |
|
|
|
|
|
/s/ John Strain |
|
Chairman |
|
December 18, 2025 |
John Strain |
|
|
|
|
|
|
|
|
|
/s/ Jason McDonell |
|
Chief Executive Officer (Principal Executive Officer) and Director |
|
December 18 2025 |
Jason McDonell |
|
|
|
|
|
|
|
|
|
/s/ Jeff White |
|
Chief Financial Officer (Principal Financial Officer and Principal Accounting Officer) |
|
December 18, 2025 |
Jeff White |
|
|
|
|
|
|
|
|
|
/s/ Yolanda Daniel |
|
Director |
|
December 18, 2025 |
Yolanda Daniel |
|
|
|
|
|
|
|
|
|
/s/ Seth Estep |
|
Director |
|
December 18, 2025 |
Seth Estep |
|
|
|
|
|
|
|
|
|
/s/ Lorna Nagler |
|
Director |
|
December 18, 2025 |
Lorna Nagler |
|
|
|
|
|
|
|
|
|
/s/ Maile Naylor |
|
Director |
|
December 18, 2025 |
Maile Naylor |
|
|
|
|
|
|
|
|
|
/s/ Susan O’Farrell |
|
Director |
|
December 18, 2025 |
Susan O’Farrell |
|
|
|
|
|
|
|
|
|
/s/ Claire Spofford |
|
Director |
|
December 18, 2025 |
Claire Spofford |
|
|
|
|